Author: Carol, LianGuaiNews
Affected by external regulatory policies and changes in monetary policies, the cryptocurrency market has been in a state of volatile adjustment this year, with continuous liquidity tightening. In this context, some popular concepts and assets have emerged in the market, and the rotation of these concepts has linked this year’s market trends. In the absence of a long-term upward trend, chasing the rotation of different concepts may seize structural opportunities in the volatile market and achieve excess returns.
Which concepts have risen this year? Which concepts have not risen yet? Among the rising concepts, which concepts have appeared the most frequently? How much theoretical return can structural investment opportunities bring? LianGuaiNews’s data column LianGuaiData has selected 14 concepts and 114 assets for in-depth analysis of their price changes, and the results show:
- From the perspective of the concepts with the highest average weekly growth rate, the 32 natural weeks of this year have formed the rotation of 11 concepts: LSD/LSDFi, Appchain/stack, NFT/NFTFi, SocialFi, Layer2, MEME, Social Trading Bot, BTC, Hong Kong Web3 concept, Wallets, and BRC-20. The leading concept in each rotation has an average weekly increase of 26.42%.
- The repetitiveness of different popular concepts in the rotation sequence provides the possibility for market participants to capture structural opportunities. In the rising rotation process, Social Trading Bot, MEME, and BRC-20 have appeared the most frequently, followed by LSD/LSDFi and SocialFi, which achieved the highest average weekly growth rate within 4-6 natural weeks.
- This year, the overall market has experienced three similar upward trend segments, and the trends of most popular concept assets are similar. Analyzing the duration of the upward trends, it can be found that the overall upward trend weakens in sequence. The average duration of each concept in the first upward trend segment is 48.43 days, and the average durations in the subsequent upward trend segments are 30.04 days, 20.48 days, and 14.86 days, respectively.
- Considering the concept rotation, comparing different strategies reveals that holding BTC is likely to be an investment strategy with a mid-level return. If every hot spot can be accurately grasped, the theoretical return for this year can reach 20 times.
14 popular concepts are popular this year, and BRC-20 and Trading Bots are new concepts
Referring to the popular events reported by the media this year, as well as the asset categories classified by CoinGecko and Dune Analytics (@cryptokoryo), LianGuaiNews has selected a total of 14 popular concepts: Hong Kong Web3 concept, NFT/NFTFi, Layer 2, LSD/LSDFi, MEME, Social Trading Bot, appchain/stack, RWA, Wallets, SocialFi, BRC-20, DEX/Perp DEX, Lending/Borrowing, CEX.
- a16z Partner Four Major Fundamental Theories that Will Impact the Future Development of the Creator Economy
- Is the 25% drop in PEPE, SHIB, and APE a sign of a deepening bear market in cryptocurrency?
- Podcast Notes | Conversation with Standard Crypto Partner Now is the Best Bear Market Cycle in History
These concepts include the Hong Kong Web 3 concept stimulated by policy dividends, the LSDFi concept brought about by Ethereum upgrades, the BTC-20 concept generated by the expansion of Bitcoin application scenarios, the concept of social media trading bots inspired by ChatGPT, as well as the ever-popular MEME concept and past mainstream concepts such as DEX, NFT, and CEX.
Next, according to the market value and market volume, we have selected 5-15 assets in each concept, and also considered mainstream assets BTC and ETH. Finally, we have selected 114 popular assets as the observation samples for this analysis. Some of these assets may belong to two or more popular concepts.
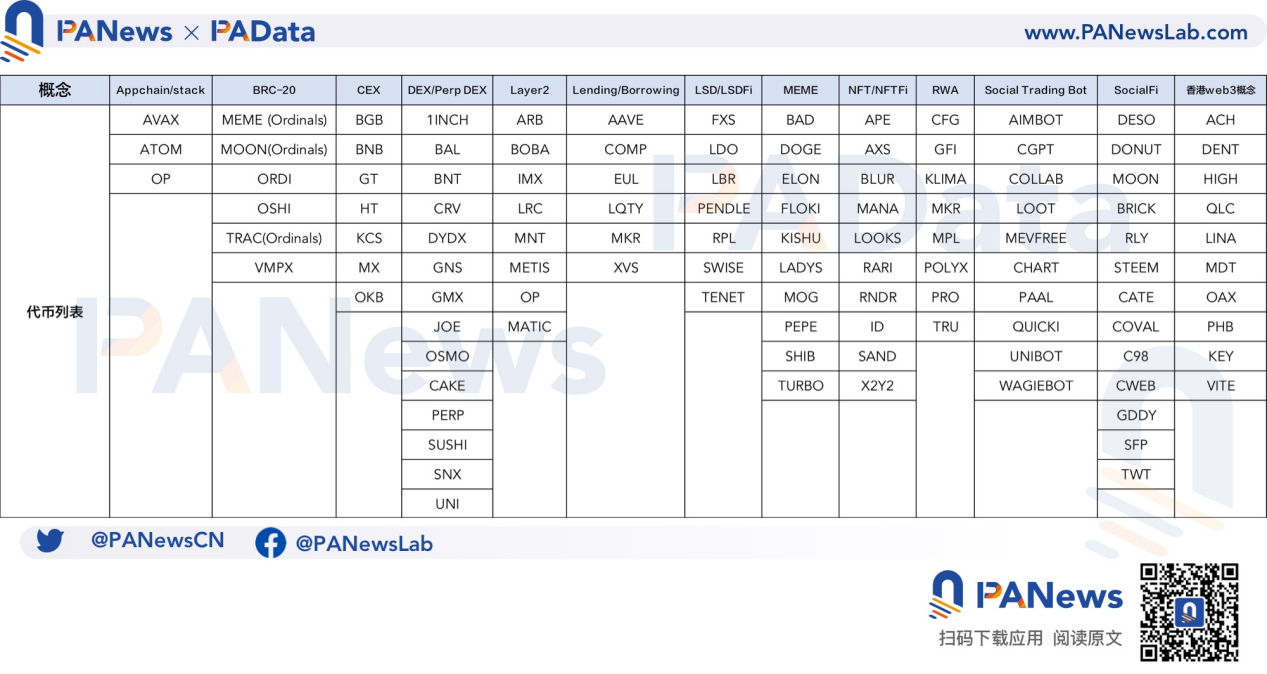
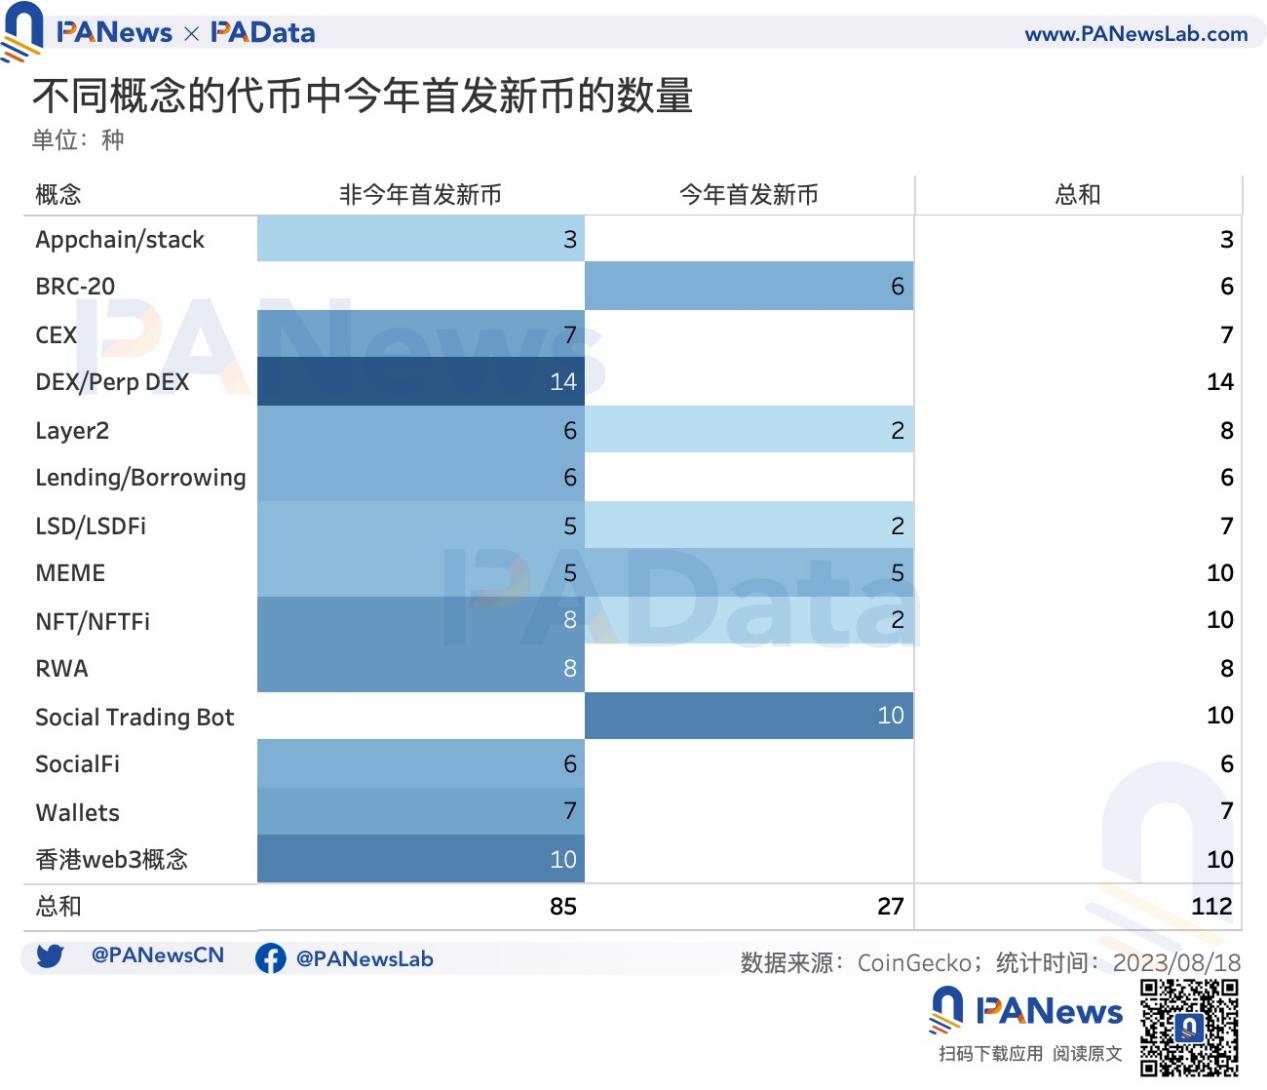
From the listing trading time of the selected observation assets, only BRC-20 and Social Trading Bot are new concepts that appeared this year. The selected observation assets are also newly issued assets this year. Among them, BRC-20 mainly emerged and became popular around May to July this year, and trading bots mainly emerged and became popular around July to August this year. In addition, some newly issued assets this year have also entered the observation list in the four popular concepts of Layer2, LSD/LSDFi, MEME, and NFT/NFTFi. This means that these concepts are more active this year compared to mainstream concepts in the past.
Different concept tokens have rotated and risen, trading bots, MEME, and BRC-20 have the highest number of rises
Which concepts have risen this year? Which concepts have the highest number of rises? In response to this, LianGuaiNews divided the time period from Monday to Sunday into natural weeks and counted the price changes of all assets in different concepts during each natural week this year.
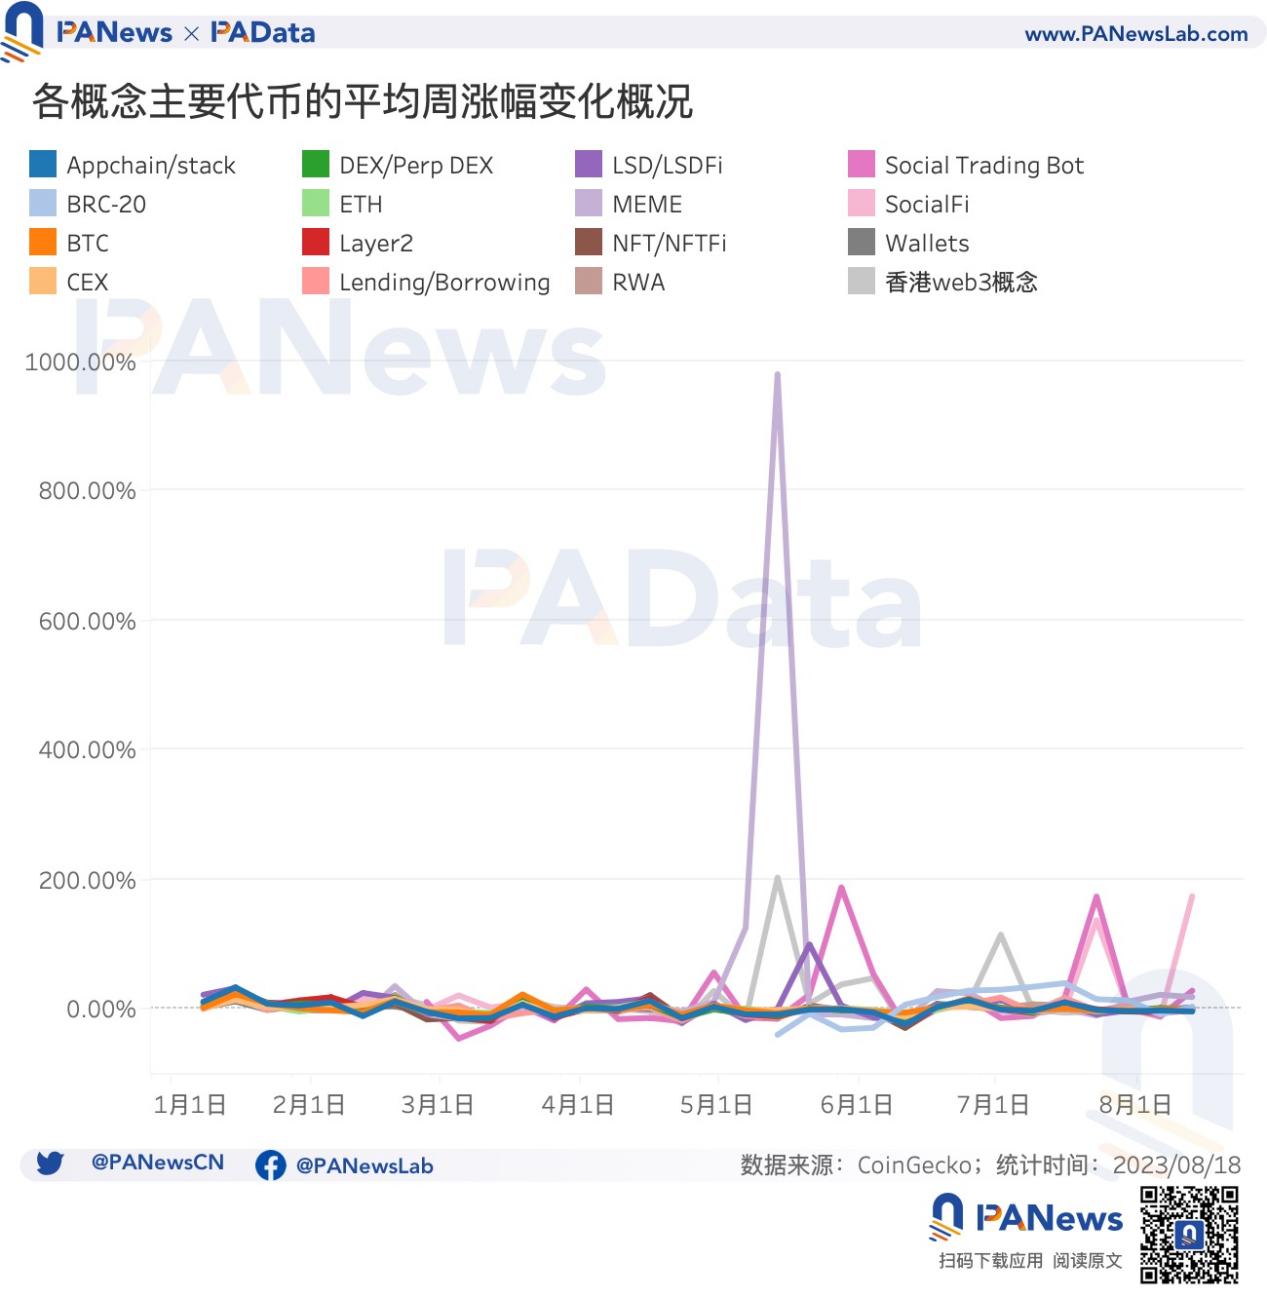
First of all, from an overall perspective, before mid-May, the average weekly increase of the 14 concepts was not significantly differentiated. However, after mid-May, several concepts began to show a significant upward trend, and it was a sharp increase with a natural week as the cycle, which is represented by obvious triangular protrusions in the chart. For example, in the week of May 14th (referring to the week from May 8th to May 14th), the average weekly increase of the MEME concept reached 979.65%, far higher than other concepts, and set the record for the highest weekly increase of a single concept this year. However, this was mainly influenced by the sharp rise in price when LADYS was first listed that week.
Other notable protrusions include the average increase of the Hong Kong Web3 concept of 202.97% in the week of May 14th; the average increase of the LSD/LSDFi concept of 99.86% in the week of May 21st; the average increase of the trading bot concept of 187.89% in the week of May 28th; the average increase of the Hong Kong Web3 concept of 114.79% in the week of July 2nd; the average increases of the trading bot and SocialFi concepts were 173.69% and 137.26% respectively in the week of July 23rd; the average increase of the SocialFi concept in the week of August 13th was 174.21%. From these, it can be clearly seen that different concepts have rotated and risen at different times this year.
In order to present the rotation of different concepts throughout the year more clearly, LianGuaiNews has further selected the concepts with the highest average increase and the concepts with the lowest average increase for each natural week. It can be found that from the perspective of the concepts with the highest average increase per week, a rotation of 11 concepts has been formed in the past 32 natural weeks of this year, including LSD/LSDFi, Appchain/stack, NFT/NFTFi, SocialFi, Layer2, MEME, Social Trading Bot, BTC, Hong Kong web3 concept, Wallets, and BRC-20. RWA, DEX/Perp DEX, Lending/Borrowing, CEX, and ETH did not lead the market this year. The average weekly increase of the concepts leading the rotation this year reached 26.42% (median).
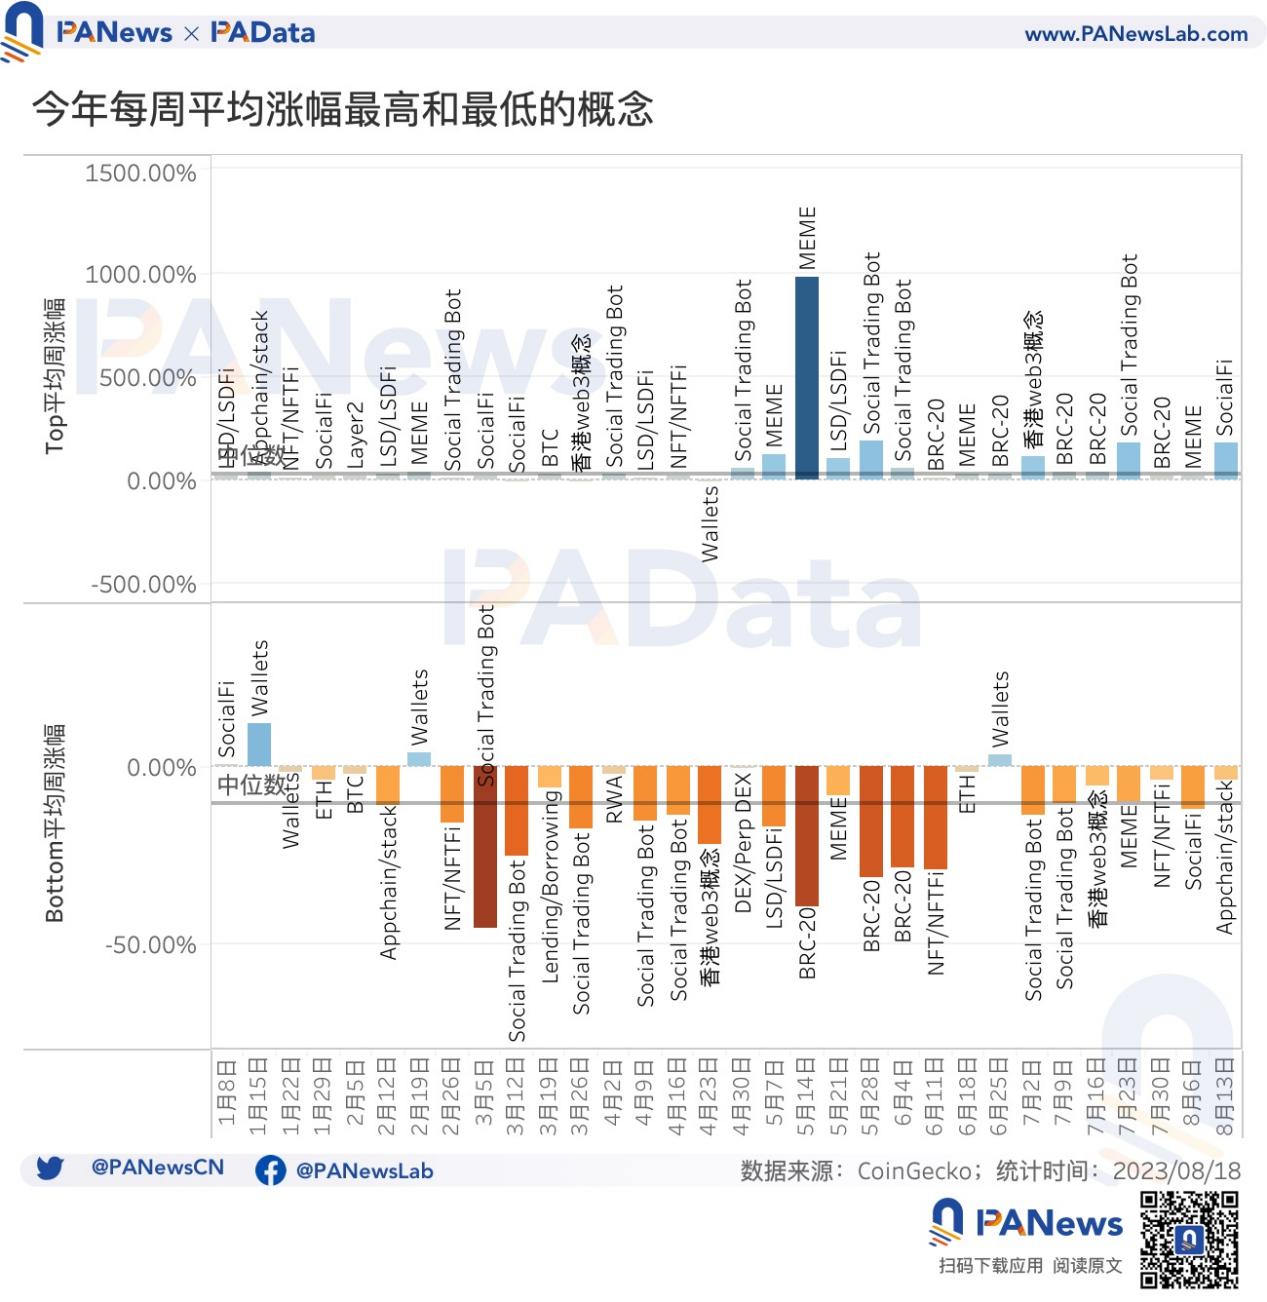
Looking at the concepts with the highest average decline per week, only CEX and Layer2 did not appear among them this year, and the rest of the concepts more or less became the concepts with the highest average decline in a certain week. The average weekly decline of these concepts with the highest average decline reached 10.22% (median).
In the rising rotation process, trading robots, MEME, and BRC-20 appeared the most times, that is, within 6 and 5 natural weeks respectively, the average weekly increase of these concepts was the highest. Secondly, LSD/LSDFi and SocialFi also had the highest average increase in 4 natural weeks this year. These 5 concepts are the best-performing concepts in the rotation this year, while other concepts only appeared 1-2 times in the rising rotation.
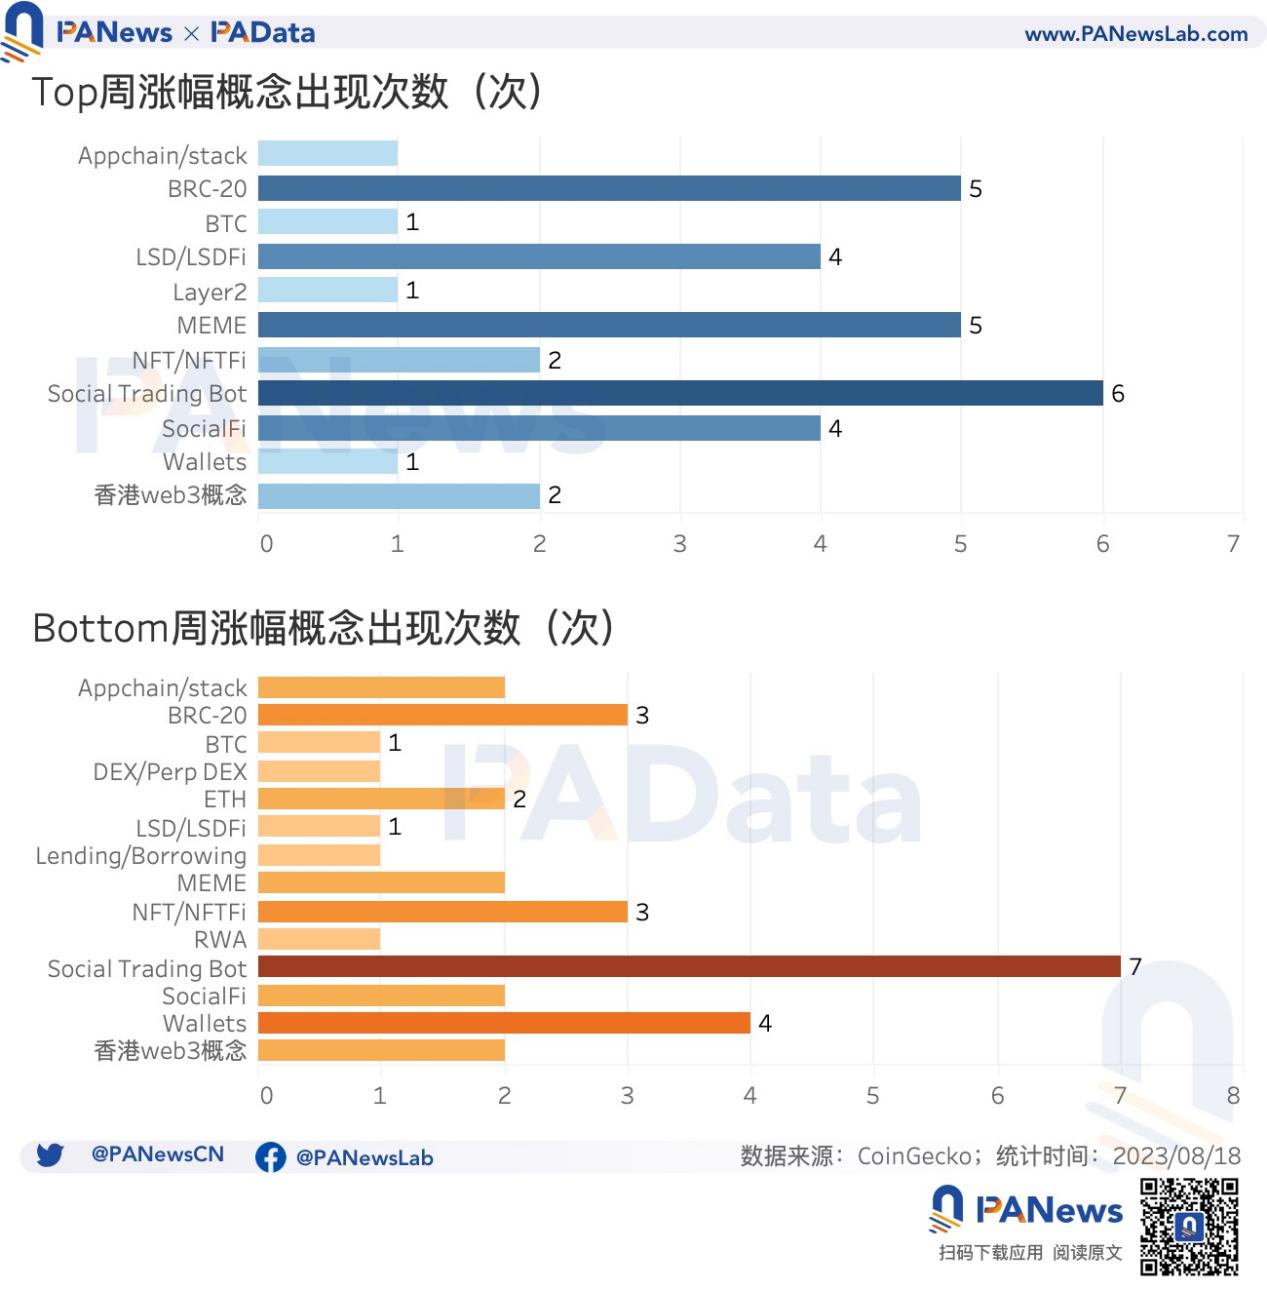
In the declining rotation process, trading robots appeared the most times and had the highest average decline within 7 natural weeks. Secondly, Wallets, NFT/NFTFi, and BRC-20 also had the highest average decline within 3-4 natural weeks, while other concepts had the highest average decline within 1-2 natural weeks.
Overall, trading robots belong to the hot concepts with more intense volatility, appearing multiple times in both the rotation sequence with the highest average increase and the rotation sequence with the highest average decline within a natural week as the time cycle. LSD/LSDFi and SocialFi have relatively smaller fluctuations and appear more times in the rotation sequence with the highest average increase, both belonging to relatively strong sectors. In addition, although some assets in Wallets and NFT/NFTFi have performed well, overall, these two concepts have appeared more times in the rotation sequence with the highest average decline this year, belonging to relatively weak sectors.
The repeatability of different popular concepts in the rotation sequence provides the possibility for market participants to capture structural opportunities.
There have been three major upward trends this year, with long durations and high increases at the beginning of the year.
If we analyze the trends by extending the trading time and reducing the trading frequency, rather than using natural weeks as time periods, the situation is different.
The criteria for determining an upward trend is a period of time where the overall price increases for more than 7 days. The starting point is the time of the recent lowest price, and the endpoint is the time of the recent highest price. During this period, there may be temporary downward trends, but they do not exceed 7 days, and the prices do not reach new lows.
Based on this basic criteria, BTC and ETH, the two major mainstream assets, have experienced similar three upward trends this year. The first upward trend occurred approximately between January 1st and February 21st, the second upward trend occurred approximately between March 11th and April 17th, and the third upward trend occurred approximately between June 15th and July 14th. Among them, the main forces that broke the first upward trend came from changes in external regulatory and financial environments, with key events such as the dual impact of regulatory agencies like the US SEC on LianGuaixos; the latest ruling by the US Federal District Court stating that NFTs may meet the definition of securities; and the collapse of a cooperative bank leading to a crisis for USDC. For some strong sectors, these changes caused interruptions, but for some weak sectors, these changes marked a turning point. The main forces that broke the second and third upward trends mainly came from changes in the financial environment. Against the backdrop of continuous interest rate hikes by the Federal Reserve, liquidity continued to tighten, and there were no emerging new narratives or narratives in their early stages within the industry, resulting in limited funds and a lack of upward momentum. Recently, BTC and ETH have been in a period of adjustment, but there have been some new concepts emerging. These tokens’ recent upward trends are summarized as the fourth upward trend.
By dividing the upward trends of all concept tokens according to the upward trends of BTC and ETH (the overall upward trends), they can be standardized and classified. For example, if a token only starts to rise around June 15th and July 14th, it is considered to be synchronized with the third overall upward trend, but it did not experience the first two overall upward trends. This division is not absolute. The upward trends of some concept tokens span several overall upward trends. For example, MX in the CEX category has been rising since the beginning of the year for 109 days (until June 4th), which is equivalent to spanning the first and second overall upward trends. In statistics, it is classified as part of the first overall upward trend.
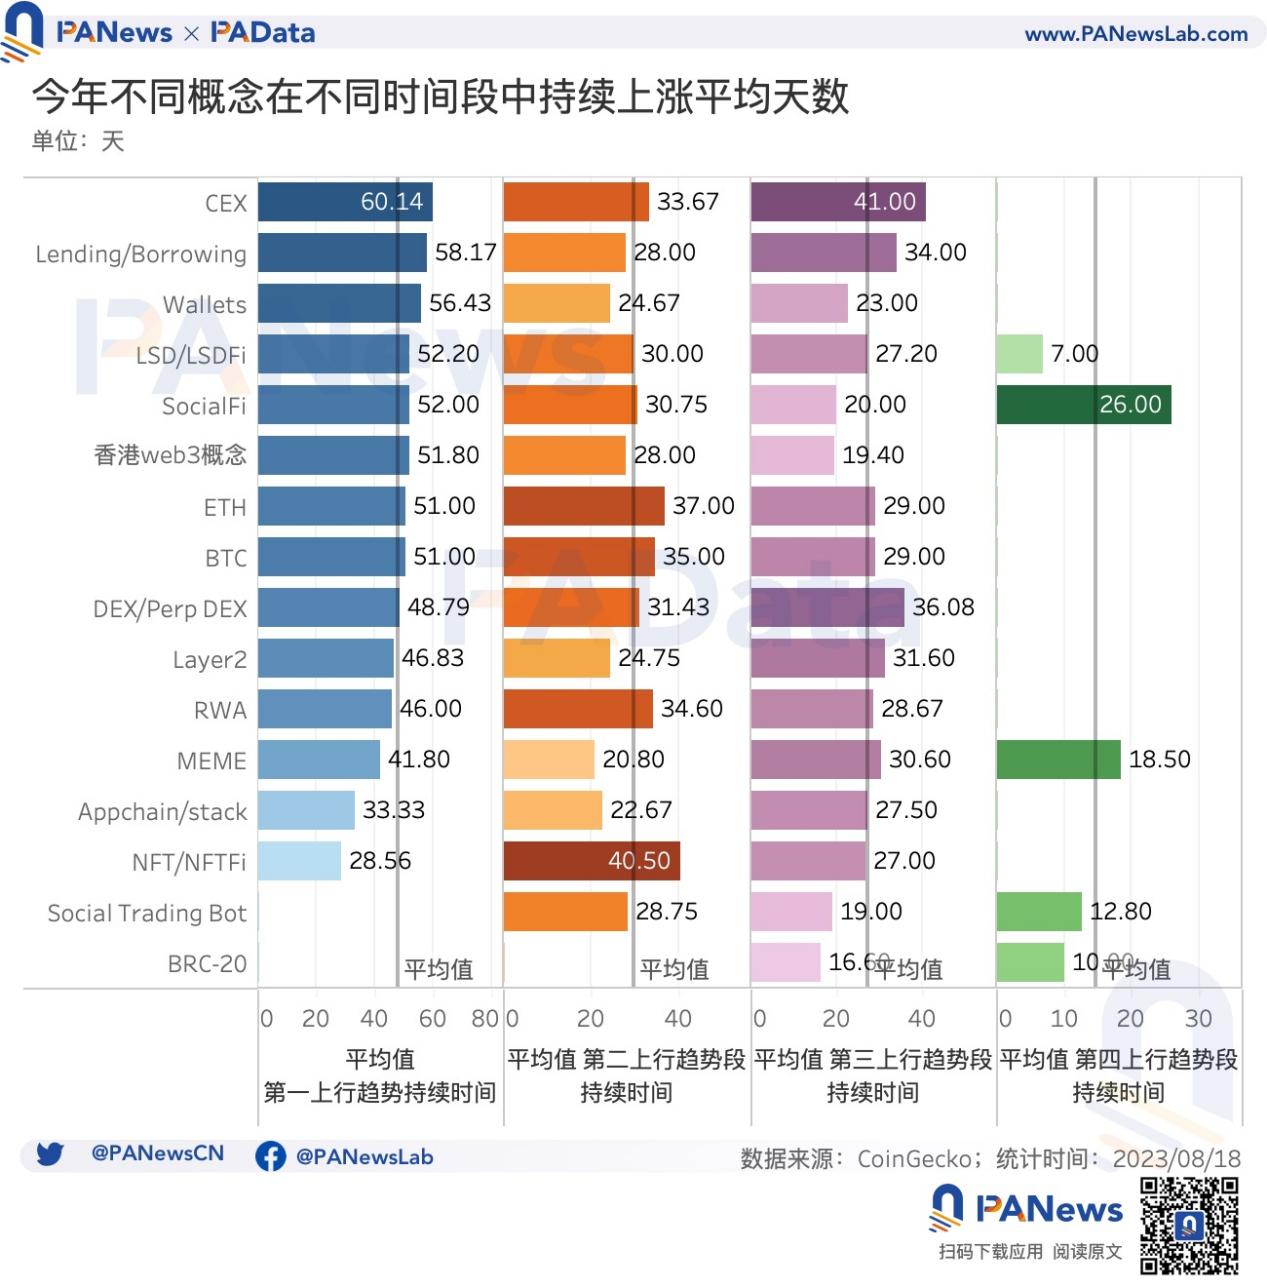
By analyzing the duration of the upward trends, it can be observed that the overall upward trend weakens sequentially. The average duration of concepts in the first upward trend is 48.43 days, followed by average durations of 30.04 days, 20.48 days, and 14.86 days in the subsequent upward trends. Some concepts show slight differences in their upward trend changes compared to the overall trend. For example, the CEX, Layer2, and MEME concepts maintain considerable upward momentum in the third upward trend, with longer average durations than the previous stage. The SocialFi and MEME concepts are influenced by individual assets in the fourth upward trend, extending their upward durations to 26 days and 18.5 days, respectively.
And for most tokens, the highest return during the first uptrend period is the highest return of the year. Some newly launched tokens this year have their highest returns during the recent uptrend period.
Comparison of three structural strategies, the theoretical return rate of chasing hotspots weekly may be much higher than the baseline strategy.
So, what strategies can be used to achieve higher returns when chasing rotation?
First, determine the BTC’s annual holding strategy as a simple baseline strategy, with a theoretical return rate of 60.22%.
Next, based on the above analysis, two concept rotation-based strategies will be considered, and their theoretical return rates will be calculated. Asset allocation and risk hedging are not considered here, only a simple comparison of the theoretical returns of different trading strategies, which does not constitute any investment advice, but only provides a reference for understanding market changes. Both strategies start with an initial total asset of $10,000 and calculate compound interest.
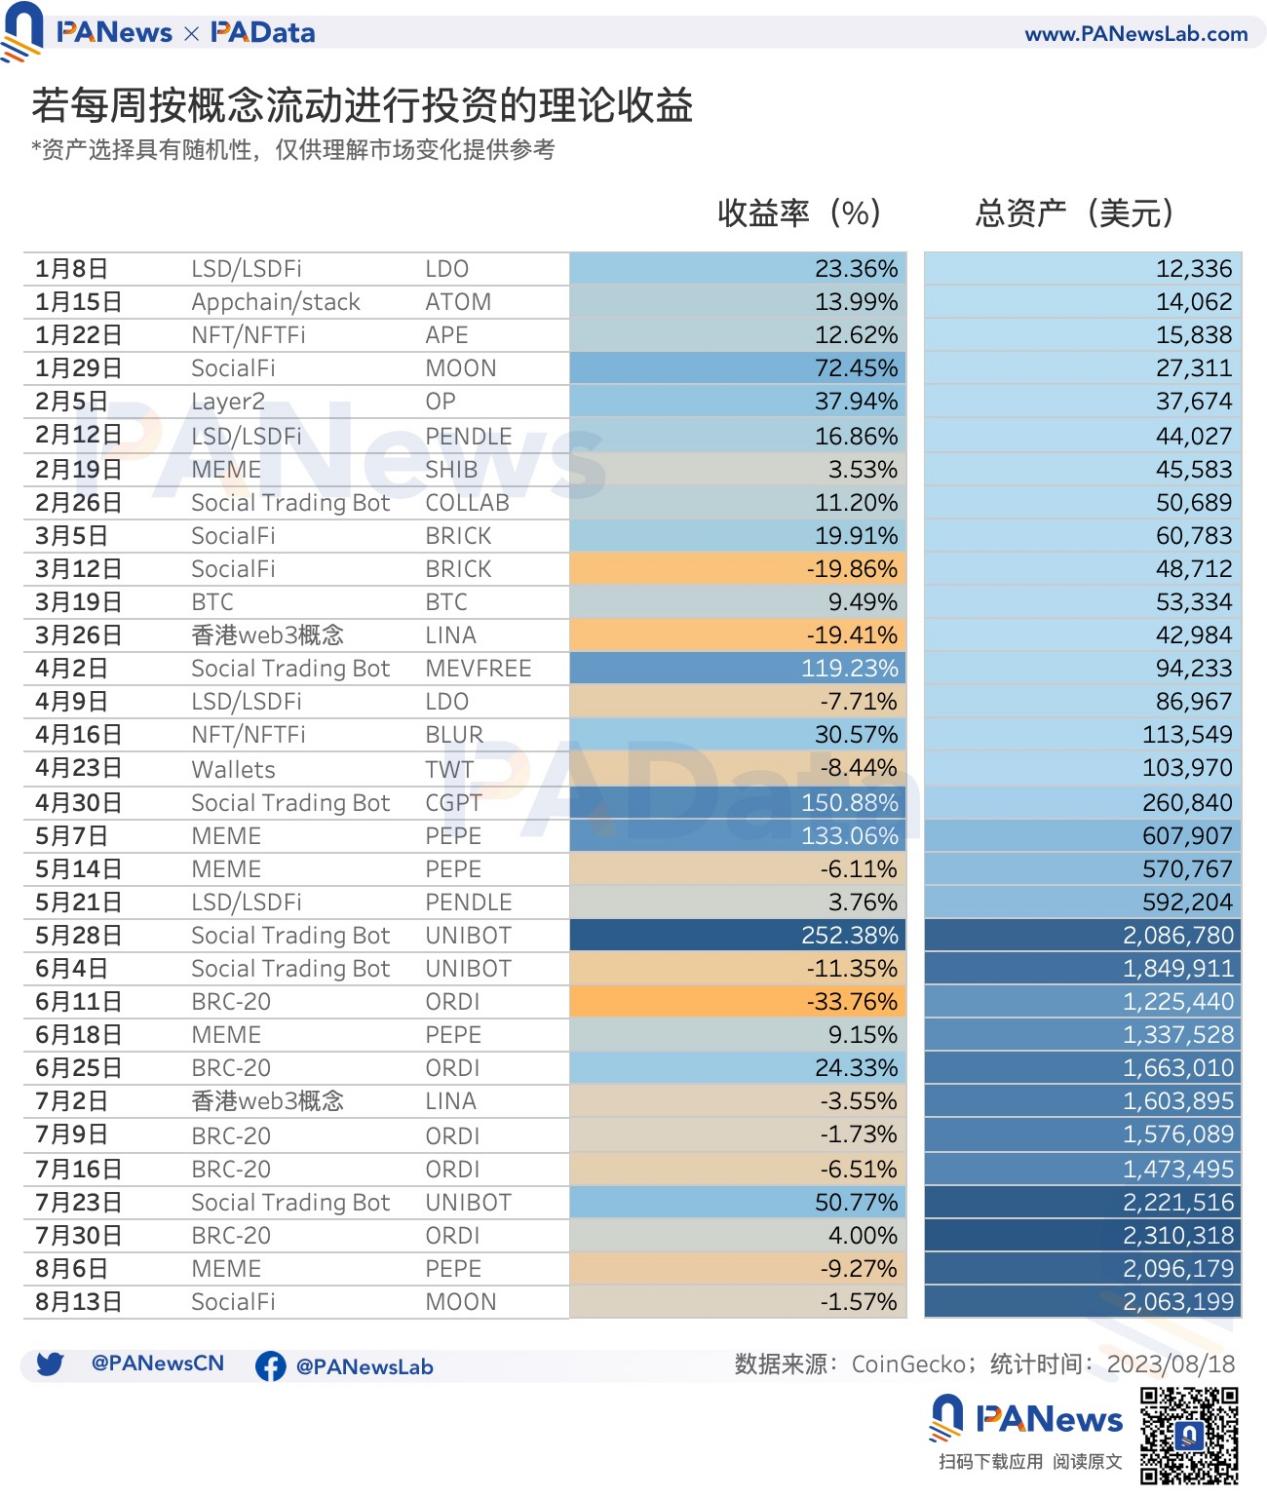
The first concept rotation-based strategy is to chase hotspots weekly. According to the natural week’s time change, buy the asset with the highest increase during the current week, assuming the first two days of each week as observation time, the buying time is Wednesday, and the selling time is Sunday. The asset to buy is randomly selected from the category with the highest increase during the week. According to this strategy, the return rate is about 2053.20%. However, this strategy is highly sensitive to the selected assets. For example, if the assets for the week of July 23 are changed from UNIBOT to LianGuaiAL, the return rate of this strategy will decrease to 389.66%.
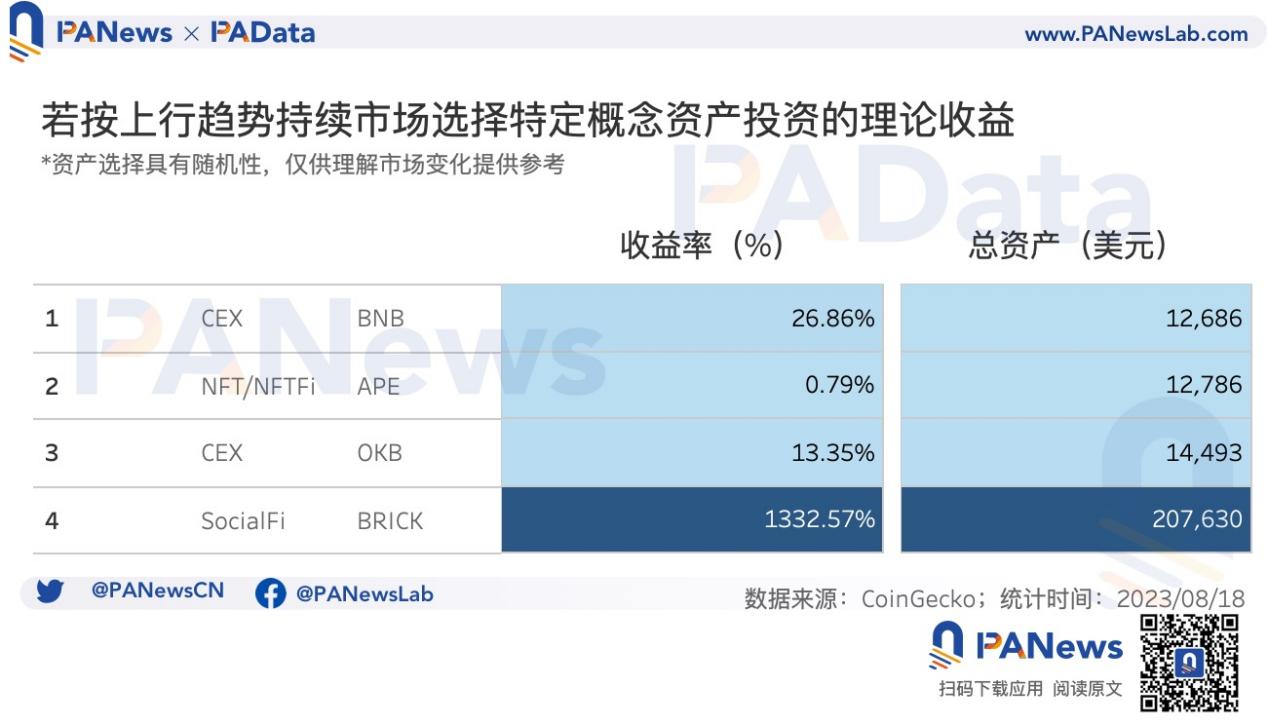
The second concept rotation-based strategy is to reduce the trading frequency and rotate assets based on the longest duration of the uptrend period. Assuming there are 3 days for observation for both buying and selling, the buying time is 3 days after the start of the uptrend period, and the selling time is 3 days after the end of the uptrend period. The asset to buy is randomly selected from the category with the longest duration of the upward movement during this period. There may be a period of no positions between different uptrend periods. According to this strategy, the return rate is about 1536.67%. However, this is only due to choosing the asset BRICK during the fourth uptrend period from the end of July to early August, which greatly increased the return rate. But if we only consider the first three uptrend periods and exclude the fourth one, the return rate of this strategy is about 44.93%.
Overall, holding BTC is likely to be an investment strategy with a moderate return rate. If you chase hotspots weekly, the theoretical return rate may be much higher than the baseline strategy, but the actual return is highly dependent on the selected assets, so the theoretical return range of this strategy is also large. If you participate in the market with a lower trading frequency based on the duration of the uptrend, it is possible to generate a theoretical return rate lower than the baseline strategy, which mainly depends on how many uptrend periods you participate in.
Different understandings of concept rotation can lead to significant differences in final returns, but overall, participating in the rise of a popular concept will significantly boost the theoretical rate of return on annual investments. In addition to focusing on newly emerging concepts and tokens, grasping the concept rotation also involves paying attention to opportunities for the rotation of past concepts.
Like what you're reading? Subscribe to our top stories.
We will continue to update Gambling Chain; if you have any questions or suggestions, please contact us!
