A. Market Perspectives
1. Macro Liquidity
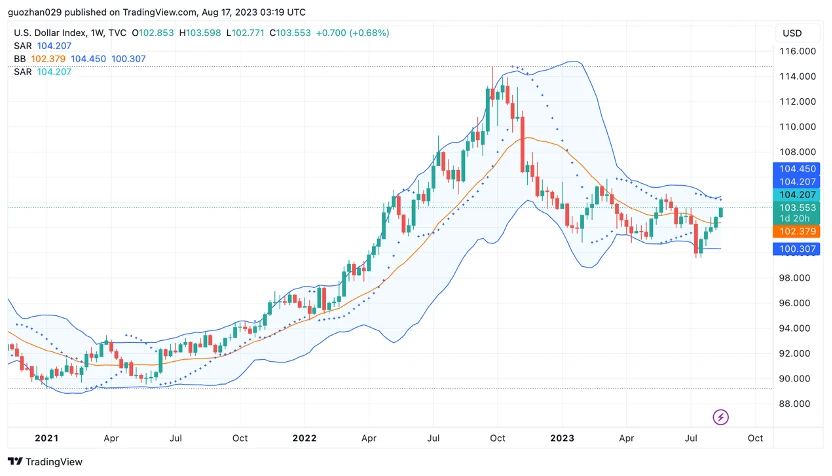
Monetary liquidity is tightening. Inflationary pressures persist in the United States, fueling expectations for the Federal Reserve and the European Central Bank to maintain high interest rates for a longer period of time. Hawkish signals from the Federal Reserve minutes suggest a continuation of rate hikes in September, and the 10-year U.S. Treasury yield has reached its highest level since 2008. The U.S. Dollar Index has started to rebound, putting pressure on all risk assets. The weekly performance of U.S. stocks is declining. The crypto market is following the weak performance of U.S. stocks.
2. Overall Market Trends
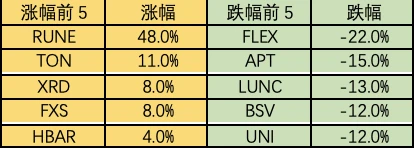
Top 100 market cap gainers:
- Analysis of 6 recent projects that have seen a counter-trend surge Can this speculative frenzy in blockchain continue into a bull market?
- Selected Weekly Highlights BTC and ETH experience flash crashes, causing $1 billion in liquidations; Sei airdrop sparks controversy; LianGuaiNews Hong Kong and Taiwan branch officially established.
- Reflecting on the Cryptocurrency Market Returning to Common Sense and Rationally Examining Market Chaos
The market has continued its weak performance this week. Most altcoins have seen a general decline, with rotation across various sectors from initial public chains and DeFi (RWA) to gaming and meme coins. Centralized exchanges are experiencing a lack of liquidity, repeatedly squeezing small-cap tokens. On the other hand, on-chain activity has been flourishing, reaching new highs, with selected on-chain tokens such as RLB, UNIBOT, BITCOIN (HarryPotter), and OX. The market focus revolves around meme coins.
-
RUNE: THORChain is a cross-chain DeFi project based on the Cosmos ecosystem. It recently launched lending services and adopted a deflationary model. THORChain was quite active during the last bull market due to its economic model, which includes a triple leverage effect, amplifying both gains and losses.
-
MC: The gaming guild industry is nearing its bottom. MeritCircle has a fully diluted market cap of approximately $200 million, but its treasury holds around $100 million in disposable funds. The release of chips is nearing completion, providing a high safety margin. The recent short squeeze of YGG, a project in the same sector, has attracted market attention.
-
BITCOIN (HarryPotter): A leading meme coin on the blockchain, riding on the popularity of BTC. The project has a somewhat eccentric operation and has experienced a near-zero washout before rebounding. It is currently the 6th largest meme coin by market capitalization.
3. BTC Market Trends
1) On-chain Data
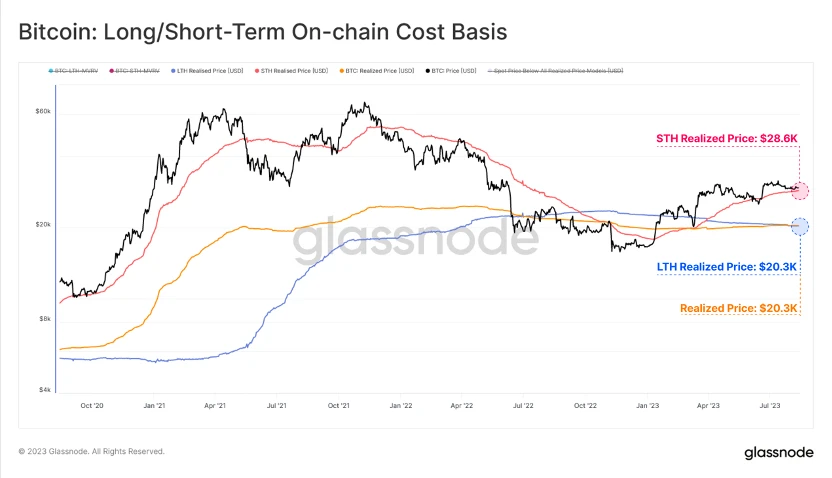
The BTC market continues to trade within a historically low volatility range. In fact, most BTC traders are still underwater. The short-term cost for traders within the past six months is around $28,600, while for long-term traders, the cost is much lower at $20,300. It is expected that the BTC market will mainly fluctuate within this range in the short term.
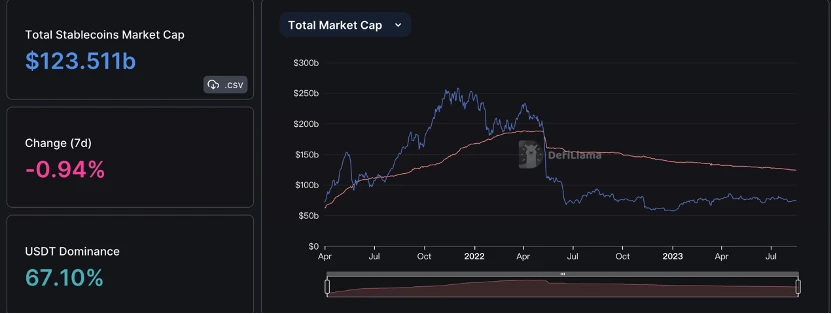
Stablecoins continue to flow out. The market value of USDT has seen an unusual decline of $500 million, indicating that more funds, especially from U.S. investors, are still exiting the market, and the market sentiment is still not optimistic.
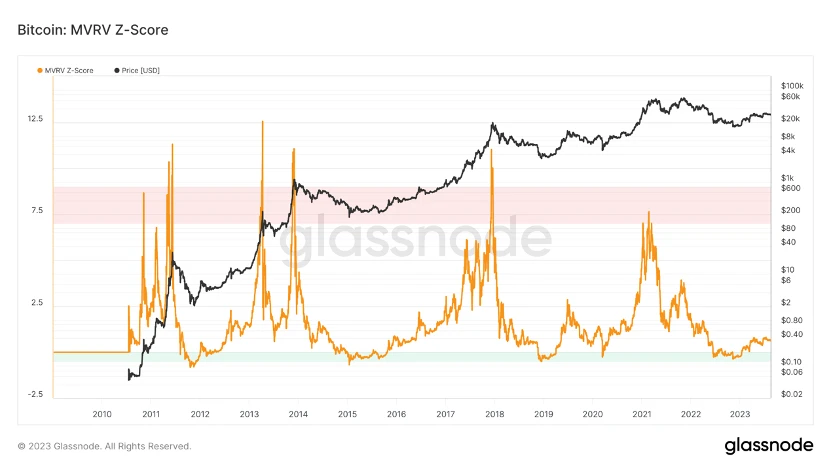
The long-term trend indicator MVRV-ZScore is based on the market’s total cost and reflects the overall profitability of the market. When the indicator is greater than 6, it is in the top range; when the indicator is less than 2, it is in the bottom range. When MVRV falls below the key level of 1, holders are generally in a loss state. The current indicator is 0.61, entering the recovery phase.
2) Futures market
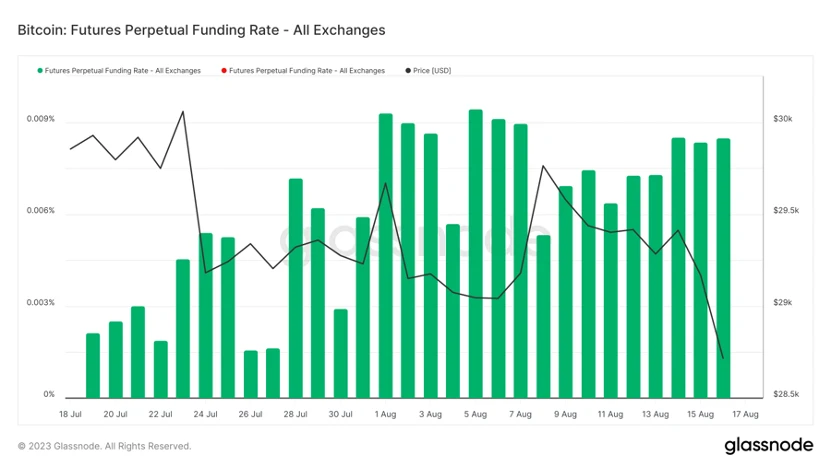
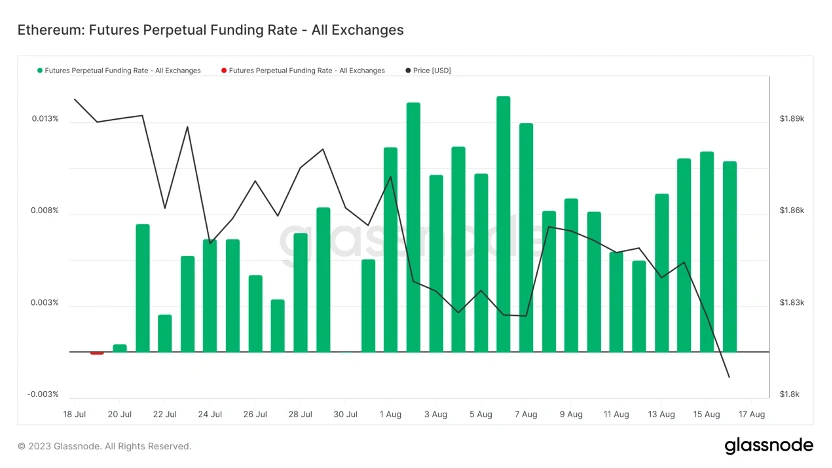
Funding rate: The rate is biased towards long positions this week. Rates range from 0.05% to 0.1%, indicating a high level of long leverage and a short-term market top; rates range from -0.1% to 0%, indicating a high level of short leverage and a short-term market bottom.
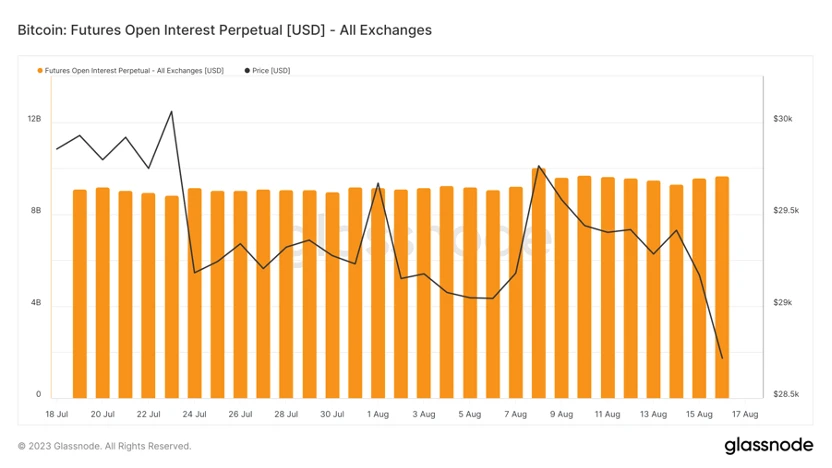
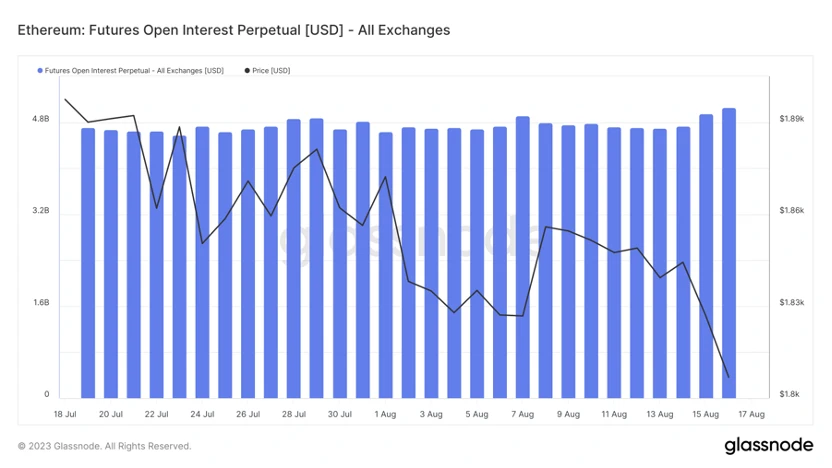
Open interest: The total open interest has slightly increased this week.
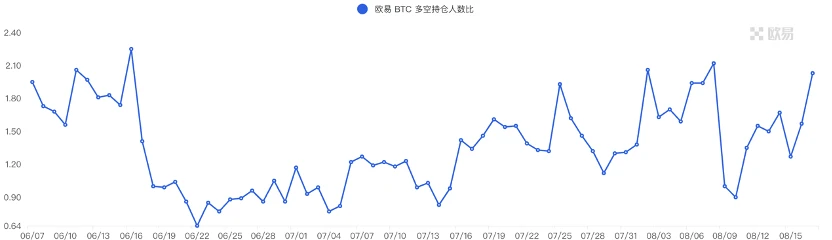
Long/short ratio: 2.3. The market has a strong intention to buy at the bottom. Retail sentiment is mostly a contrarian indicator, with panic below 0.7 and greed above 2.0. The fluctuation of the long/short ratio data weakens its reference significance.
3) Spot market
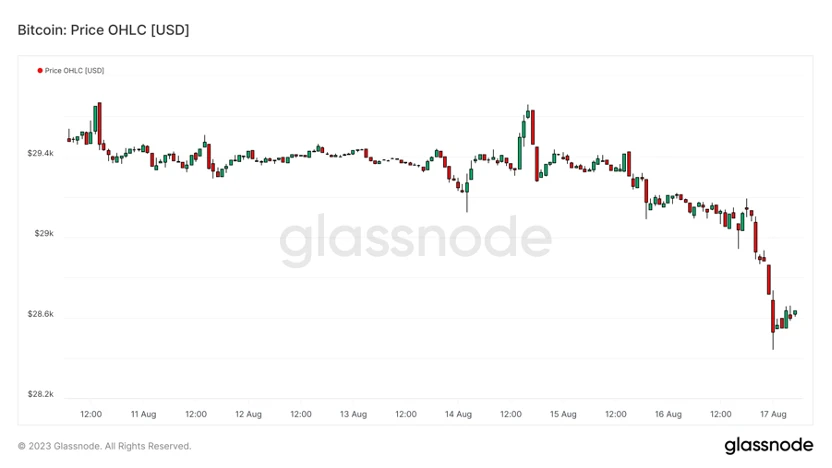
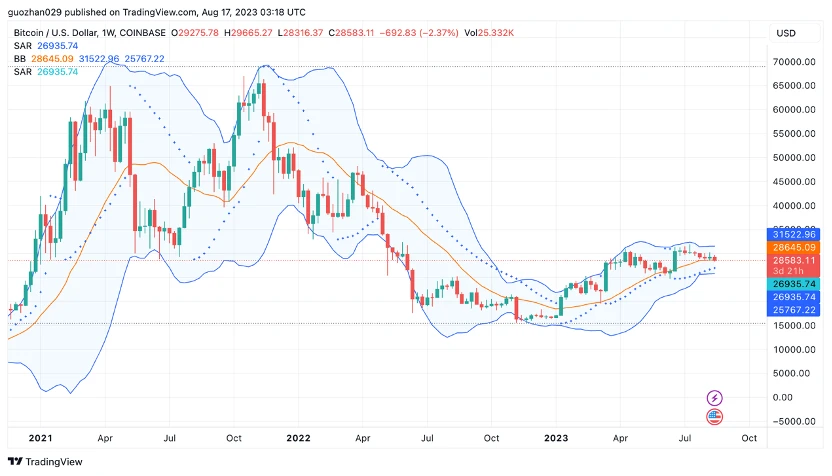
BTC daily chart broke down this week. Last week, the US SEC did not approve the BTC spot ETF, and the rebound failed to make a new high. The market continues to decline. Volatility has dropped to a historical low, and after compression, it usually accompanies a huge price impact. In the short term, the market is likely to follow the adjustment of the US stock market before the Fed’s interest rate decision in September, which will be a good time to enter the bull market.
B. Market Data
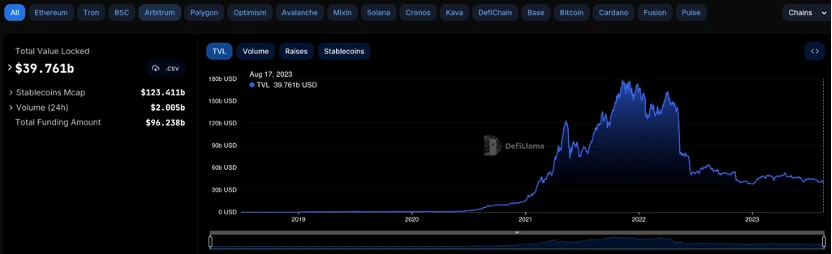
1. Total lock-up volume of public chains
2. Proportional distribution of TVL on different public chains
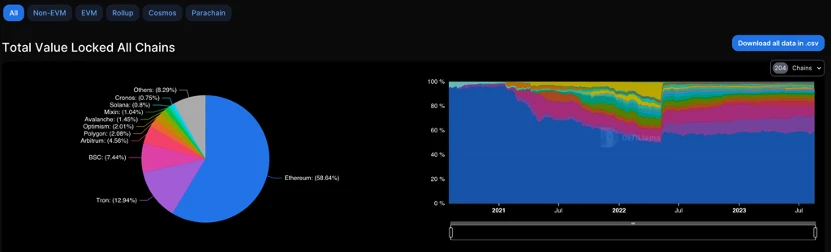
TVL decreased by 1.9 billion this week, a decrease of 4.6%. The total TVL has been oscillating at the bottom in recent weeks without an upward trend. The proportion of ETH chain this week is basically the same as last week, with a slight increase of 0.6%. The TVL of all Layer2 public chains is declining, with Arbitrum down 8.1% and Optimism down 8.7%, the largest decrease. Overall, only Solana did not decrease, with an increase of nearly 0.1%. The TVL of Base Chain increased by 7% today and the increase in the past 7 days is 222%.
III. Lock-up amount of various chain protocols
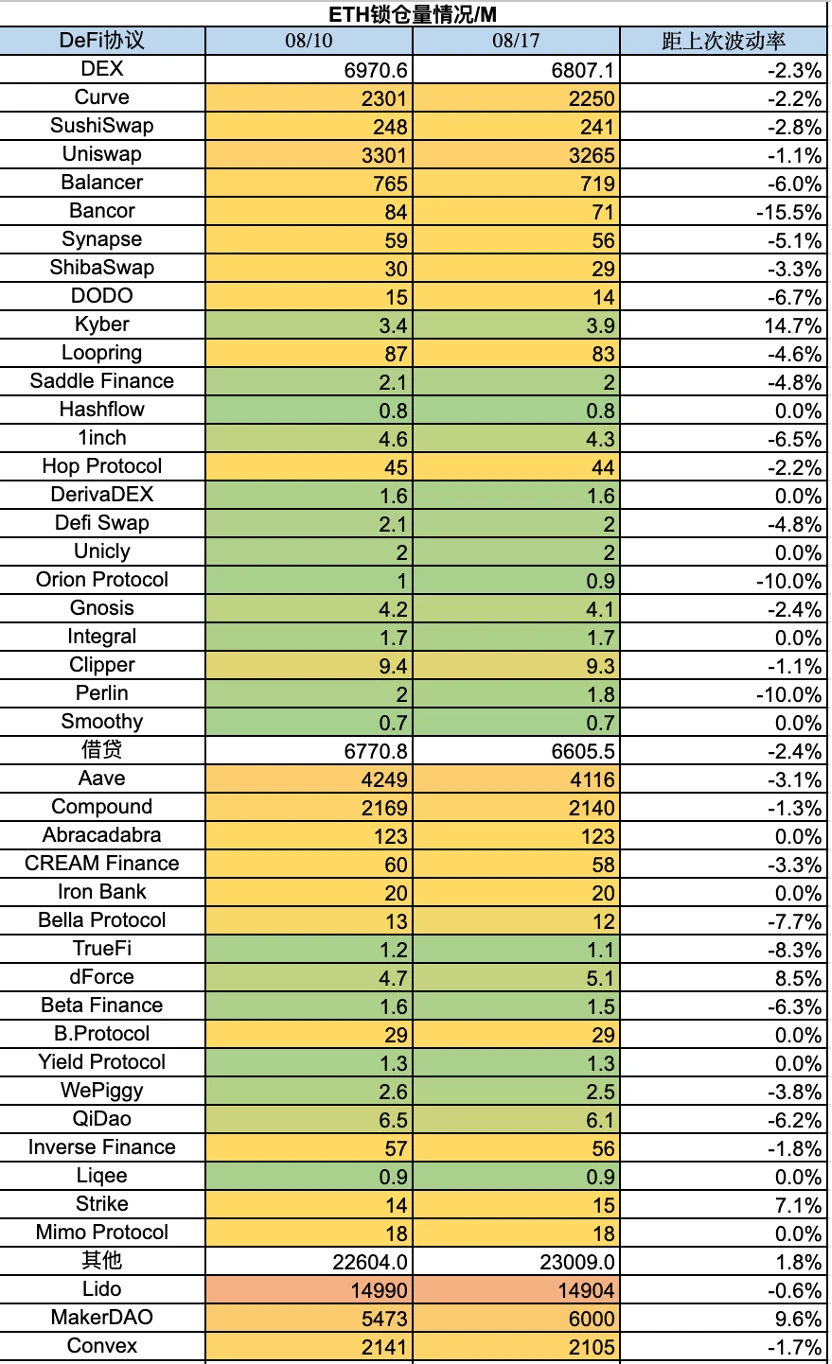
1) ETH lock-up amount
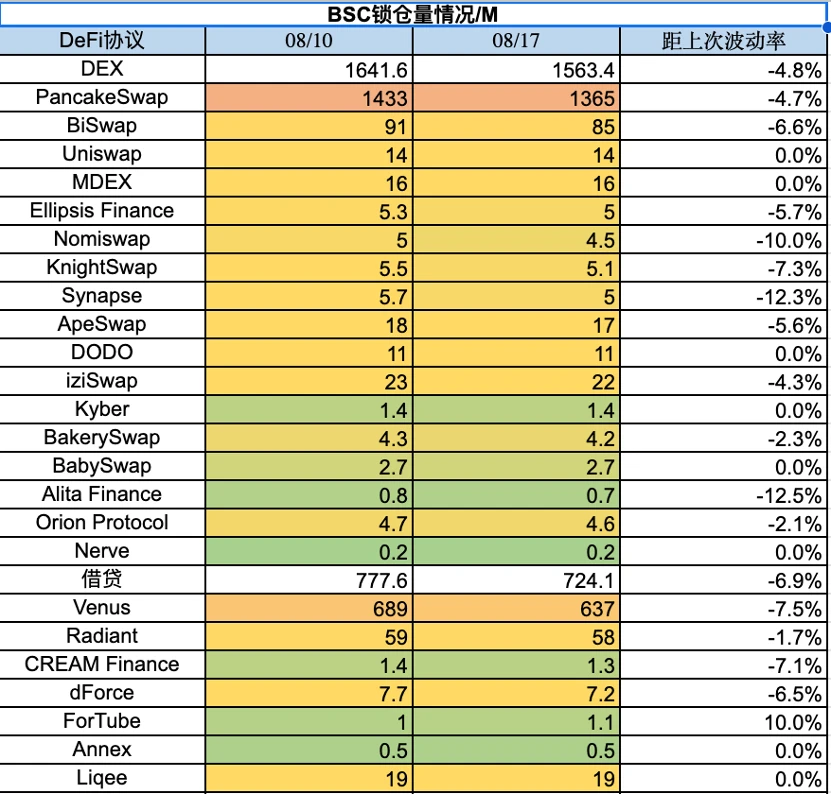
2) BSC lock-up amount
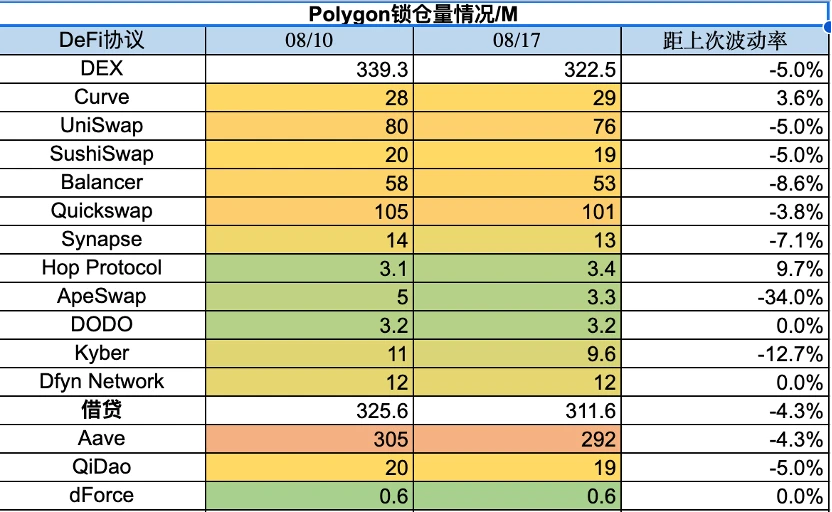
3) Polygon lock-up amount
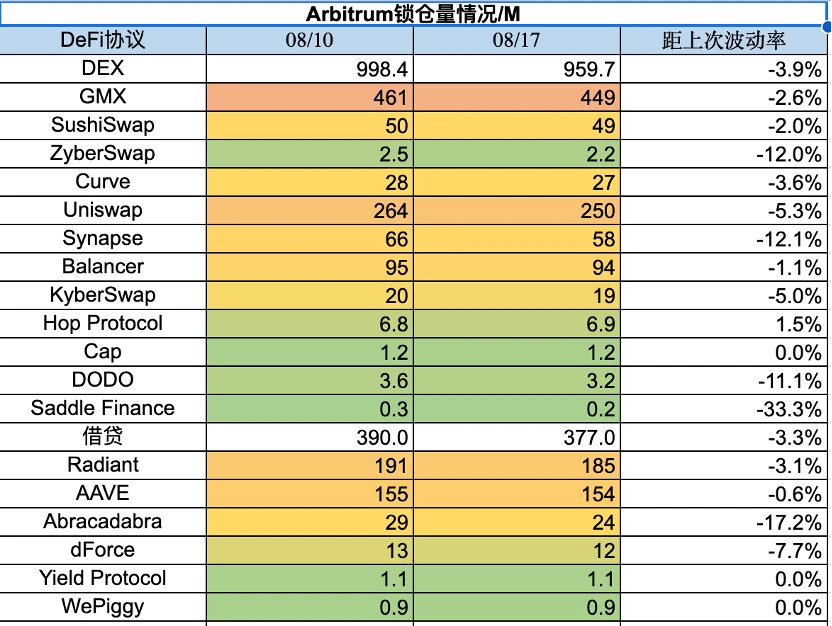
4) Arbitrum lock-up amount
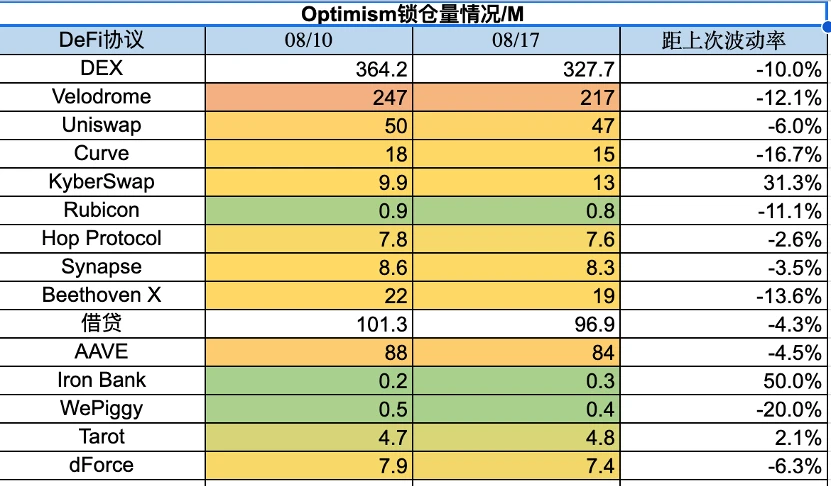
5) Optimism lock-up amount
IV. ETH Gas fee historical data
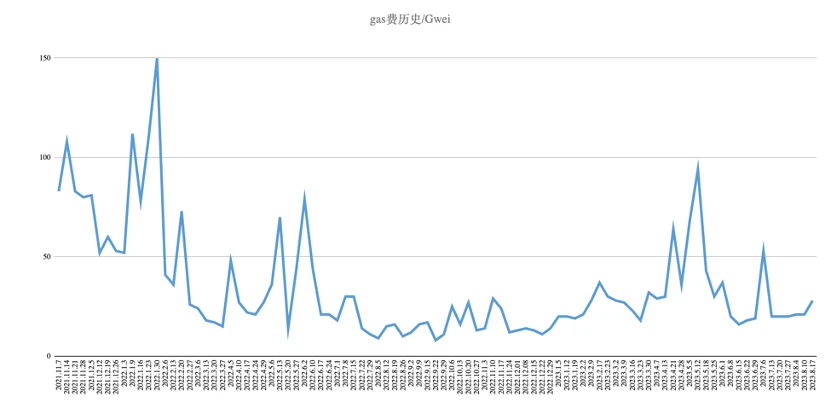
The current on-chain transfer fee is about $1.28, the Uniswap transaction fee is about $11.23, and the Opensea transaction fee is about $4.36. The gas level this week is the same as last week, with almost no change. Gas has had little fluctuation in recent weeks, indicating a lack of market activity. In terms of gas consumption, Uniswap occupies the top position.
V. NFT market data changes
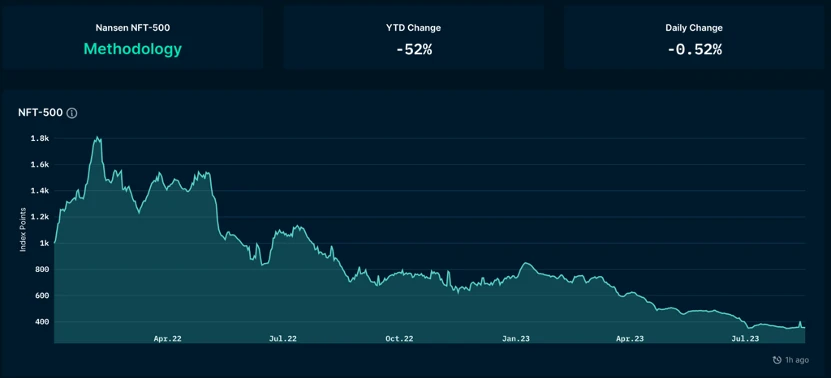
1) NFT-500 index:
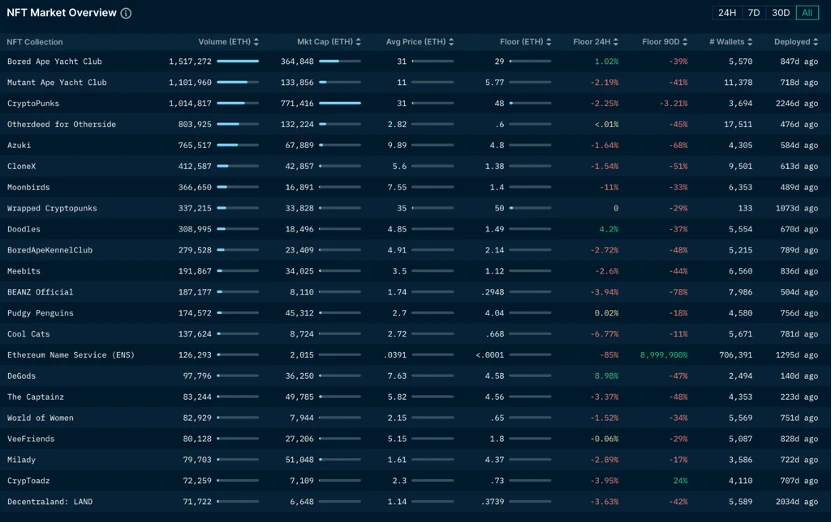
2) NFT market situation:
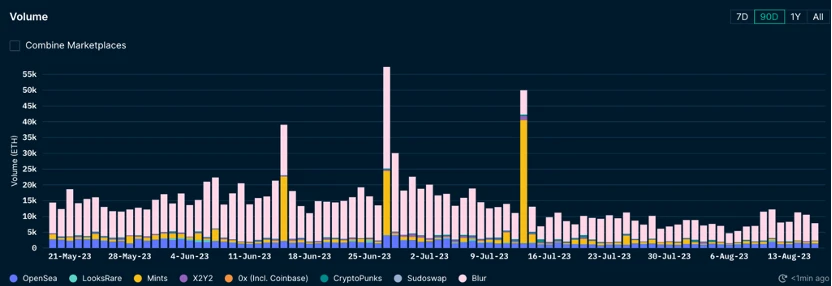
3) NFT transaction market share:
4) NFT buyer analysis:
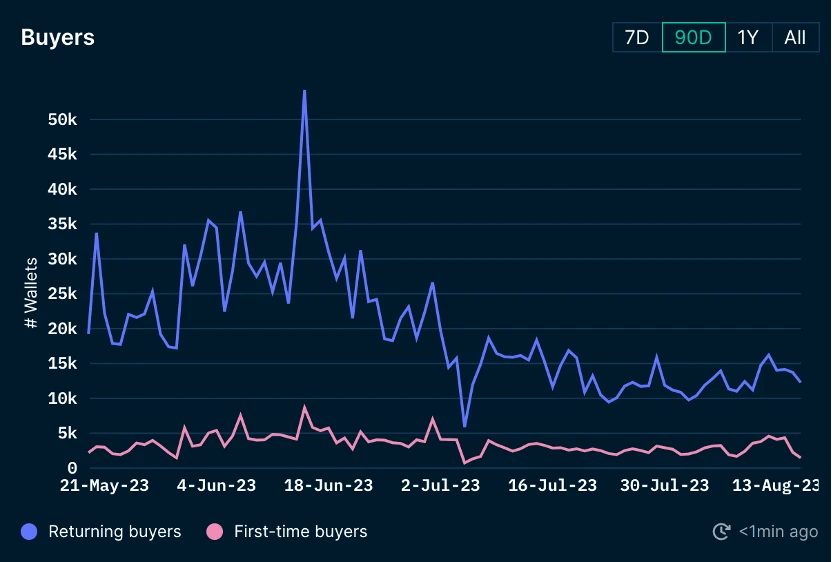
This week, the floor prices of blue-chip projects have mostly been declining, with only BAYC experiencing a slight 1% increase today. From a medium to long-term perspective, the floor prices of blue-chip NFTs have been plummeting dramatically over the past 90 days, with many projects experiencing a decline of over 50%. The overall volume of the NFT market is continuously shrinking. Looking at the active wallet addresses of both new and existing NFT buyers, it can be observed that both groups are decreasing, and the lack of new users entering the market poses a significant challenge.
Like what you're reading? Subscribe to our top stories.
We will continue to update Gambling Chain; if you have any questions or suggestions, please contact us!
