What is driving the growth of the NFT market in 2023? Is it the internal circulation of funds or the support of new capital? We use on-chain data analysis and address clustering algorithms to reveal the answer to this question.
Through on-chain data analysis and address clustering algorithms, we studied the transaction volume and investment proportion of new and old address entities in the entire NFT market in 2023, as well as the sources of transaction and fund increments, to reveal whether the market’s activity and new momentum come mainly from old players or new entrants outside the market.
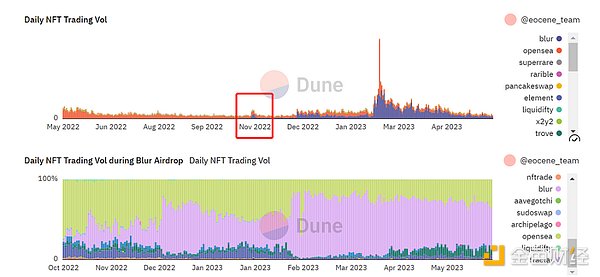
Since the end of June 2022, the NFT market has entered a bear market, but after Blur launched the Airdrop incentive mechanism at the end of 2022, the trading volume of the NFT market has improved (Figure 1). During Blur’s airdrop activity, it can be seen that its contribution to the entire NFT market’s trading volume continues to increase (Figure 1).
- Has NFT project Azuki fallen from grace? Is the plagiarism incident once again mired in a crisis of trust?
- NFT marketplace Magic Eden is about to add support for Bitcoin BRC-20 tokens
- When Russia is in trouble, does WAVES soar? A detailed explanation of the local Russian public chain, WAVES.
Figure 1: NFT daily trading volume
The reward mechanism of Blur’s airdrop and the successful issuance of tokens are undoubtedly the biggest factors behind the surge in NFT trading volume in 2023. However, behind the surge in trading volume, what is the true situation of the entire NFT market; in other words, is there actual incremental on-chain funds in the NFT market, and are there new capital inflows into the market, or is it mainly the internal circulation of old funds?
We 1) explored the sources of incremental transaction volume and funds for the entire NFT market in the second quarter compared to the first quarter; and 2) compared the transaction volume and investment proportion of different address entities in the entire NFT market during the first and second quarter of Blur’s airdrop activity.
Research Process
1. Derive transaction volume data for each address
-
First, we selected time periods A (October 19, 2022 – February 14, 2023) and B (February 15, 2023 – May 31, 2023)¹ as the research time intervals;
-
Secondly, we studied transaction volume and fund volume from the perspective of buyers, because the focus of the study is on “the investment of NFT market participants in NFT”;
-
Furthermore, although there are many participants in the NFT market during the research period, data shows that the Top trading volume addresses that contribute 90% of the total NFT market transaction volume/fund volume only account for 8% of all addresses. Therefore, in order to facilitate analysis, we define the scope of research objects as “the Top trading volume addresses that contribute 90% of the total transaction volume/fund volume in each time period”, which filters out more than 70,000 addresses in total;
-
Finally, we eliminated wash trades² and obtained the real transaction volume and transaction count of each address.
[1] Time period A corresponds to the first quarter airdrop for Blur, and time period B corresponds to the second quarter airdrop for Blur. February 14th, the day of BLUR token issuance, is used as the dividing point because the issuance of BLUR clearly accelerated the activity of the NFT market.
[2] Wash trade exclusion rules: buyer=seller, buyer and seller have a common EOA fund source.
2. Determine the amount of investment based on trading volume and number of transactions
-
Based on the trading volume and number of transactions of each address obtained previously, calculate the amount of money each buyer invested in each token_id of different NFT collections³;
-
Add up all the investment amounts of each buyer to obtain the amount of funds invested in NFT by each address.
[3] When token_standard=erc 721, each token_id corresponds to the same token, so the amount invested for each token_id is the average price paid for buying that token_id (average price = total payment amount / number of purchases); when token_standard=erc 1155, each token_id can correspond to multiple tokens, so we assume that the amount invested for each token_id is the total amount spent on buying that token_id.
3. Divide different entities based on address clustering algorithms
Based on the logic of fund correlation, addresses that are highly likely to be controlled by the same entity are classified into one group, so as to study the sources of trading volume and funds of two time periods from the perspective of entities.
-
We stipulate that clustering is based on the following criteria⁴: 1) there has been a transfer of eth or stablecoin between addresses; 2) two addresses must have transferred to each other, with a number of times: one direction >= 3 transactions, the other direction >= 1 transaction; 3) limited to transactions between addresses in 2023.
-
Use the algorithm to cluster addresses according to the above criteria, and obtain different address groups, and use s 1_ind and s 2_ind to identify whether the address has participated in NFT transactions in time period A and time period B⁵. Among them, if there is at least one address with s 1_ind=1 in the address group, the address group is an old entity; if all the addresses in the address group have s 1_ind=0, the address group is a new entity.
[4] Our algorithm can identify the direct or indirect links between wallets. “Direct” refers to the interaction between two NFT players that meets the standard. When multiple NFT players have interacted with the same address (whether or not the address is within the scope of analysis) and the interaction meets the above standard, indirect links will be formed between these NFT players.
[ 5 ] If s 1 _ind= 1 and s 2 _ind= 1, it means that the address participated in NFT transactions in both time periods; if s 1 _ind= 1 and s 2 _ind= 0, it means that the address only participated in NFT transactions in time period A; if s 1 _ind= 0 and s 2 _ind= 1, it means that the address only participated in NFT transactions in time period B.
Research Results and Analysis
1. Data results ⁶ (buy volume is “transaction volume” and capital is “funds”; Season 1 corresponds to time period A, and Season 2 corresponds to time period B)
1.1) Transaction volume and capital in each time period:
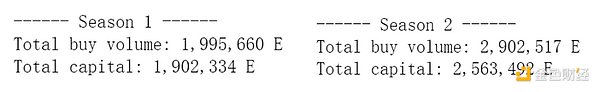
Transaction volume and capital in time periods A and B
1.2) Transaction volume and capital of new and old addresses⁷ in time period B (left is in ETH; right is the percentage):
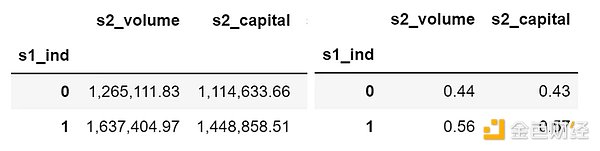
Transaction volume and capital of new and old addresses in time period B
1.3) Transaction volume and capital of new and old entities⁸ in time period B (left is in ETH; right is the percentage):
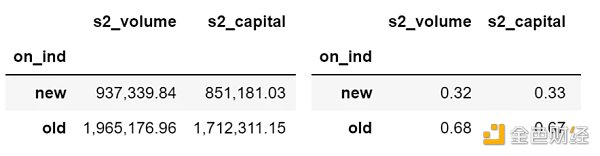
Transaction volume and capital of new and old entities in time period B
[ 6 ] Outputting the data from the address and entity perspectives respectively for “transaction volume and capital in time period B” is to compensate for the possible defects in address clustering (such as incorrectly attributing some new entity addresses to old entities, resulting in an overestimation of the transaction and capital volume of old entities), so as to obtain a benchmark for the data.
[ 7 ] If s 1 _ind= 1, it is an old address, if s 1 _ind= 0, it is a new address.
[ 8 ] If on_ind=old, it is an old entity, if on_ind=new, it is a new entity.
2. Results analysis
2.1) Growth of on-chain NFT funds
Both the total transaction volume and capital in time period B are greater than those in time period A, and the absolute values of the increase in transaction volume and capital are 906,857 E and 661,159 E, respectively. Both the transaction volume and capital are showing an upward trend, indicating that the NFT market is generally growing.
2.2) Sources of new funds
The increase in capital is less than the capital of new entities in time period B (661,159 E vs 851,181 E), so the main source of new capital is new entities, while at least some of the funds invested by old entities in the NFT market are shrinking.
2.3) The proportion of transaction volume and funds between old and new entities
Comprehensive address and entity perspective on trading volume and fund data in period B, the proportion of trading volume and funds of old entities is roughly between 55% and 70%.
-
The proportion of trading volume and funds of old entities in period B is more than 50%, indicating that old entities are the main contributors to the activity of the NFT market;
-
However, we should also note that the difference in proportion between new and old entities is not significant, therefore we believe that the contribution of new entities to the NFT market cannot be ignored.
Conclusion
By studying the proportion of transaction volume and investment funds of new and old entities in the NFT market (old entities account for about 60% of the proportion), as well as the source of transaction and fund increments (mainly from new entities), we believe that old players (old entities) are the main contributors to the activity of the NFT market, while new entrants (new entities) outside the market are the source of new momentum in the NFT market.
It should be noted that the increase in funds and the influx of new players does not necessarily mean that the NFT market is booming. This is because most of the increments are concentrated on Blur, which is most likely attracted by token rewards rather than the value of NFTs themselves. As for how to maintain the long-term prosperity of the NFT market after the airdrop, it is still a major challenge faced by the market.
Like what you're reading? Subscribe to our top stories.
We will continue to update Gambling Chain; if you have any questions or suggestions, please contact us!
