As we all know, Bitcoin is a highly volatile asset. However, the current volatility in the Bitcoin market is being greatly compressed. Is this because Bitcoin has lost its high volatility, or because the market is mispricing it?
Summary
• It is well known that the price of Bitcoin has always been very volatile, but the current range of Bitcoin volatility in the market is being greatly compressed, with less than 5% of trading days in history having a smaller price range than the current one.
• The performance of the futures market is mediocre, with trading volumes for BTC and ETH hitting historical lows, and the futures-spot arbitrage yield is 5.3%, slightly higher than the risk-free interest rate.
- What should investors do if a blockchain project fails to refund the tokens issued?
- Is NFT collateralized mining a legitimate and profitable business?
- Circle CEO Circle is using over $1 billion in cash reserves to counter competition from non-cryptocurrency companies like LianGuaiyLianGuail.
• The implied volatility in the current options market has dropped significantly, reaching historical lows, even less than half of the 2021-2022 baseline.
• The put/call ratio and the 25% Delta skew indicator are both at historical lows, indicating a significant increase in demand for call options in the options market, and the pricing of put options suggests that their future volatility is very small.
Consolidation Signals
The current spot price of BTC is above several widely used long-term moving averages (111D, 200D, 365D, and 200W). These averages range from a low of $23,300 (200DMA) to a high of $28,500 (111DMA). The chart below also shows periods similar to the current situation in the past two cycles, which often correspond to macro upward trends.
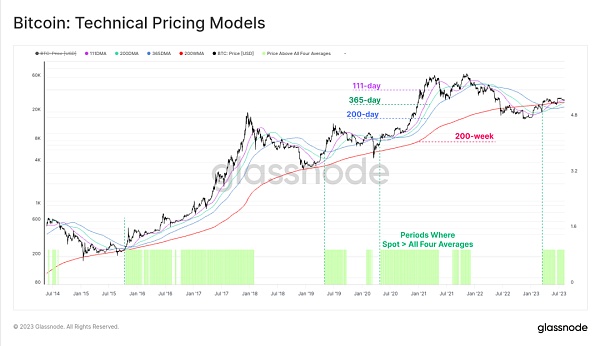
Figure 1: Long-term moving average price model
The realized price model is also the same, and we can build the model based on the base cost of three different groups:
-
Yellow: Overall market (realized price).
-
Red: Short-term holders (holding tokens for no more than 155 days).
-
Blue: Long-term holders (holding tokens for more than 155 days).
The spot price is also higher than the realized price of these three groups, consistent with the situation mentioned above where it is higher than the long-term moving average price.
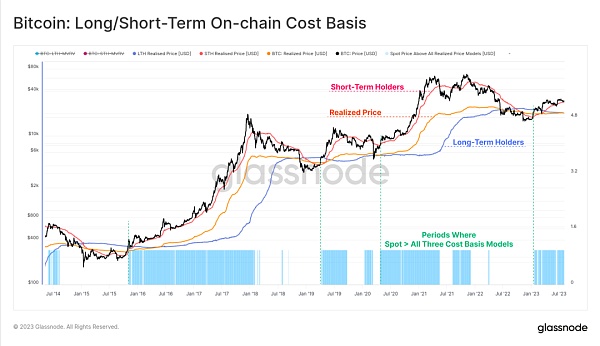
Figure 2: On-chain base cost of long-term/short-term holders
From the peak of the bull market in April 2021 to the present, about 842 days have passed. The market recovery in 2023 is better than the previous two cycles, only 54% lower than the peak of the bull market, while the historical average is 64%.
We also noticed that in the cycles of 2015-2016 and 2019-2020, there was a consolidation period of 6 months before the market accelerated below the 54% retracement level, which may indicate a possible consolidation period in the future.
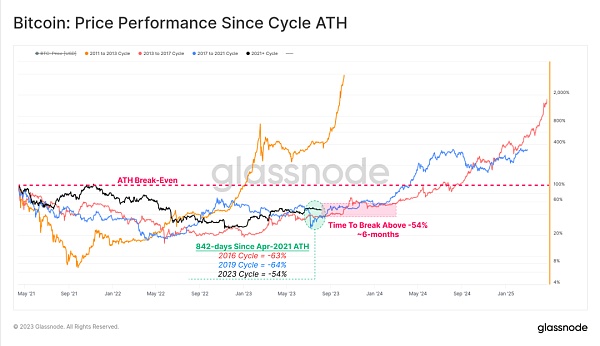
Figure 3: Price performance since the peak of the bull market
After the market hype earlier this year subsided, the quarterly and monthly price performance of Bitcoin has cooled down. This phase has many similarities with previous cycles. In previous cycles, the initial bottom bounce was very strong, but it would be followed by a long period of consolidation.
This period is usually referred to as the accumulation phase by analysts.
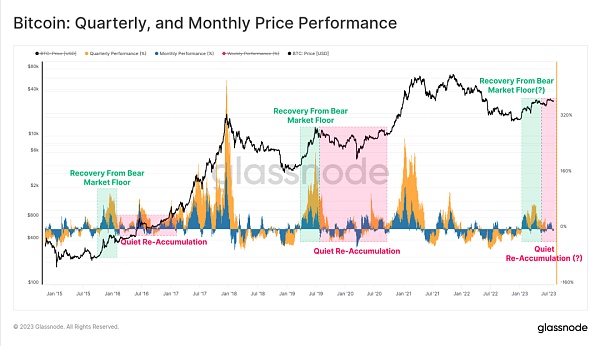
Figure 4: Quarterly and monthly price performance
Significant narrowing of Bitcoin volatility
The actual volatility of Bitcoin in the 1-month, 3-month, 6-month, and 1-year windows has significantly decreased in 2023, reaching multi-year lows, with the 1-year window having the highest volatility. This is also the lowest level of 1-year window volatility since December 2016. This is the fourth such period of extreme volatility compression:
-
At the end of 2015 and the beginning of 2016, the market went through a period of accumulation;
-
At the end of 2018, after a significant sell-off in November, the market entered a bear market. It then saw a recovery bounce in April 2019, with Bitcoin’s price rising from $4,000 to $14,000 within three months;
-
After March 2020, the market entered a period of consolidation;
-
By the end of 2022, the market gradually absorbed the collapse of FTX.
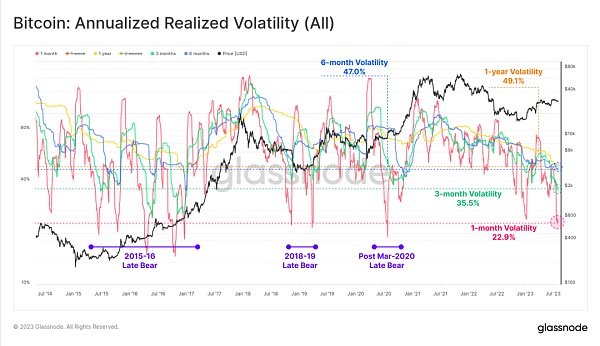
Figure 5: Annual realized volatility
Last week, the high and low points of the price range within 7 days differed by only 3.6%, historically, only 4.8% of trading days were lower than this value.
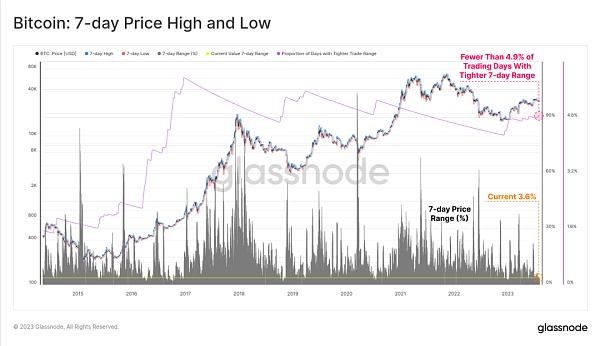
Figure 6: 7-day high and low points
The 30-day price range is also narrow, with the high and low points of Bitcoin’s price last month differing by only 9.8%, and historically, only 2.8% of monthly price ranges were narrower than 9.8%. For Bitcoin, this level of consolidation and low volatility is extremely rare.
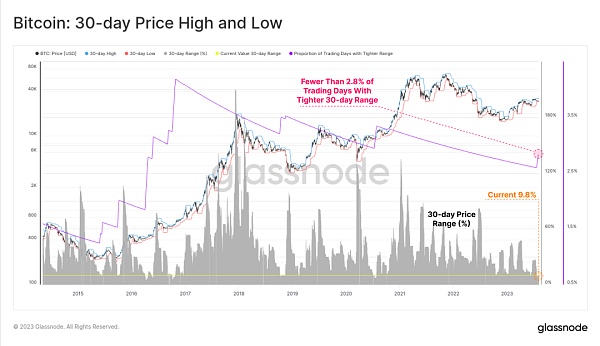
Figure 7: 30-day high and low points
Derivatives market also calm
This quiet state is also evident in the derivatives market for BTC and ETH. The total trading volume of futures and options for Ethereum and Bitcoin is at or near historic lows.
The current total derivatives trading volume for BTC market is $19 billion per day, while the total derivatives trading volume for ETH market is only $9.2 billion per day, reaching a new low since January 2023.
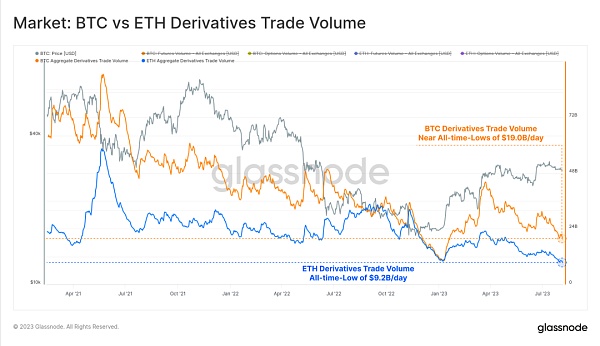
Figure 8: BTC vs ETH derivatives trading volume
Recently, investors have also maintained a relatively risk-averse attitude, with Bitcoin’s share slowly increasing in the futures market.
During the period of 2021-2022, the trading volume and open interest of the Ethereum futures market have steadily increased compared to Bitcoin, reaching a peak of 60 BTC: 40 ETH in the second half of 2022.
However, in 2023, the situation changed and Bitcoin gradually gained the upper hand. Reduced market liquidity and decreased risk appetite have led to an upward shift in the risk curve.
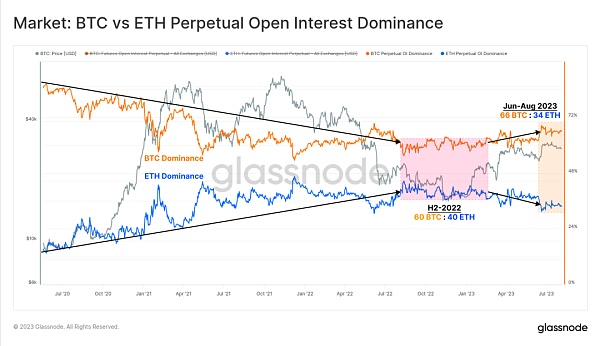
Figure 9: BTC vs ETH perpetual futures contract open interest ratio
Last month, the open interest of Bitcoin and Ethereum in the futures market was relatively flat, at $12.1 billion. Similar to the situation in the second half of 2022 when the price of Bitcoin was about 30% lower than it is now and FTX did not experience a blowout. It is also similar to the situation during the price increase in January 2021 when the price of Bitcoin rose by 30% and the market was still not mature.
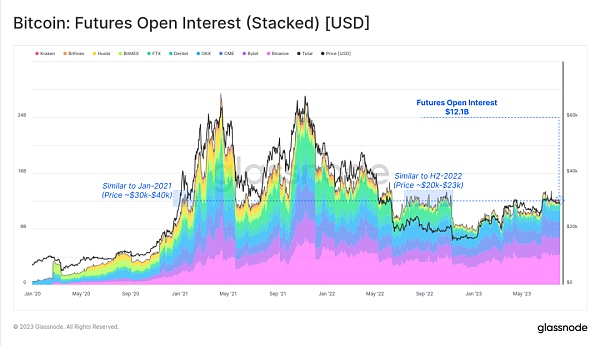
Figure 10: Futures open interest (pledge)
In contrast, the dominance of the options market has significantly increased, with open interest more than doubling in the past 12 months. In terms of the scale of open interest, the options market is currently on par with the futures market.
On the other hand, since the end of 2022 (FTX blowout), futures open interest has been steadily declining, with only a slight increase in 2023.
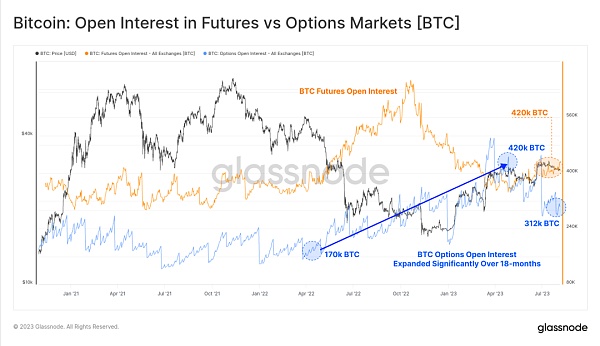
Figure 11: Open interest in the futures market and options market
Strong bullish trend in the futures market
Due to the low trading volume in the futures market and relatively low market activity, investors are focusing on identifying opportunities to revitalize the digital asset derivatives sector.
In the futures market, the term structure (zero-coupon bond yield curve) indicates that an annualized return of 5.8% to 6.6% can be achieved through cash-and-carry arbitrage (taking advantage of price differences between the futures market and the spot market, buying low and selling high). However, this is only slightly higher than the yield of short-term US Treasury bonds or money market funds.
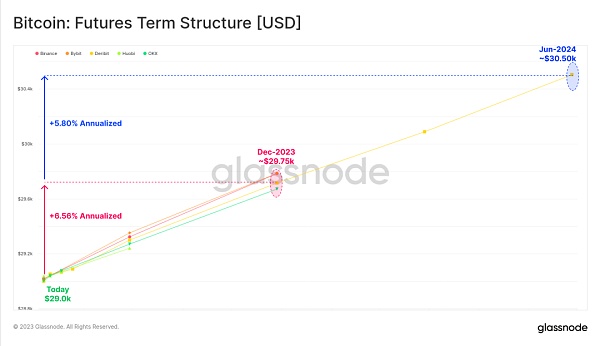
Figure 12: Futures term structure
The perpetual swap market is the most liquid market for cryptocurrency derivatives trading, where traders and market makers can lock in funding rates to arbitrage between futures and spot prices. This type of cash-and-carry arbitrage has higher volatility, with the current annualized return rate at 8.13%, making it highly attractive to investors.
In addition, since January, funding rates have continued to rise, indicating a significant change in market sentiment since the end of 2022.
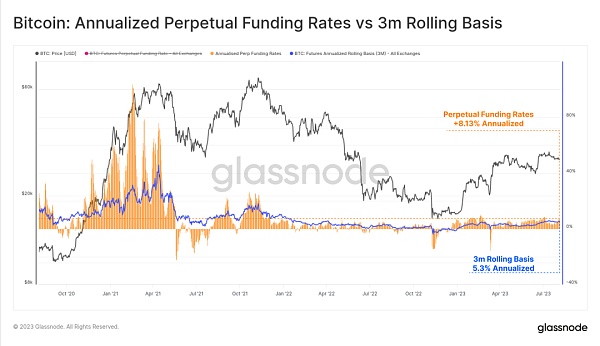
Figure 13: Perpetual fund annual interest rate vs 3-month rolling rate
Continuing to look at the options market, the current market volatility has been compressed to an extremely low level, with implied volatilities for all contract expiration dates falling to historic lows.
The volatility in the Bitcoin market is very high, with implied volatilities for options trading in 2021-2022 fluctuating between 60% and 100%. However, currently, the volatility premium in the options market has reached a historic low, with implied volatilities ranging from 24% to 52%, less than half of the long-term baseline.
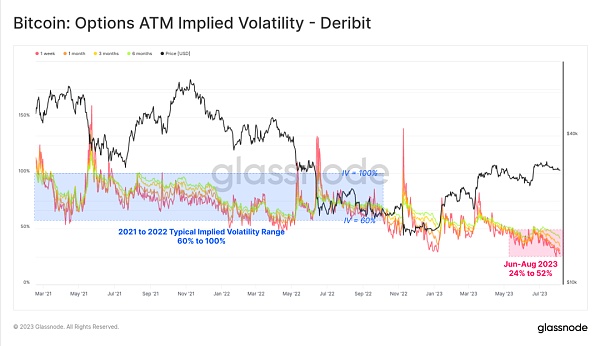
Figure 14: Current implied volatilities for options
From the term structure of implied volatilities below, we can see that in the past two weeks, volatility premiums have rapidly contracted, with the implied volatility for options contracts expiring in December 2023 decreasing from 46% to 39%. The volatility premium for options contracts expiring in June 2024 is slightly above 50%, at a historic low.
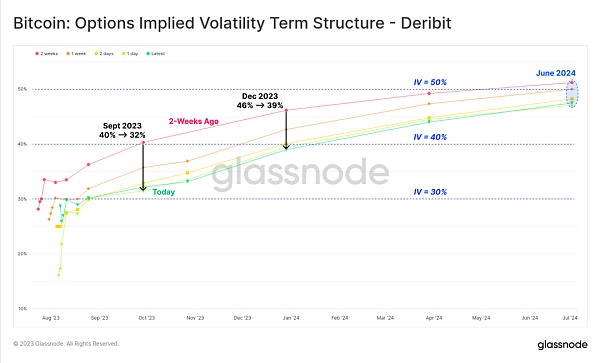
Figure 15: Term structure of implied volatilities for options
The trading volume and open interest ratio of put/call options are both at or near historic lows, at 0.42 and 0.48 respectively. This indicates that the market is mainly bullish, and the demand for call options still dominates.
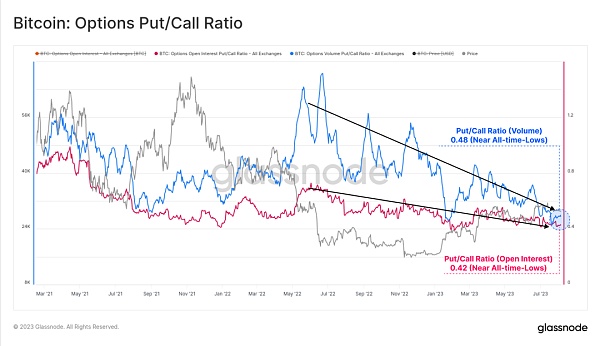
Figure 16: Put/call options ratio
Therefore, compared to call options, put options are becoming cheaper. The 25% Delta Skew (which is calculated as the difference between the implied volatilities of 25% Delta put options and 25% Delta call options) has reached a historic low. Overall, this indicates that the options market is currently comparable in size to the futures market, with implied volatilities at historic lows.
However, since historically, less than 5% of trading days have seen Bitcoin’s price range being as wide as it is currently, is this a sign that Bitcoin has shed its inherent high volatility, or is it a result of Bitcoin being mispriced?
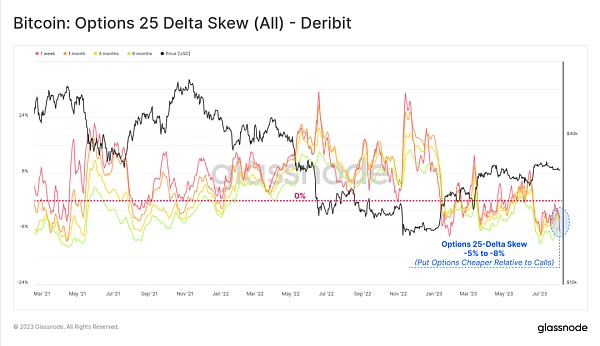
Figure 17: 25% Delta Skew indicator for options
Summary
We rarely hear people say that Bitcoin is a price stable asset, as it is widely regarded as a highly volatile asset. Therefore, the phenomenon of Bitcoin’s price fluctuating by no more than 10% per month is particularly surprising. It can be said that this is the period of lowest volatility in Bitcoin’s history.
The arbitrage yield between futures and spot prices ranges from 5.3% to 8.1%, slightly higher than the risk-free rate of short-term US Treasury bonds. The volatility premium in the options market is at its historic lowest level, and the demand for put options is very weak.
Like what you're reading? Subscribe to our top stories.
We will continue to update Gambling Chain; if you have any questions or suggestions, please contact us!
