Recently, the market capitalization of USDT has continued to rise, once again breaking through $83 billion, which is very close to the historical high set in early May 2022. Generally speaking, the market value of the largest stablecoin USDT is seen as a “catalyst” for a bull market. However, during this period of USDT market capitalization growth, the market situation did not rise in sync, and mainstream assets such as BTC were still in a sideways adjustment phase.
So where did the newly issued USDT flow? How much flowed into the trading market? After analyzing the market value changes, on-chain data, and trading data of USDT, BlockingData found that:
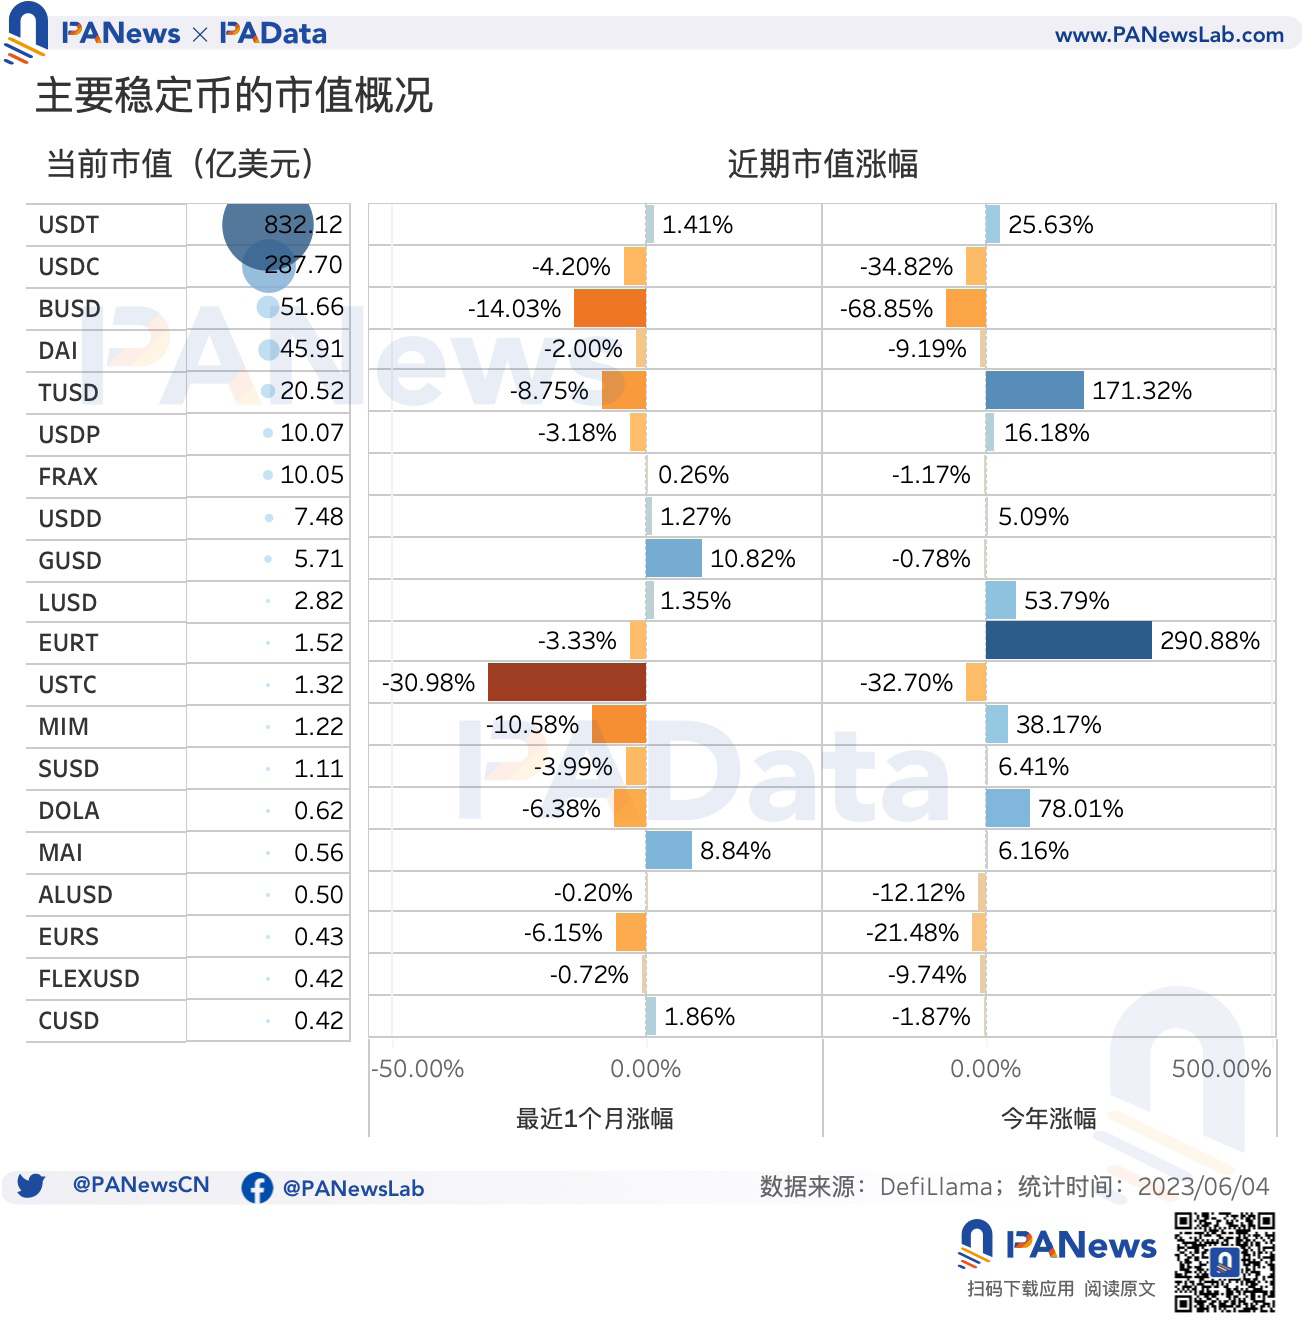
- As of June 3, the total market value of stablecoins is about $129.216 billion, with a recent one-month decline of about 0.87%, and a decline of about 6.22% since the beginning of the year.
- The current largest market value is USDT, which is about $83.212 billion, accounting for 64.4% of the total market value, nearly three times that of USDC. Its market value has risen by 1.41% in the past month and by 25.63% since the beginning of the year, approaching its historical high.
- This year, the market value of TRC-20 USDT has grown by 34.90%, and the market value of ERC-20 USDT has grown by 19.23%. However, the growth trend of TRC-20 USDT is more significant, with a larger increment and faster growth rate. Currently, its market value accounts for 54.07% of the USDT market value.
- Although the market value of USDT has returned to the high point in early May 2022, there is a change in the internal composition pattern of USDT, and TRC-20 USDT is increasingly dominant. This compositional change will play an important role in understanding the market reaction caused by changes in USDT market value, because there are some differences in the application scenarios of TRC-20 USDT and ERC-20 USDT.
- This year, the daily on-chain trading volume of TRC-20 USDT has shown a significant upward trend, with a year-to-date increase of about 71.76%, while the daily on-chain trading volume of ERC-20 USDT has shown a slight downward trend, with a decline of about 0.25%. The average daily on-chain trading volume of the two types of USDT is about 6.917 billion USDT.
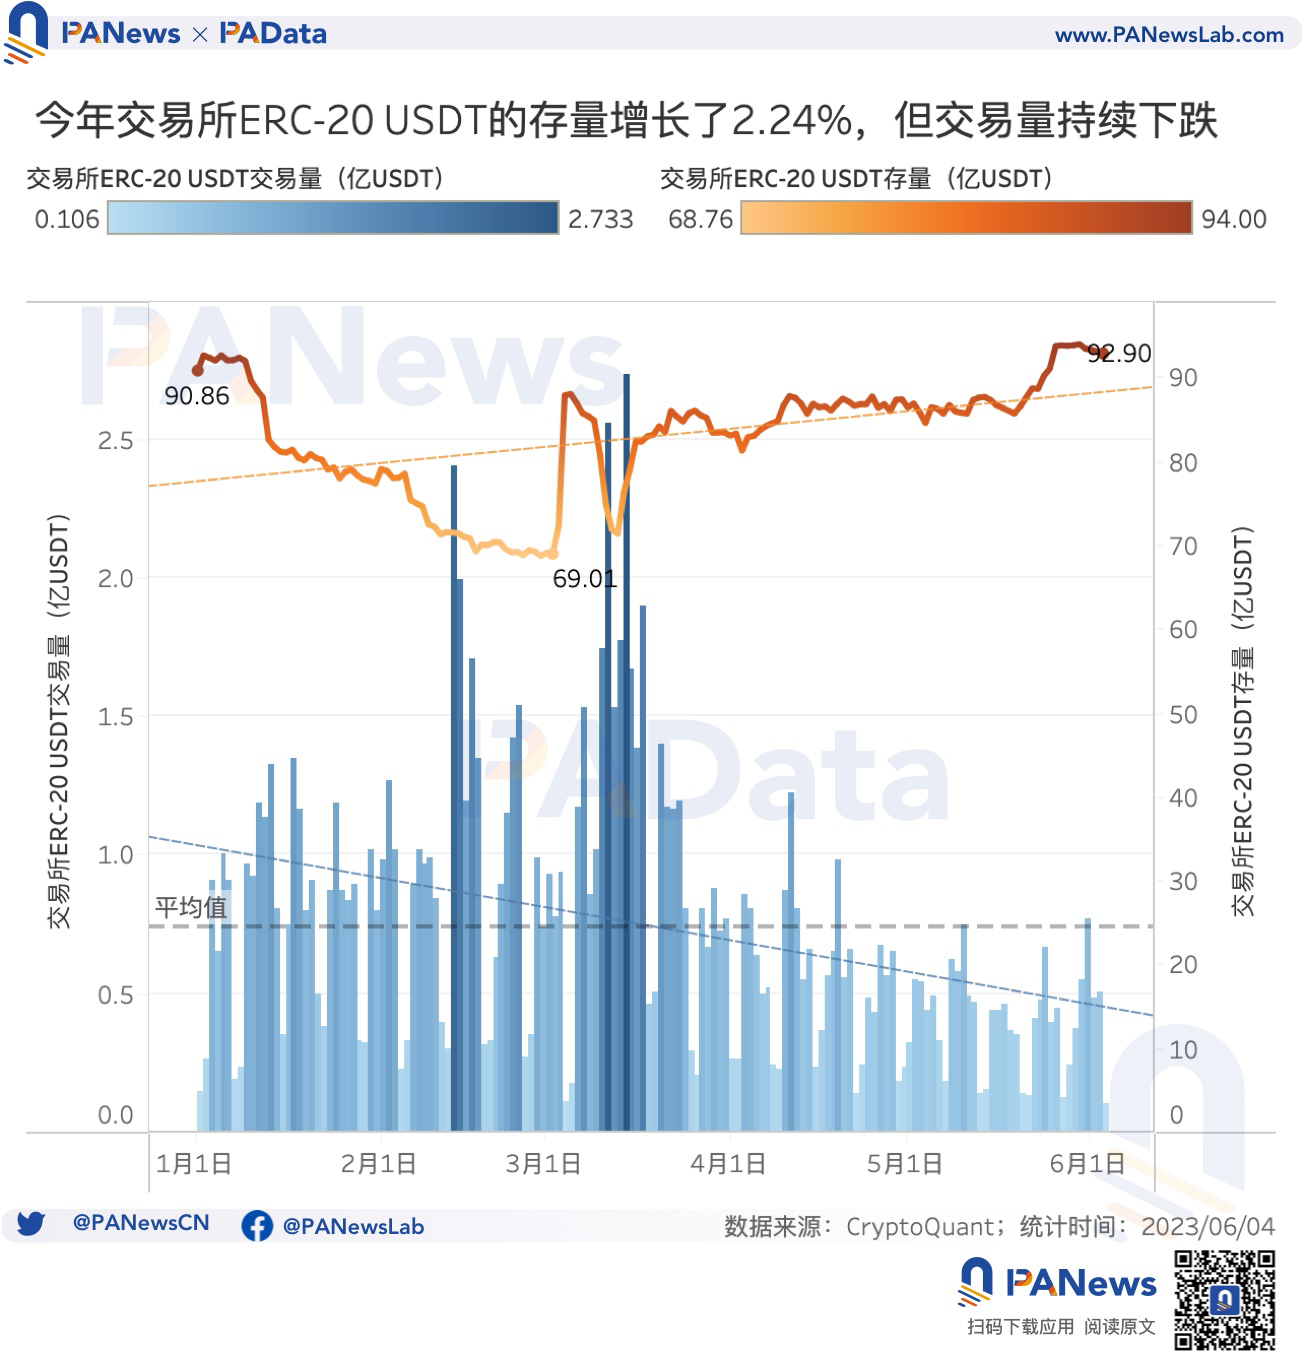
- Currently, the stock of ERC-20 USDT on exchanges is about 9.29 billion USDT, the highest of the year. However, its daily trading volume has shown a significant shrinkage trend this year. The average daily trading volume this month is only 36.7 million USDT, a month-on-month decrease of 11.35% from May.
- The proportion of ERC-20 USDT locked in smart contracts currently accounts for about 15.03% of its circulation, which is equivalent to the level at the end of July 2022, and is lower than the proportion at a similar market value in early May 2022 (at that time, the proportion was about 20%). That is to say, for the same market value, the scale of USDT in DeFi may not be as large as before.
- The current number of independent active addresses on the ERC-20 USDT chain is about 56,800, lower than the average daily number of independent active addresses this year, which is 87,000, and is generally trending downward, which means that the active user base of USDT may have decreased.
USDT’s Total Market Capitalization Breaks $83.2 Billion, TRC-20 USDT Market Capitalization Up by About 35% This Year
As of June 3, the total market capitalization of stablecoins was about $129.216 billion. In terms of composition, the current largest market capitalization is USDT, accounting for about 64.40% of the total market capitalization, at about $83.212 billion. USDC has not shown any significant improvement after the liquidity crisis in March, and its current market capitalization is about $28.77 billion, about 1/3 of the market capitalization of USDT. In addition, although the market capitalization of BUSD, DAI, TUSD, USDP, and FRAX is all over $1 billion, there is still a difference in magnitude compared to the market capitalization of USDT and USDC. It can be said that USDT is still the absolute “leader” in stablecoins.
In terms of trends, the total market capitalization of stablecoins has decreased slightly by 0.87% compared to a month ago, and has decreased by 6.22% since the beginning of the year, indicating a downward trend overall. Moreover, most stablecoins, such as USDC, BUSD, and DAI, have experienced varying degrees of decline in market capitalization in the past month and since the beginning of the year, following the overall trend.
- Who is Richard Teng, responsible for all markets outside of Binance US, and speculated to be the successor of Zhao Changpeng?
- NFT market cools down: interpreting the reasons behind it and changes in blue-chip NFTs.
- What are the narratives worth paying attention to in the second half of the year?
Among the stablecoins with a relatively large market capitalization, USDT, USDD, LUSD, and MAI are the four that have continued to rise against the trend. Among them, USDT has the largest market capitalization and the most significant increase. According to statistics, the market capitalization of USDT has increased by 1.41% from 820.52 billion USD a month ago to 831.211 billion USD, and has increased by 25.63% from 662.37 billion USD at the beginning of the year.
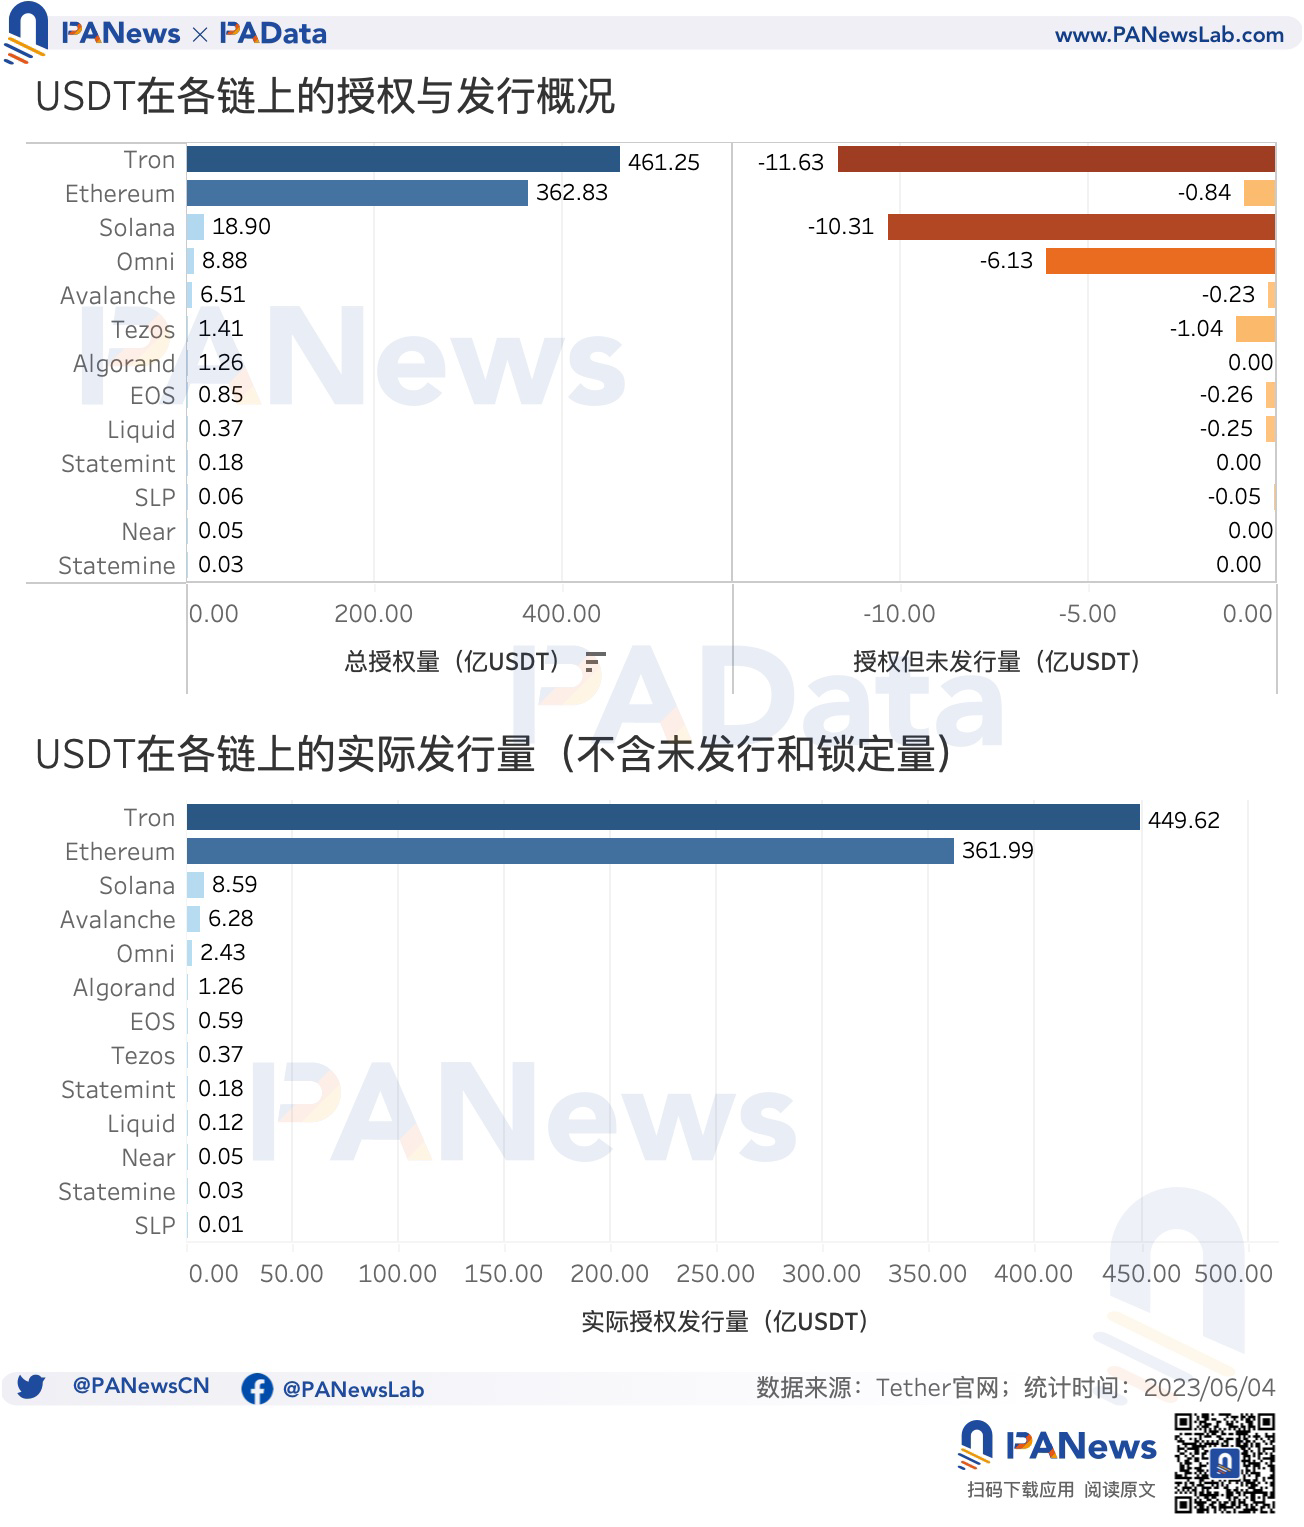
From the multi-chain composition of USDT, according to data displayed on the Tether official website [1], currently TRC-20 USDT (based on Tron) and ERC-20 USDT (based on Ethereum) have the highest total authorized amount, at about 46.12 billion USDT and 36.28 billion USDT, respectively, far exceeding the total authorized amount issued based on other public chains. Considering the authorized but unissued amount, the actual issuance of TRC-20 USDT and ERC-20 USDT is 44.962 billion USDT and 36.199 billion USDT, respectively, accounting for 97.61% of the total actual issuance of USDT.
TRC-20 USDT and ERC-20 USDT almost constitute the entire market capitalization of USDT. From the market capitalization changes of these two types of USDT, it can be seen that since the beginning of this year, the market capitalization of TRC-20 USDT and ERC-20 USDT have been continuously rising, of which the market capitalization of TRC-20 USDT has risen from 31.717 billion USDT to 42.79 billion USDT, an increase of about 34.90%, and the market capitalization of ERC-20 USDT has risen from 27.996 billion USDT to 33.38 billion USDT, an increase of about 19.23%. In fact, since October 2022, the market capitalization changes of these two types of USDT have begun to diverge, with the growth trend of TRC-20 USDT being more significant, with larger increments and faster growth rates.
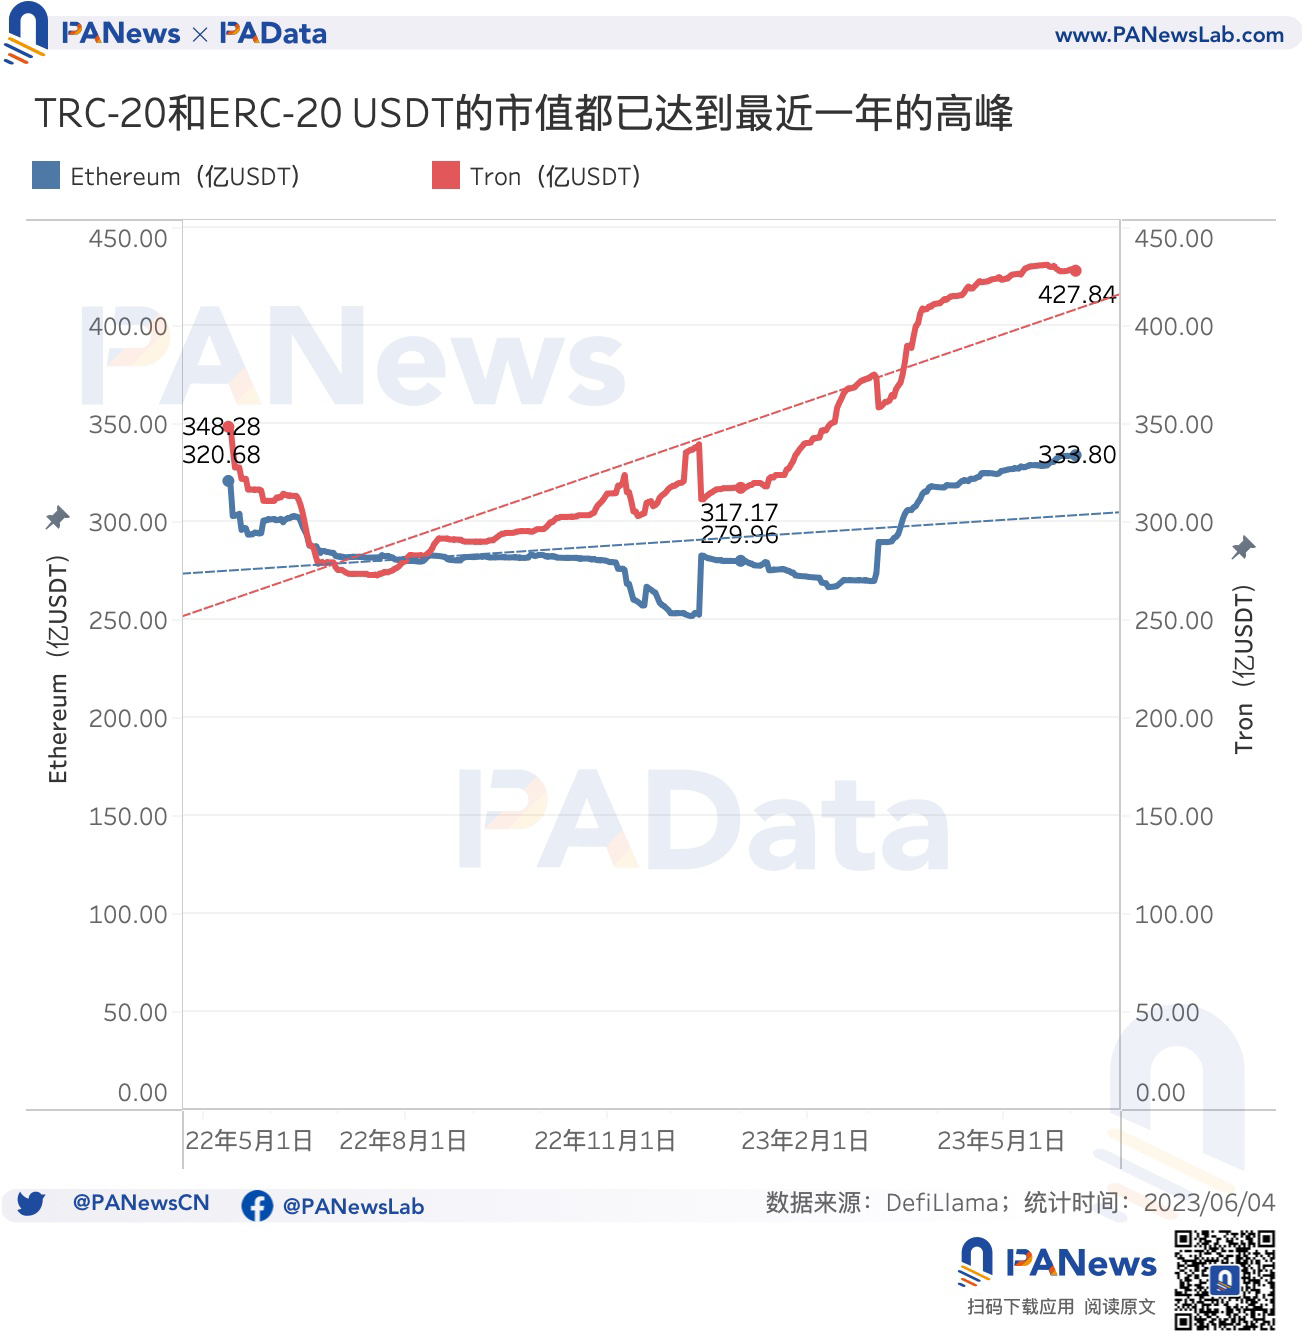
Recently, the market capitalization of USDT has returned to the high point in early May 2022. However, behind this lies a change in the internal composition of USDT, with TRC-20 USDT becoming increasingly dominant. This change in composition will play an important role in understanding the market reaction to changes in the market capitalization of USDT, as there are differences in the use cases for TRC-20 and ERC-20 USDT.
The average daily on-chain transaction volume exceeds 6.9 billion USDT, exchange inventory is rising, but trading volume is falling
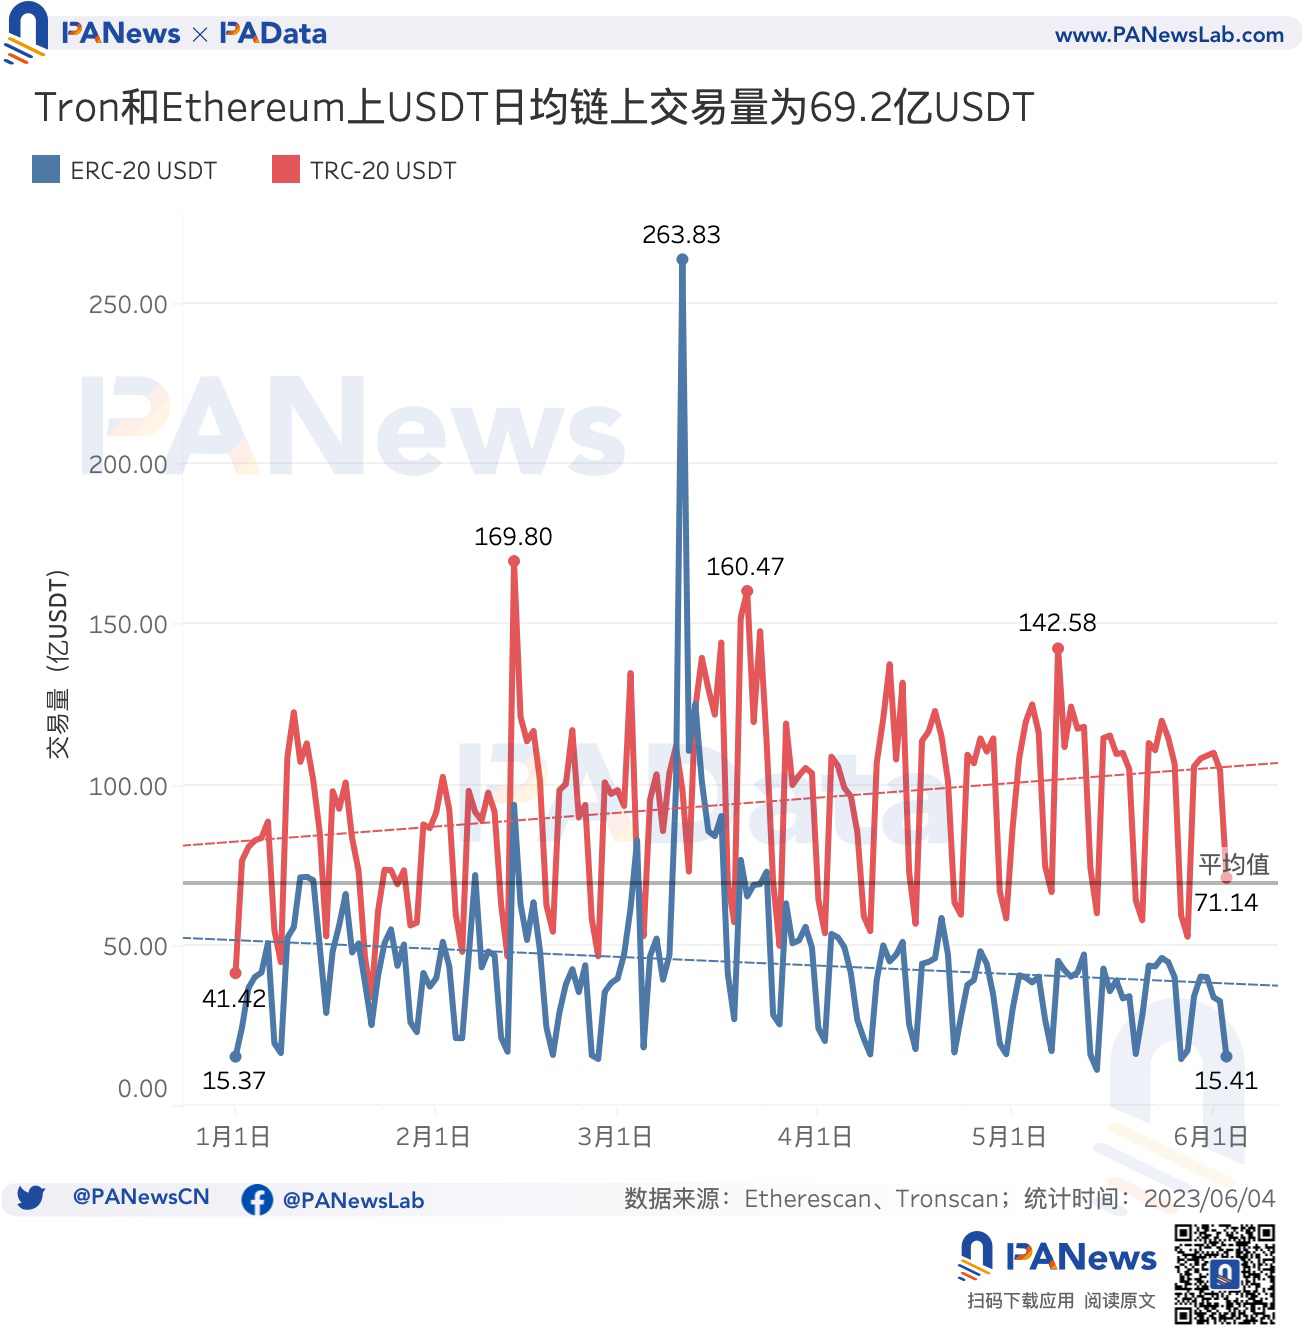
Where has the recently issued USDT flowed to? From the perspective of underlying usage, the average daily on-chain transaction volume of TRC-20 USDT has shown a clear upward trend since the beginning of this year, from 414,200 USDT at the beginning of the year to 711,400 USDT currently, an increase of about 71.76%, with a daily trading volume of about 9.37 billion USDT.
On the other hand, the daily on-chain transaction volume of ERC-20 USDT has shown a slight downward trend since the beginning of this year, from 1.537 billion USDT at the beginning of the year to 1.541 billion USDT currently, a decrease of about 0.25%, with a daily trading volume of about 4.464 billion USDT. Overall, the average daily on-chain transaction volume of these two types of USDT is about 6.917 billion USDT.
Looking at the sub-markets, has the increase in on-chain transaction volume occurred in centralized exchanges, DeFi protocols, or other payment scenarios?
Data shows that the inventory of ERC-20 USDT on exchanges has shown a clear upward trend since the beginning of this year, currently at about 9.29 billion USDT, the highest of the year, an increase of 34.62% from the lowest point of the year, 6.901 billion USDT.
However, interestingly, while the inventory of ERC-20 USDT on exchanges has increased, the daily trading volume has shown a clear declining trend. The average daily trading volume of ERC-20 USDT this year is 74.2 million USDT, and since April, the daily trading volume of each month has been lower than the annual average. The average daily trading volume of ERC-20 USDT this month is only 36.7 million USDT, a month-on-month decrease of 11.35% compared to May, and a month-on-month decrease of 22.47% in May, and a whopping 51.05% decrease in April due to the stablecoin liquidity crisis in March.
It appears that despite there being more USDT on exchanges, this has not led to increased trading in centralized markets. This may be one reason why the increase in USDT market capitalization has not been reflected in the price of the coin. Looking at the amount of USDT locked in DeFi protocols, the situation is unclear. According to Glassnode, the current amount of ERC-20 USDT locked in smart contracts accounts for approximately 15.03% of its circulating supply, which is similar to the level observed at the end of July 2022 and lower than the percentage observed in early May 2022 when the market capitalization was similar (approximately 20%). This means that the amount of USDT in DeFi is likely less than before for the same market capitalization.
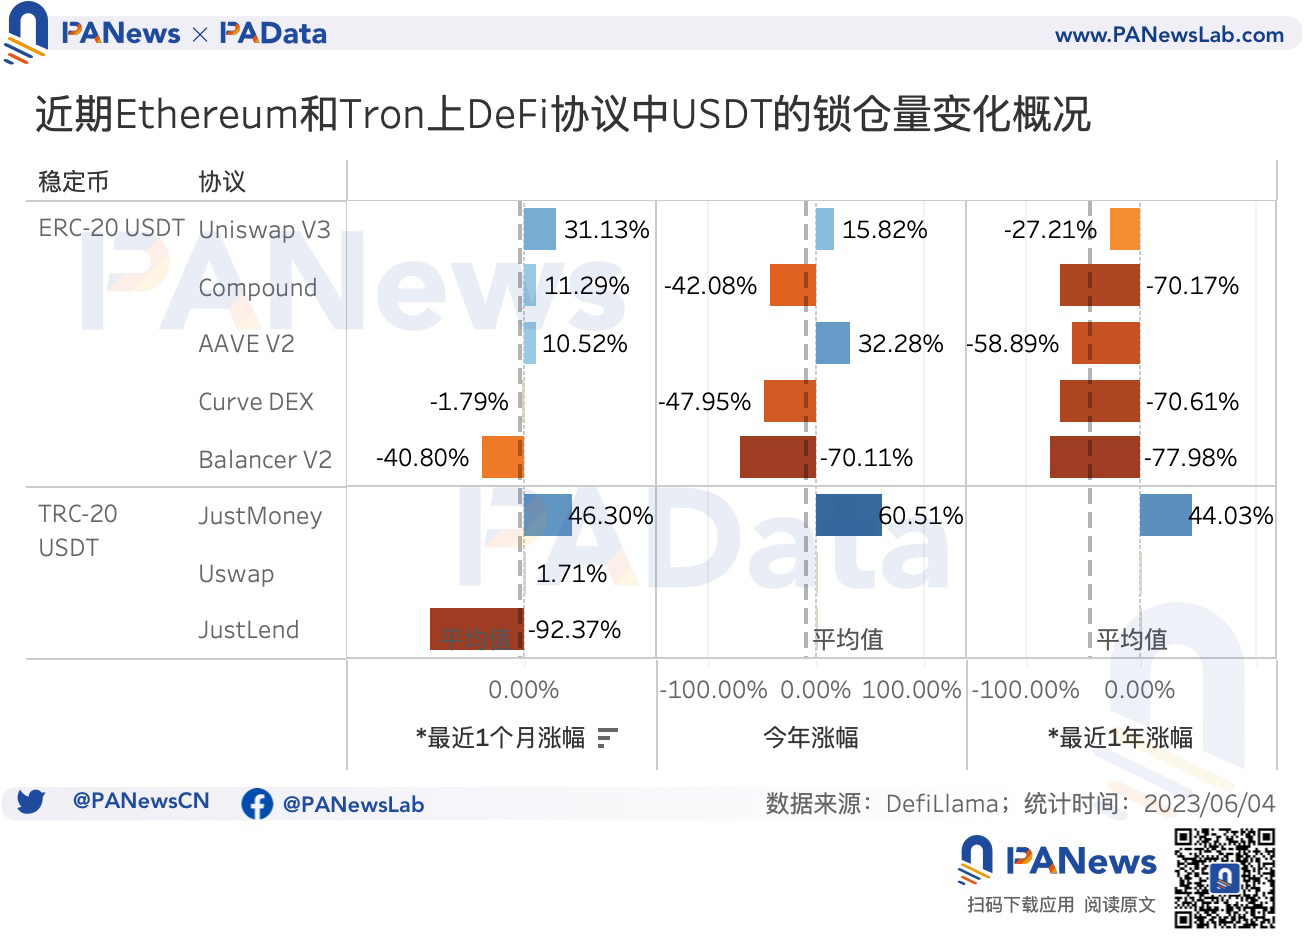
Looking at the recent changes in the amount of USDT locked in specific protocols, on Ethereum, the amount of USDT locked in Uniswap V3, Compound, and AAVE V2 has increased in the past month, with Uniswap V3 showing the most significant growth of 31.13%. However, compared to the beginning of this year, the amount of USDT locked in Uniswap V3 has only increased by 15.82%. If compared to last year, the amount of USDT locked in Uniswap V3 is still significantly lower. On Tron, the JustMoney protocol has shown the most significant growth, with the amount of USDT locked increasing by 46.30% in the past month and by 60.51% since the beginning of the year. The difference in changes in the amount of USDT locked in different protocols is significant.
Looking at data from multiple dimensions, it appears that some of the recently increased USDT has flowed into centralized exchanges, but this has not led to increased real trading; instead, trading volume has continued to decline. Some of the USDT has flowed into DeFi protocols, but it has mainly gone to a few head protocols, and the overall scale is still lower than when the market capitalization was similar before. Another guess is that the newly issued TRC-20 USDT may have flowed into other payment scenarios.
BTC price is stable and rising, volatility is decreasing, and the number of independent active addresses on the USDT chain is declining more significantly.
The overall market environment may also be one reason why the increase in USDT market capitalization has not been reflected in the coin price. Many mainstream assets, represented by BTC, are currently in a horizontal adjustment phase. Market data shows that although the BTC price has been on an upward trend this year, this trend is approaching a “stair” shape, and the platform construction period is relatively long, with a decrease in the daily average volatility of the coin price. In this situation, funds may choose to continue to wait and see. This is reflected in the data by the increase in exchange inventory but the decrease in trading volume.
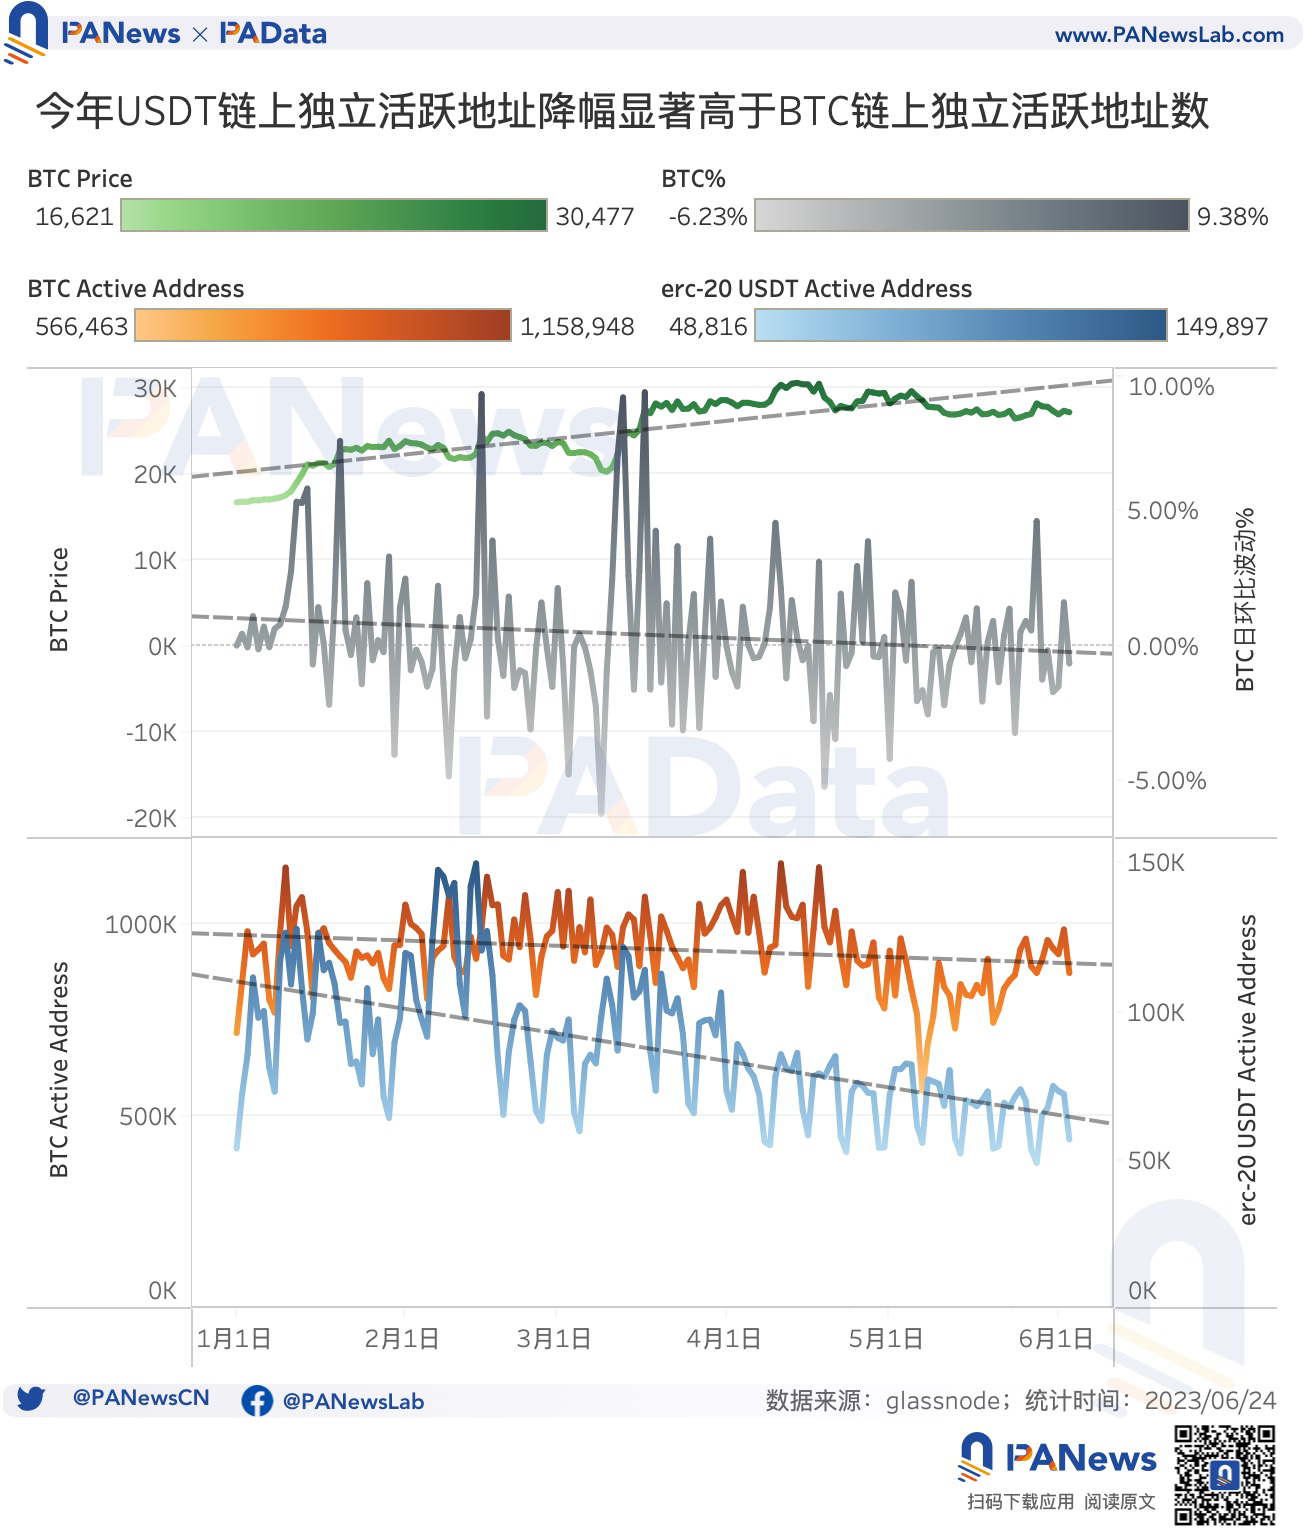
On the other hand, during the market consolidation phase, user activity has also decreased. The number of on-chain independent active addresses has always been a good window to observe the user scale. Judging from the trend of the number of on-chain independent active addresses on the BTC chain this year, it has remained basically stable, with a significant rebound after May, but has not reached a new high for the year. Overall, the active user scale of BTC has not grown significantly.
In contrast, the number of on-chain independent active addresses for ERC-20 USDT this year has shown a clear downward trend, currently about 56,800, a significant decrease from the highest single-day independent active address count of 149,900 this year, and also far from the average daily independent active address count of 87,000 this year. This means that the active user scale of USDT may have decreased.
Data explanation:
[1] There is a certain deviation in the statistical caliber between multiple data sources such as DefiLlama, The Block, and Tether, but there is no difference in scale between these data, which does not affect the observation of market trend changes.
Like what you're reading? Subscribe to our top stories.
We will continue to update Gambling Chain; if you have any questions or suggestions, please contact us!
