Research Institution: Mint Ventures
Researcher: Alex
1. Report Highlights
1.1 Core Investment Logic
Trader Joe’s core advantage lies in its resilient, highly deliverable, and innovative core team, good product experience, and innovative liquidity order book, which has driven rapid user growth, with Arbitrum currently being its main growth engine.
Although the intense competition in the DEXs arena continues, this means that no project within the arena has strong bargaining power over traders and liquidity providers, with most projects operating at a loss or low profit, and such a market competition situation is unlikely to improve in the short term. However, due to the dual cyclical nature of the crypto market and DEXs arena, projects represented by Trader Joe are still expected to perform better than the broader market in a bull market.
- ABCDE Investment Partner: Discussion on the Current Bitcoin Technology Stack Debate and Trends
- BTC’s complex technology stack: history, current state, and future
- SlowMist: Ed25519 Implementation Principles and Scalability Issues
1.2 Key Risks
The main risk comes from intense competition, with the main market, Avalanche, facing ecological shrinkage and competition from Uniswap V3, and Arbitrum, as the main growth market, still in the low-price and subsidy-for-volume stage, with the growth of trading volume and transaction fees still unstable and more dependent on the business brought by event-based projects.
1.3 Valuation
Currently, Trader Joe enjoys higher valuation levels than comparable projects on multiple multiples indicators such as PF, PS, and PE, as detailed in section 4.2 on valuation levels.
2. Project Overview
2.1 Business Scope of the Project
Trader Joe is a comprehensive DeFi project, with its businesses including spot DEX, decentralized lending (Banker Joe), NFT trading platform (Joepeg), and launchBlockingd (Rocket Joe). Trader Joe’s current trading business spans Avalanche, Arbitrum, and BNBchain. Among them, spot trading is currently Trader Joe’s core business and its relatively leading business sector.
2.1.1 Spot DEX
Trader Joe’s spot DEX business, as its current main business, has undergone many product mechanism innovations, particularly in its V2 product, the Liquidity Orderbook (LB).
The liquidity order book is actually a further innovation of Uniswap V3’s centralized liquidity concept.
Essentially, it is a combination of two mechanisms: “order book” and “liquidity pool”.
a. Order Book: Collection of Bins
LB introduces price interval unit “Bin” based on centralized liquidity, where a Bin represents an interval filled with liquidity.
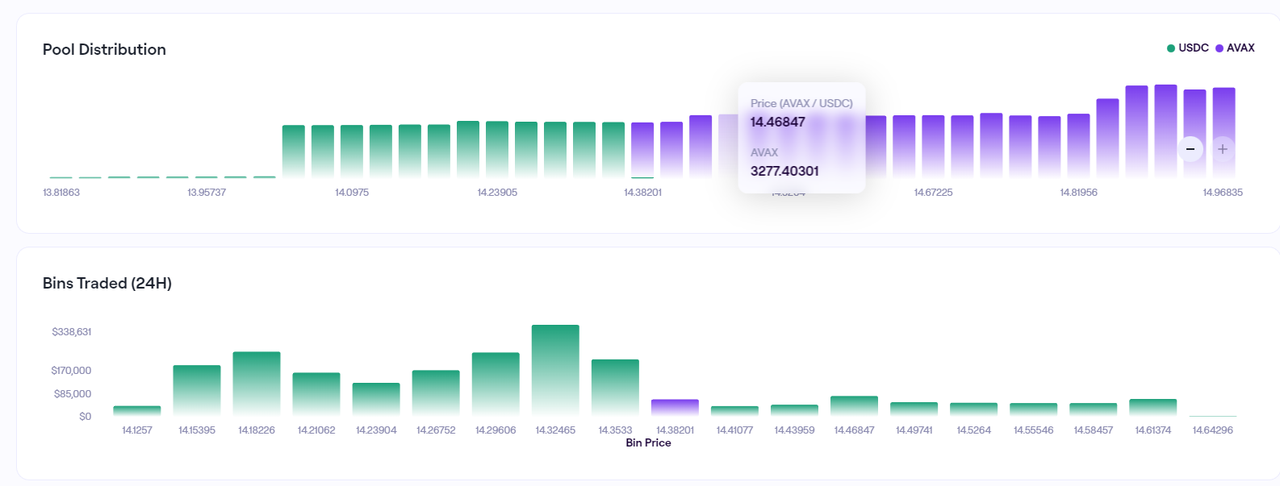
Bin distribution and Bin volume of AVAX-USDC trading pair on Trader Joe
The width of each Bin in the liquidity pool is fixed and equal, and the difference between adjacent Bins is called “Bin step”. For example, the Bin step for the AVAX-USDC trading pair in the above figure is 20BP = 0.02%. The Bin step of each trading pair pool is a parameter that can be set by the creator, so different Bin step pools can be created for the same trading pair.
The Bin of Trader Joe is similar to the order price of CEX based on the order book matching mode, and the Bin step is the minimum unit between the order prices of CEX.
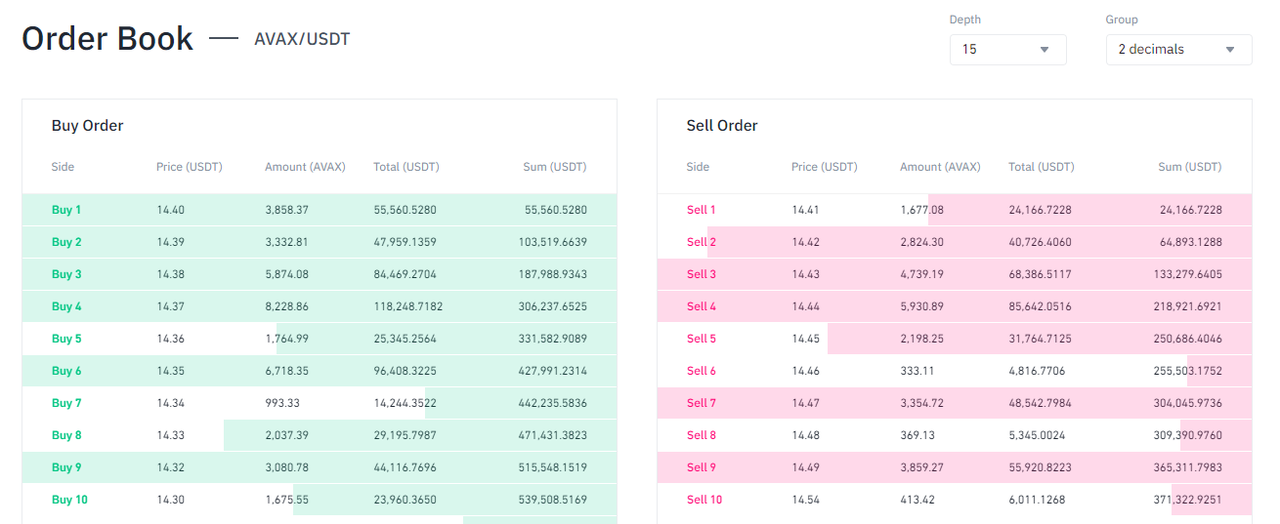
Order book of Avax-USDT trading pair on Binance
Therefore, Trader Joe’s Dex is a customized order book with Bin width as the order transaction unit.
b. Liquidity: Bin Capacity
The mechanism of Uniswap V3 is to concentrate liquidity in a price range in the form of X*Y=K (constant product), while Trader Joe distributes liquidity to Bins with equal-width price intervals, and the liquidity in each Bin conforms to the equation P·X+Y=K (constant sum) (where P=Y/X), and each Bin is a liquidity pool, becoming the smallest unit of liquidity management.
Although it adopts the concept of centralized liquidity, the core innovation of the Bin-based order book mode in LB is that the liquidity is vertically aggregated in each Bin, while the liquidity of V3 is horizontally distributed and vertically stacked heterogeneously.
In simpler terms, the LP of Uni v3 is an independent entity, directly stacked together based on the spanning price range and liquidity amount; while the LB splits the liquidity into different price ranges vertically according to the price span of the liquidity, and stacks them vertically. The liquidity in the same Bin interval is homogeneous.
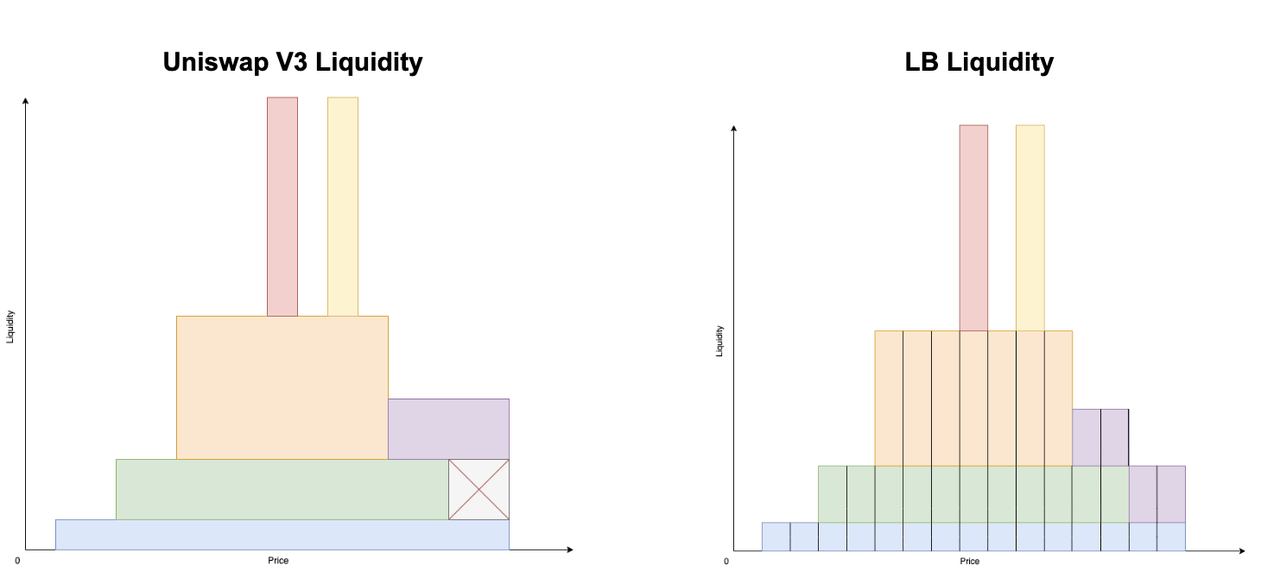
Comparison of Uni V3 and LB liquidity structure. The vertical axis represents liquidity, and the horizontal axis represents price. Different color blocks represent different users. Source: Trader Joe V2.1 document.
Based on Bin’s vertical aggregation of liquidity, LB’s liquidity token follows a standard similar to ERC1155, before introducing the characteristics of LB’s liquidity token, a brief description of ERC1155’s token standard is given. ERC-1155 was developed by Enjin, which solved the problem that the same token smart contract can only support homogeneous tokens (ERC20) or non-homogeneous tokens (ERC721). The ERC-1155 token contract can support both homogeneous and non-homogeneous tokens in one token contract. In the ERC1155 contract, each token is marked by its ID, not by the contract address, which means that the contract can manage tokens with multiple IDs. The same ID may have many homogeneous tokens or a single non-homogeneous token.
The most common application scenario of ERC-1155 is games, because the game system contains multiple homogeneous tokens and multiple non-homogeneous tokens. LB adopts a method similar to ERC-1155, using the ID system concept. Specifically:
-
The homogeneous liquidity tokens within the same Bin can reduce gas consumption and provide the possibility of lightweight protocol fee calculation and the complexity of the entire accounting system.
-
Different Bins have different IDs to distinguish homogeneous liquidity within different Bins.
-
The combination of points 1 and 2 allows LPs of LB to easily adopt more complex strategies to allocate their liquidity and achieve diverse purposes.
As shown below, Trader Joe provides rich LP deployment options to respond to user needs:
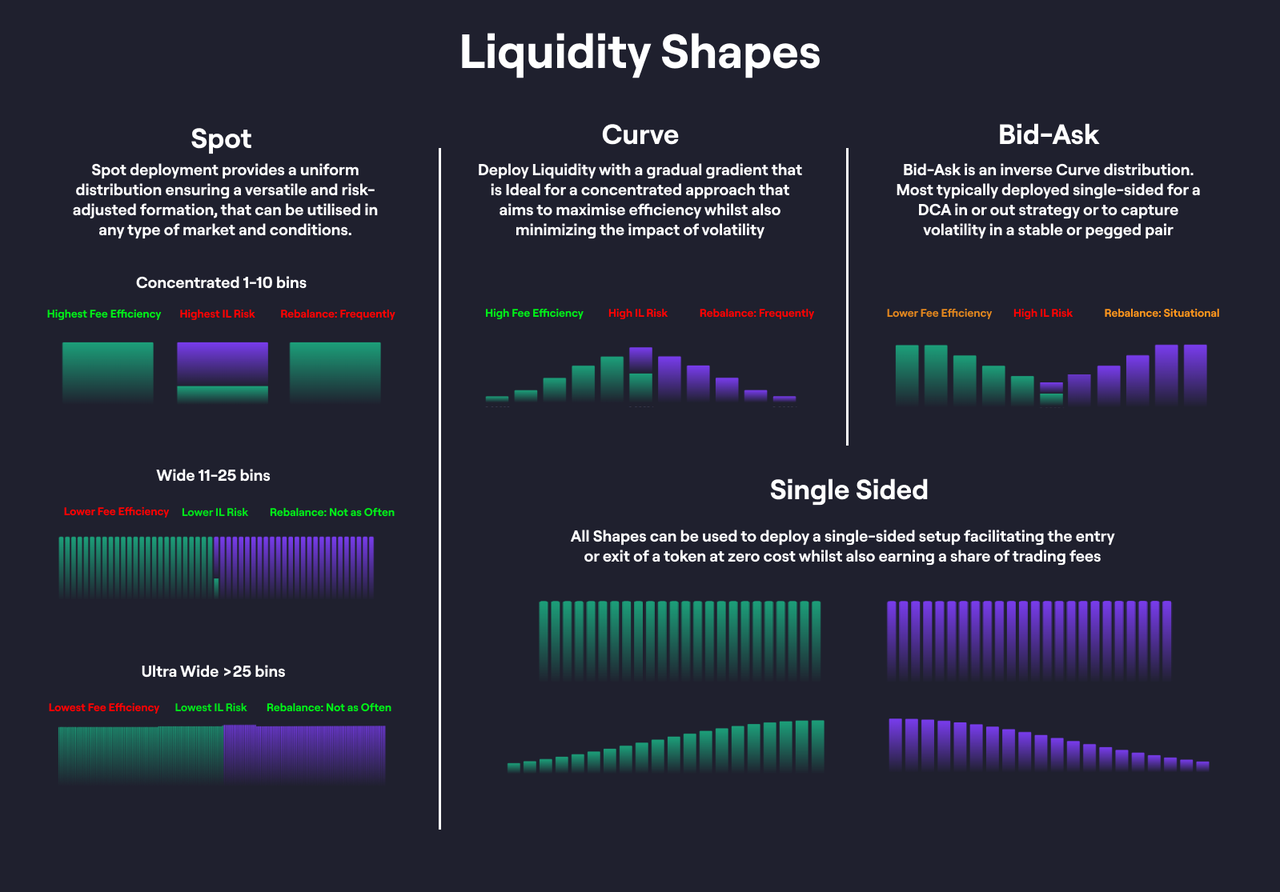
Image source: Trader Joe document
In addition, the characteristics of Trader Joe’s LB include:
-
Before the liquidity in the same Bin is exhausted, the price of the transaction remains unchanged. Therefore, the advantage of the transaction quotation makes it easier to capture the trading volume routed to it, but it also magnifies the impermanent loss.
-
Introduce variable fees, that is, the higher the token price volatility, the higher the transaction fee rate, which compensates for LP’s impermanent losses by increasing transaction fee income.
-
Better composability: relative to Uni V3’s LP certificate using the ERC-721 NFT format (which is difficult to integrate with ERC20-focused Defi), LP based on Bin-built liquidity order book adopts a standard similar to ERC-1155, theoretically making its LP certificate more similar to homogeneous ERC20 tokens, thus having better composability.
c. Scene of the liquidity order book
Based on the convenience of Bin’s market-making and order-placing strategies and the ease of combination, other projects and users can try more ways of liquidity order books.
– Project party’s attempt
On May 9th, “White Lotus” went live, using Trader Joe’s order book model for token issuance and Ponzi mechanism operation:
-
The total supply of project token LOTUS is 30,000,000 tokens, and it is sold through the Trader’s JOE pool with uniformly distributed order placement. The initial price of the first token in the Bin is $0.20, and the price of the last token in the Bin is $4.2. The ETH used to purchase LOTUS will be locked in liquidity in the pool. The order interval of LOTUS’s Bin is 5 Bins. The specific order distribution is shown in the following schematic:
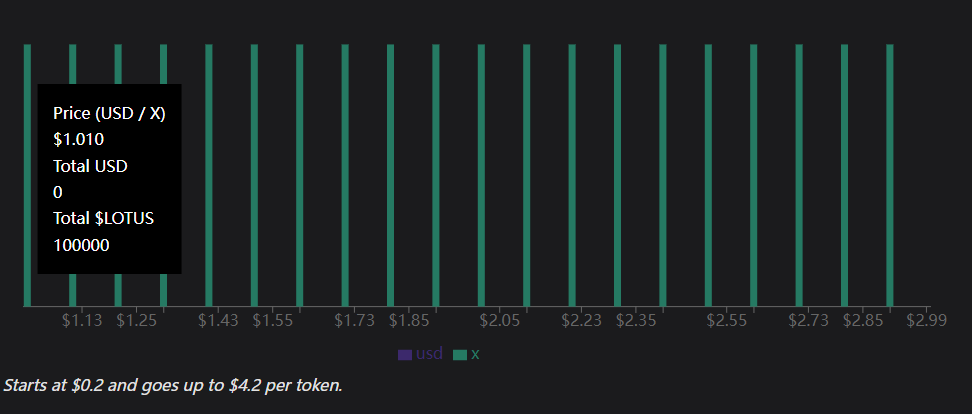
Image source: White Lotus document
-
When users sell LOTUS, a 10% tax will be levied, of which 8% will be permanently destroyed, causing token deflation, and the remaining 2% will be used to reward LOTUS stakers.
-
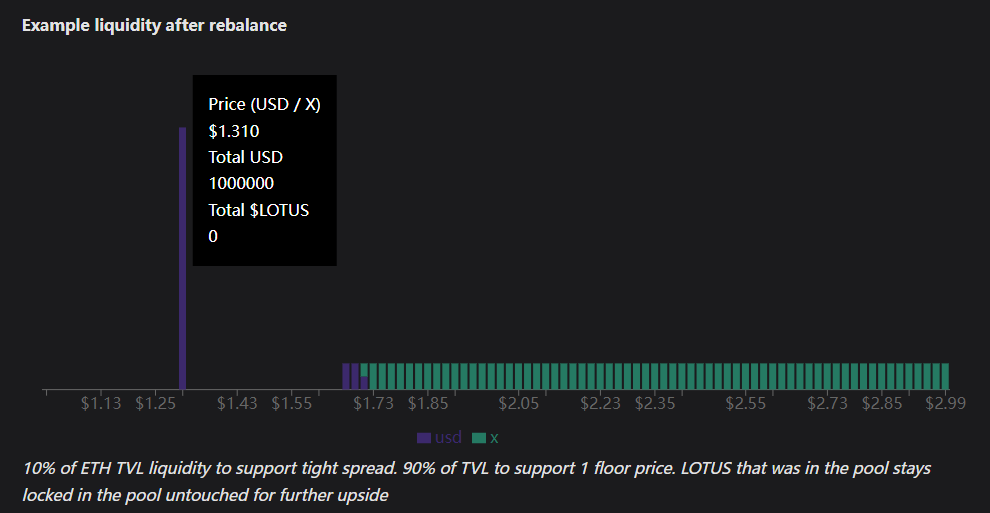
LOTUS has an automatic liquidity rebalancing mechanism. When the price moves 5 Bins, liquidity rebalancing will be automatically executed, and the ETH liquidity in the pool will be redistributed as follows:
-
Take 10% of the ETH in the pool as “direct transaction liquidity” and place it in the Bins adjacent to the current active price, making it easy for users to buy and sell in the current price range.
-
Take the total ETH value/LOTUS to obtain the “minimum price” of LOUTS, and concentrate the remaining 90% of ETH in the Bin of the minimum price for order placement. This bottom price can accept all LOTUS circulating tokens for sale at any time.
After a certain rebalancing, the liquidity order of LOTUS is shown in the following figure:
-
-
In an ideal situation, due to the limited total amount of LOTUS, the token burning and bottom price increase brought by transactions will provide a spiral upward force for LOTUS.
However, due to various reasons, White Lotus failed soon after its launch (other users built a separate trading pool without contributing fees and burning, and there was a large vacuum between centralized liquidity and bottom price). But later imitations such as Jimbo also adopted Trader Joe’s liquidity order book as the underlying mechanism of their own.
– User Practice
LB’s convenient market-making experience has also received good feedback from users. After the ARB token was airdropped in March of this year, its on-chain trading volume remained high. Uniswap V3, which landed on Arbitrum early on, naturally gained the largest liquidity and trading volume, but Trader Joe also became the second largest DEX in terms of ARB trading volume at that time, with 45% of ETH-ARB trading volume, thanks to LB’s product experience and market-making reward operations.
In addition, Trader JOE V2 is also suitable for asset selling and bottom-fishing through its order placement function using the “dollar-cost averaging” (DCA) selling strategy.
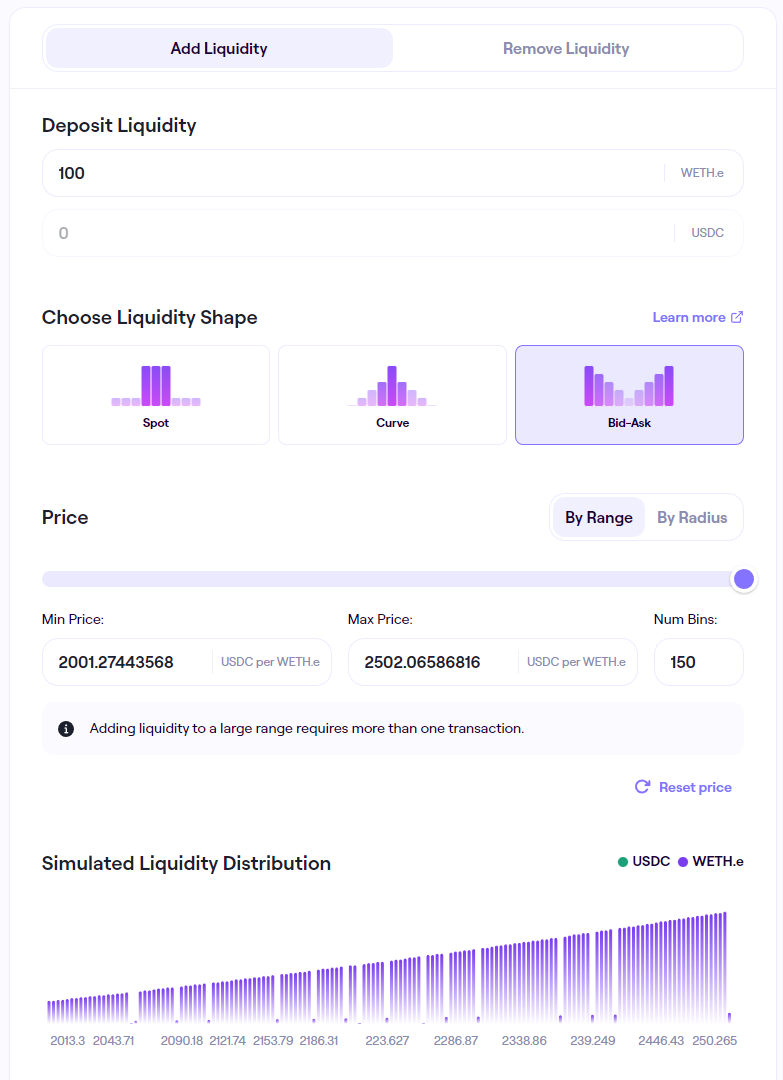
For example, if a user wants to sell 100 ETH to take profits as the price rises within the price range of $2,000 to $2,500, and hopes that the selling position will increase as the price rises, and finally liquidate all positions around $2,500, this is a variable version of the dollar-cost averaging (DCA) liquidation strategy.
This requirement can be easily met through LB V2. We only need to deposit 100 ETH unilaterally, set the selling range (2000-2500), and select the Bid-Ask mode (the selling order volume increases as the price rises), which can easily realize this requirement.
As shown below:
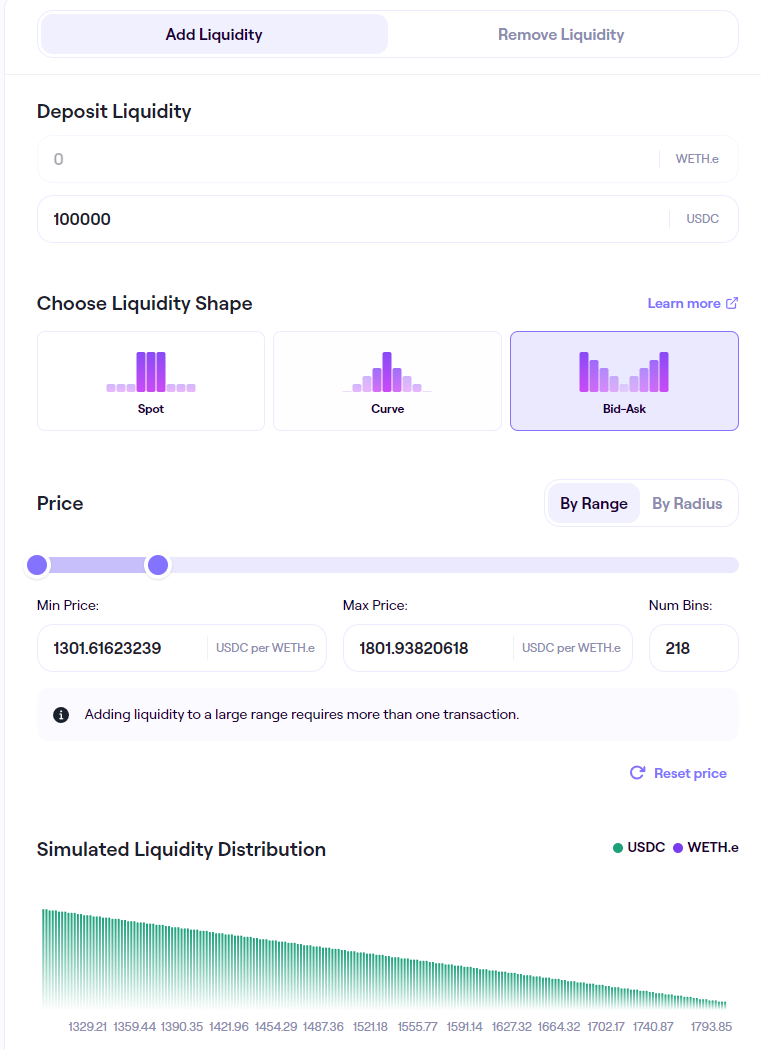
On the contrary, if you want to buy ETH worth $100,000 at a price of $1,300 to $1,800, and complete the entire purchase around $1,300 as the price falls, this is a variable version of the dollar-cost averaging (DCA) building strategy. We only need to deposit $100,000 USDC unilaterally, set the buying range (1300-1800), and select the Bid-Ask mode. When ETH falls to this range, the building can be completed automatically, as shown below:
Overall, the liquidity order book of Trader Joe is based on the Bin and order book modes, which reduces the management threshold of LP’s centralized liquidity, and this convenience also provides more comprehensive trading and market-making strategies.
In addition, among the many DEXs surveyed by the author, Trader Joe’s product interaction experience ranks among the top, specifically:
-
Simple and beautiful UI design and intuitive and easy-to-understand page layout, even new users can easily get started
-
The data dimensions of the order pool and pledge amount are rich, detailed, and easy to understand. The author believes that this is very important for DeFi financial products. Real-time and transparent business data is one of the main characteristics of DeFi products compared to TradFi, but data visualization is also important.
2.1.2 Borrowing and Lending: Banker Joe
Banker Joe is a borrowing and lending product launched by the project in 2021, forked from Compound and Cream. At its peak, it had a TVL of up to $1 billion, but the deposit funds for the borrowing and lending business have now shrunk to around $10 million, making a small contribution to the project’s operations and profits and is not currently a focus of the project’s development.
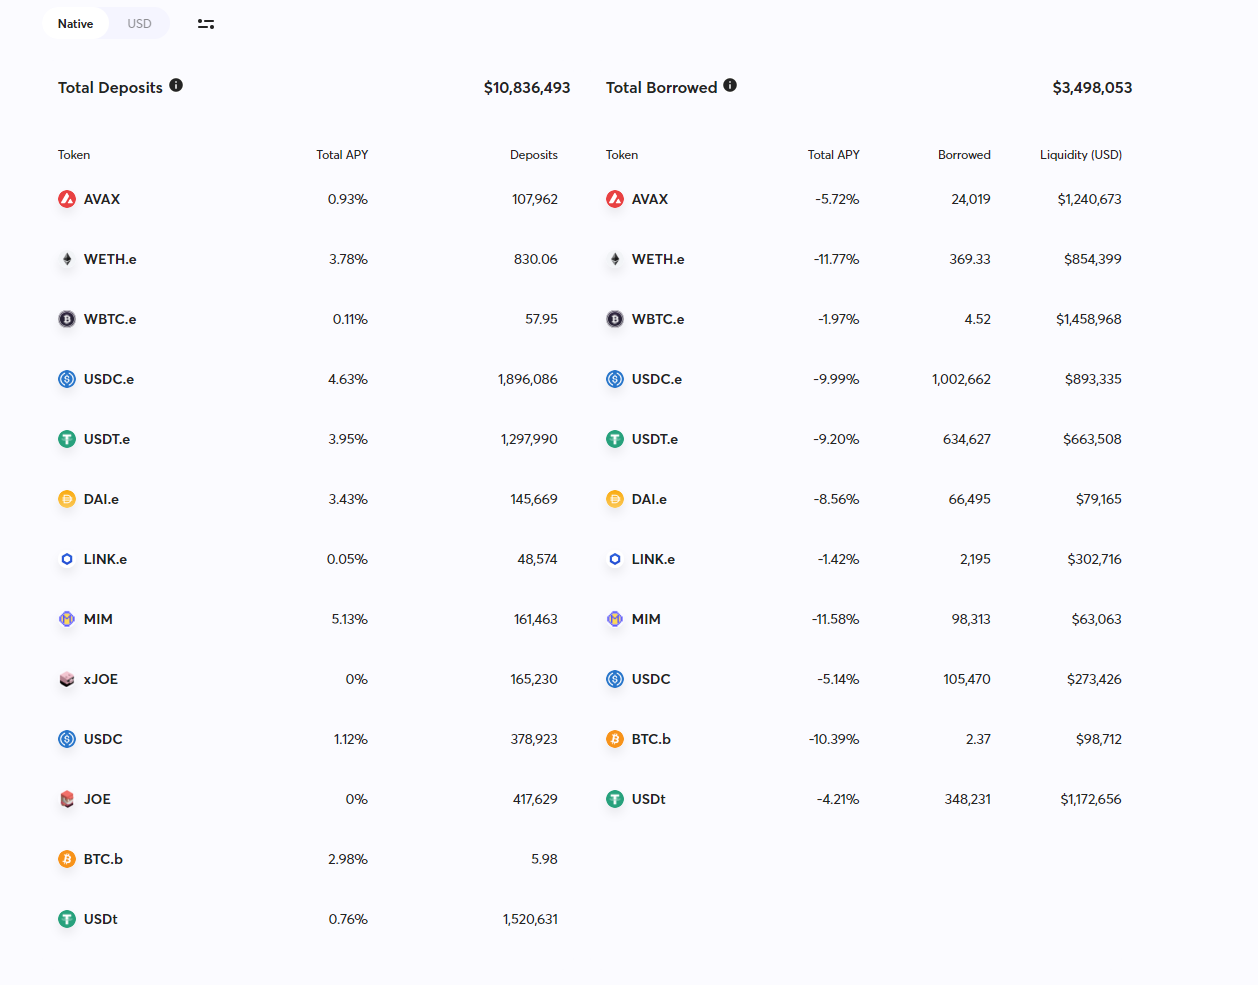
Current Banker Joe business data, source: https://v1.traderjoexyz.com/lend
2.1.3 NFT Trading: Joepegs
Joepegs was launched in April 2022 and currently supports NFT trading on Avalanche and BNBchain. However, from the trading volume, the NFT trading volume on both chains is not high.
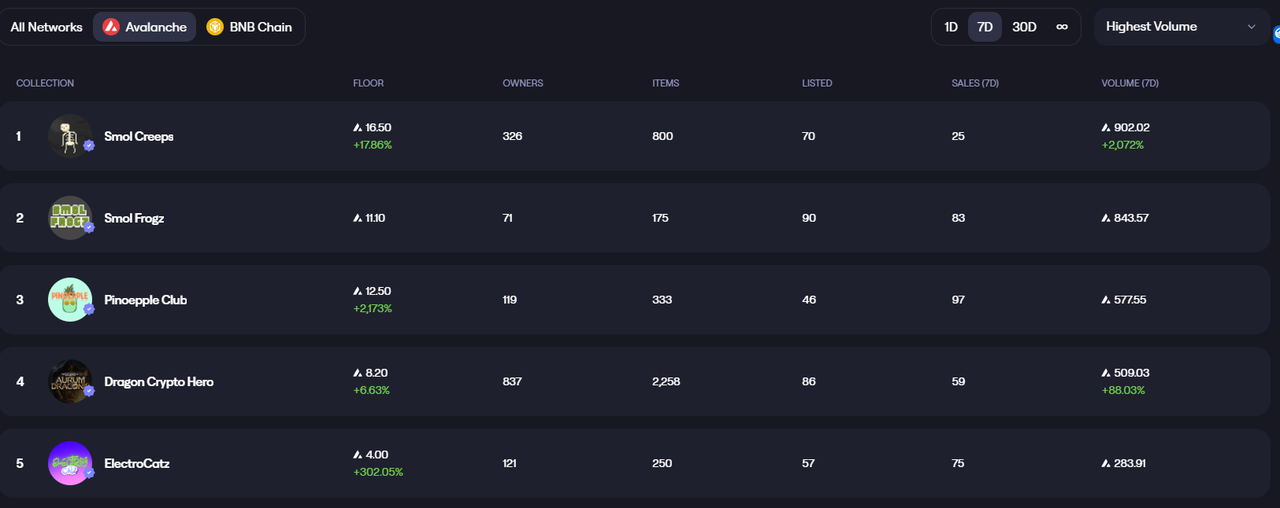
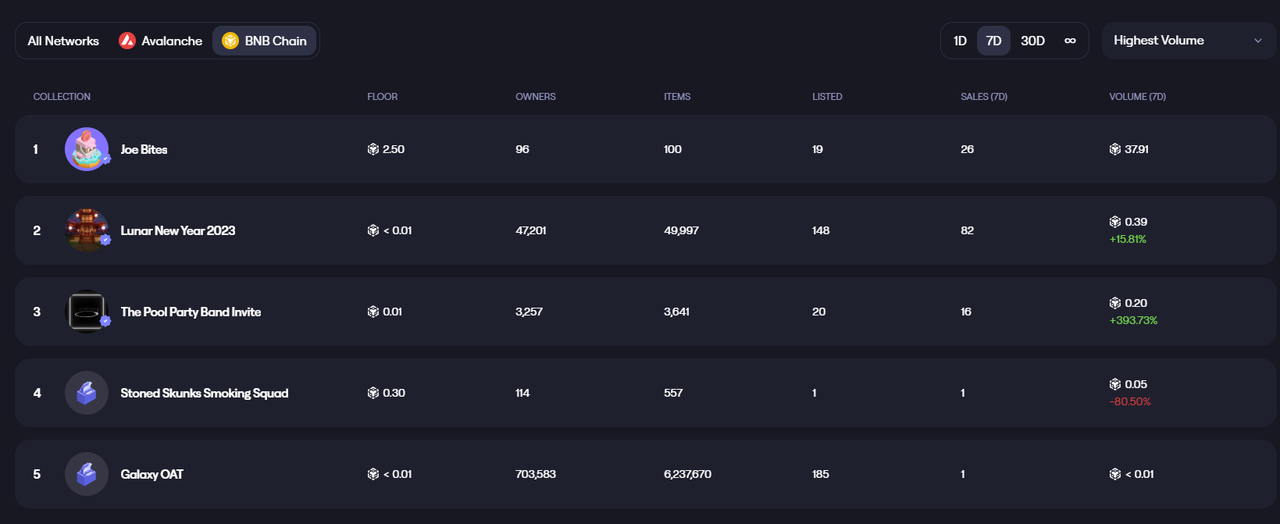
Joepegs’ Avalanche NFT trading volume, the largest trading volume for an NFT series in the past 7 days, is 902 AVAX (about $12,600), while the highest weekly trading volume for an NFT on BNBchain is only 37.9 BNB (about $11,470).
The NFT business segment also contributes very little to the project and is considered a marginal business (but the project team is still actively promoting it).
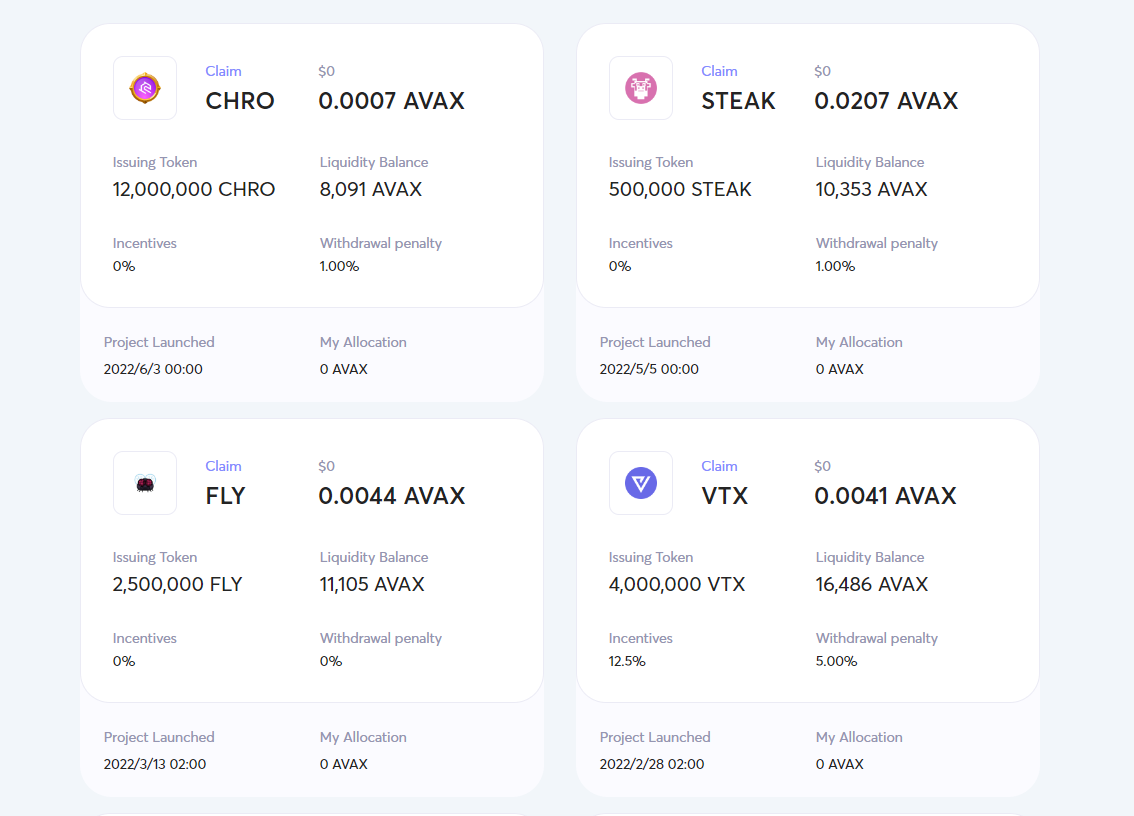
In addition, Trader Joe also launched the launchBlockingd module Rocket Joe in early 2022, but now this business is basically stagnant, with the last project launched in June 2022 for CHRO.
2.2 Project History and Roadmap
Below are the important events since the launch of the Trader Joe project as of mid-May 2023.
|
Time |
Event |
|
June 2021 |
The project was announced on June 1st. The Trader Joe contract code was open sourced in the latter half of the month, and the project was officially launched at the end of June. |
|
September 2021 |
Raised $5 million in strategic investment, led by Defiance Capital, GBV and Mechanism Capital, with other participating parties including Three Arrows Capital, Coin98 Ventures, Delphi Digital, Avalanche Foundation, and Stani Kulechov, founder of Aave, at a valuation of $50 million. |
|
October 2021 |
The borrowing and lending product Banker Joe was launched, which is forked from Compound and Cream and uses Chainlink’s oracle for asset pricing. |
|
October 2021 |
Trader Joe and Avalanche jointly launched a $20 million liquidity mining plan, each providing $10 million in Joe and $10 million in Avax. |
|
January 2022 |
Launched the launchBlockingd product Rocket Joe, and users who pledged Joe tokens will continue to receive rJOE points as a condition for participating in launchBlockingd. |
|
February 2022 |
Released the revised economic model, Staking V2, which introduces the veJoe model. veJoe is generated by pledging Joe tokens, and the longer the pledge duration, the more veJoe is generated. veJoe is used to accelerate users’ liquidity mining earnings. |
|
April 2022 |
Launched the NFT trading market Joepegs. |
|
August 2022 |
Released the V2 white paper and introduced the Liquidity Book strategy. This scheme is similar to the centralized liquidity scheme of Uni V3, except that it uses “bin” as the price interval unit and introduces a dynamic fee rate mechanism to increase LP transaction fee revenue during periods of large price fluctuations. |
|
November 2022 |
Liquidity Book (V2) officially launched. |
|
December 2022 |
Trader Joe deployed to Arbitrum. |
|
January 2023 |
Announced plans to deploy Trader Joe and Joepegs to BNBchain and complete the deployment by the end of March. |
|
January 2023 |
Previewed Trader Joe V2.1 features, including an incentive plan based on the liquidity order book, automatic liquidity management, limit orders, and permissionless liquidity order pools. |
|
January 2023 |
The token model is adjusted again, with new additions including Joe’s native multi-chain deployment, the application of sJoe on Arbitrum and BNBchain, the reward acceleration function of veJoe in the liquidity order book, and the abandonment of rJoe. |
|
February 2023 |
Announced cooperation with Layer0 to make Joe a native multi-chain token. |
|
April 2023 |
Trader Joe V2.1 version officially launched. |
2.3 Team
Trader Joe team is anonymous, with @cryptofishx and @0xmurloc as its two co-founders.
@cryptofishx is a full-stack engineer with extensive experience in the Web3 field. He has contributed to @throwsnowballs, @Blockingndaswapex, and @sherBlocking_cash on Avalanche, and has worked for Google and a decentralized derivatives exchange.
On May 13th, @cryptofishx emotionally recalled his experience during the bear market in 2017-2018. At that time, he was a doctor and lost all his profits and 2/3 of his principal in the bear market. He learned to code and advanced math during work hours, obtained two relevant degrees in two and a half years, entered Google, and then founded Trader Joe part-time and succeeded.
On May 17th, @cryptofishx emotionally made a statement and pinned it:
“When we first founded Joe, I made a commitment to myself to make sure I wouldn’t leave the project after two years, because that was the time when most projects disappeared. Our 2nd birthday is coming up soon and I’m happy to say that we’re still here, building with the same energy as day one.”
This may be an example that the founder still maintains a good entrepreneurial state and has a strong affection for the project.
Little information is disclosed by the other co-founder of Trader Joe, @0xmurloc. Public information only mentions that he is a full-stack engineer and product manager, and before he started his own business full-time in 2021, he worked as a product manager for a just-listed unicorn, holding an electronic engineering degree from a well-known institution.
The author also consulted Trader Joe’s community staff about the issue of team size, and the other party stated that it is not convenient to disclose relevant information at the moment.
In the rapidly changing market competition and impetuous entrepreneurial environment of the crypto world, the diligence of the Trader Joe team is still impressive. On the one hand, they have tried and landed multiple product directions (Dex, lending, launchBlockingd, NFT trading platform) in just two years, actively following up on emerging trends and demands in the market; more importantly, they have carried out active native mechanism innovation on the core base of Dex, and the design and attempts in the economic model are also very active (see the “Token Model” analysis section for details).
2.4 Financing and Important Partnerships
According to public information, Trader Joe has only raised institutional funding once, in September 2021 (3 months after the product was officially launched), with a funding amount of $5 million and a valuation of $50 million. The funding was led by Defiance Capital, GBV, and Mechanism Capital, with other participants including Three Arrows Capital, Coin98 Ventures, Delphi Digital, Avalanche Foundation, and Aave founder Stani Kulechov.
3. Business Analysis
3.1 Industry Space and Potential
Dexs is a track that the author and Mint Ventures have been following and tracking for a long time. It has been analyzed in the past special reports on Curve and the track reports of the ve(3,3) project. Spot trading is the largest commercial scenario for cryptocurrency users with the most frequent exchange of funds.
According to DeFillama data, the total 24-hour trading volume of Dexs is $2.27 billion, which accounts for 14.75% of the total cryptocurrency spot trading volume. Although this data is still not high, it has risen by nearly 100% since the author’s last statistical data in the report “Understanding Curve Correctly: Business Status, Ecological Development, Moat and Valuation Comparison of Head Liquidity Markets” (written in February 2023).
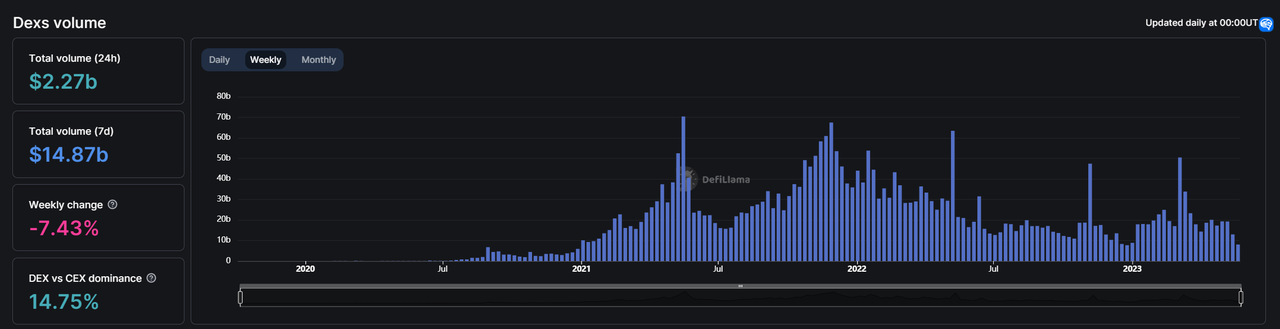
Data source: https://defillama.com/dexs
In addition to spot trading, the business of the Dexs track itself also includes liquidity procurement. The representative projects for operating this business mostly use the ve token model pioneered by Curve, or the ve (3,3) model modified based on the ve model (representing the Velodrome project). If only looking at the revenue from the liquidity procurement business (referring to the bribes paid by other project parties to purchase liquidity from Dexs), it seems that this revenue is much higher than Dexs’s spot trading. However, if the ve-type Dex’s own token incentive is regarded as “liquidity procurement cost” and the bribe income is regarded as “liquidity sales revenue”, then most of the Dexs operating this business are currently in a loss state (indirect income from acquiring governance rights by directly purchasing tokens is not considered here).
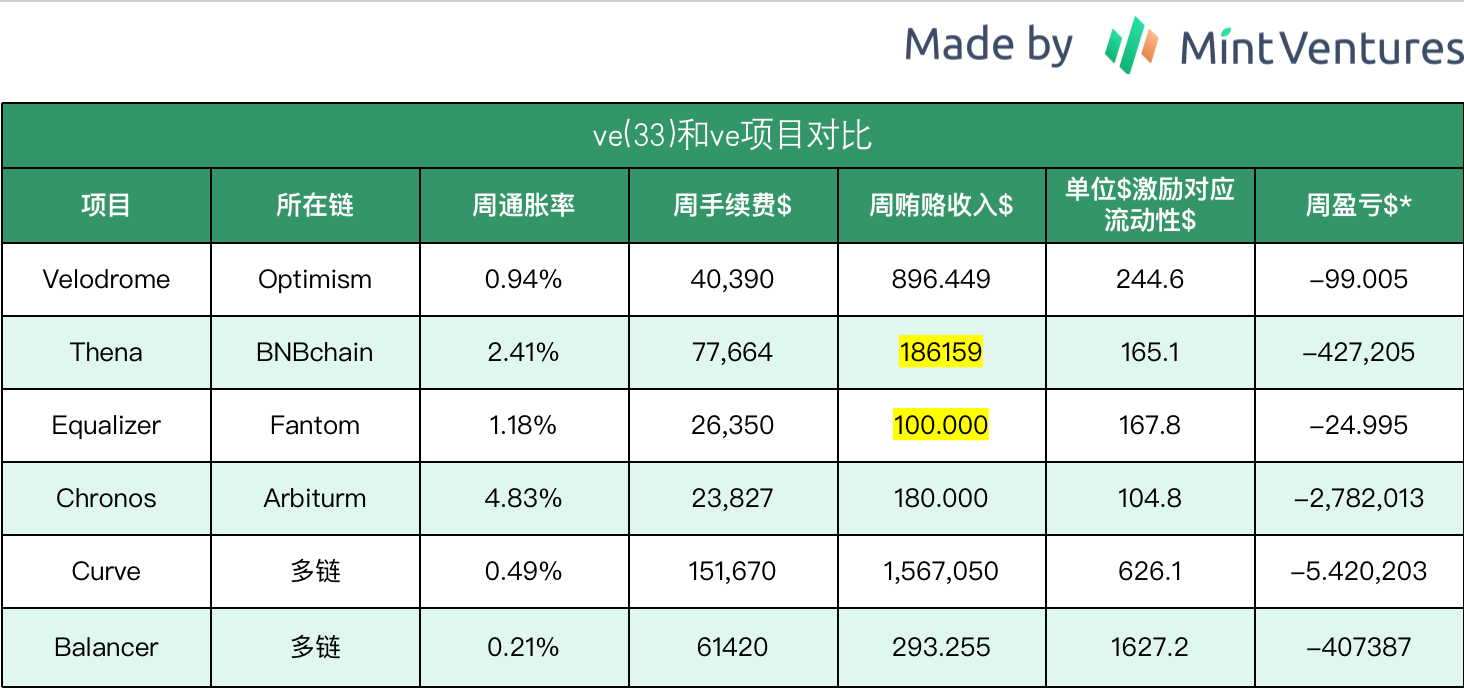
PS: 1. The above data statistics and calculations are as of May 5, 2023. The highlighted data is estimated. The original text is from the Mint Ventures report “From Velodrome to Chronos, ve(3,3) is back again. Is it a better Dex model?”
2. The primary source of data used for calculation comes from official disclosures and Defillama.
3. For Curve and Balancer’s bribe income, bribe data from Votium, Hiddenhand, and Votemarket is used.
*[Profit and loss] here refers to revenue (fees + bribes) – liquidity emission incentives
The driving force behind the growth of the Dexs track, in addition to the overall increase in the size of the crypto business world’s assets, includes several key points:
-
Users’ loss of trust in centralized institutions and the increase in demand for asset autonomy
-
The composable nature of the DeFi ecosystem in which Dex is located greatly enhances users’ capital efficiency and freedom
-
Most native Web3 projects choose Dexs as their first stop for trading and deploying liquidity
However, on the other hand, Dexs, as the clearest and most basic business model track, has long entered the red ocean competition stage. The head of Uniswap V3 continues to offer services for free, while other improved versions based on various micro-innovations continue to emerge, and the token subsidies of various Dexs are far from ending, putting the entire industry in a state of bearing the burden of fierce competition.
To get out of this state, in addition to expecting business growth brought about by the recovery of the crypto market, it is more important for Dexs to find a way to build solid barriers and start making profits.
3.2 Business situation
In this section, the author will summarize and analyze business data such as Trader Joe Dex’s TVL, trading volume, transaction fees/income, and active user count. As lending and NFT businesses have low business volume and have a relatively small impact on project fundamentals, they will not be analyzed in detail here.
3.2.1 TVL
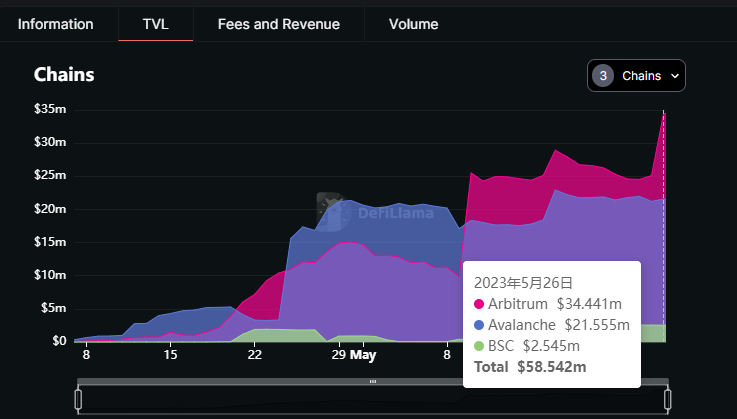
During the peak of the previous bull market on Trader Joe, TVL reached as high as $2.6 billion, but as the market entered a bear market, liquidity quickly evaporated, and the current TVL of Dex (V1, V2, V2.1 total) is around $110 million.
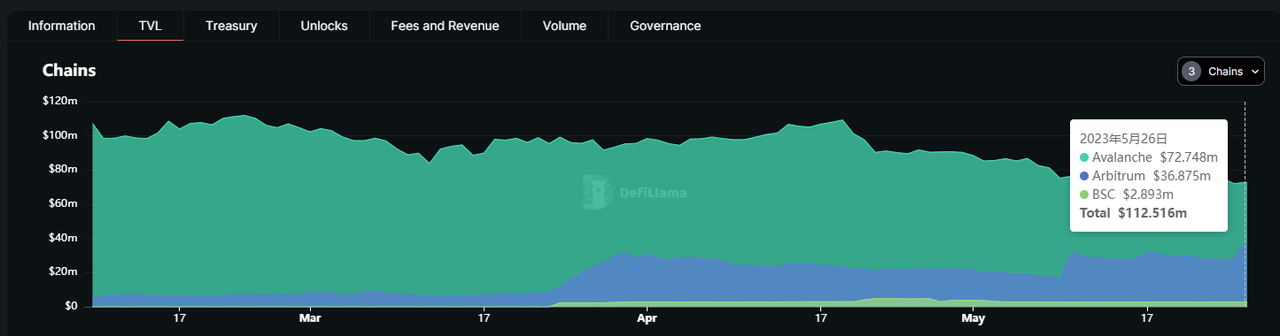
Trader Joe's TVL composition, data source: https://defillama.com/protocol/trader-joe
Among them, Avalanche accounts for 65%, Arbitrum accounts for 33%, and BNBchain accounts for 2%. From the TVL trend chart above, it can be seen that Trader Joe’s liquidity on Arbitrum continues to rise while Avalanche’s corresponding liquidity decreases.
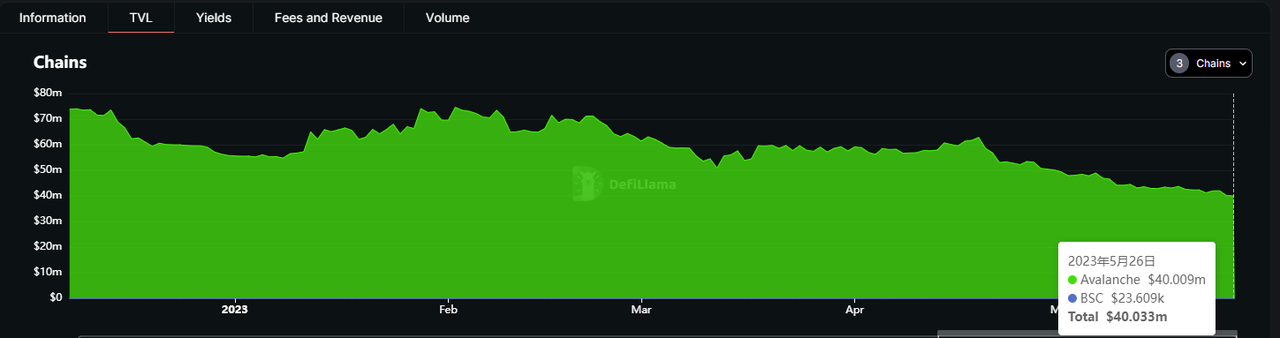
V1 TVL trend, data source: https://defillama.com/protocol/trader-joe
V2.1 TVL trend, data source: https://defillama.com/protocol/trader-joe
Observing the V1 and V2.1 data of Trader Joe again, it can be seen that V1 has been in a slow decline since the beginning of this year, while V2.1 has risen rapidly, with the main source of data increase being the growth of Arbitrum business volume.
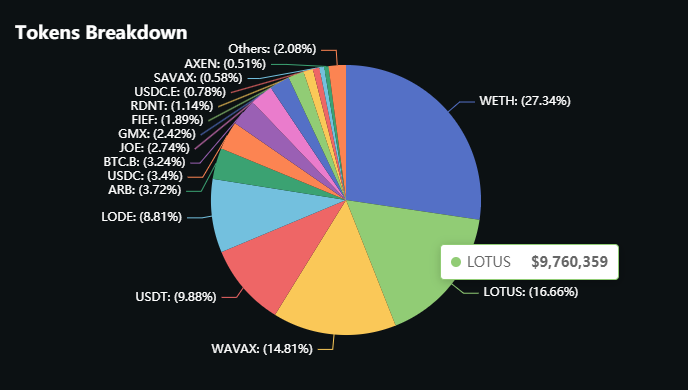
V2.1 TVL composition, data source: https://defillama.com/protocol/trader-joe
When we look more closely at the token composition of the V2.1 TVL, we can see that in addition to mainstream tokens such as ETH, the token of the White Lotus project, which uses the Trader Joe order book as its liquidity distribution mechanism, ranks second and accounts for 16.66% of the total liquidity.
3.2.2 Trading Volume & Fees
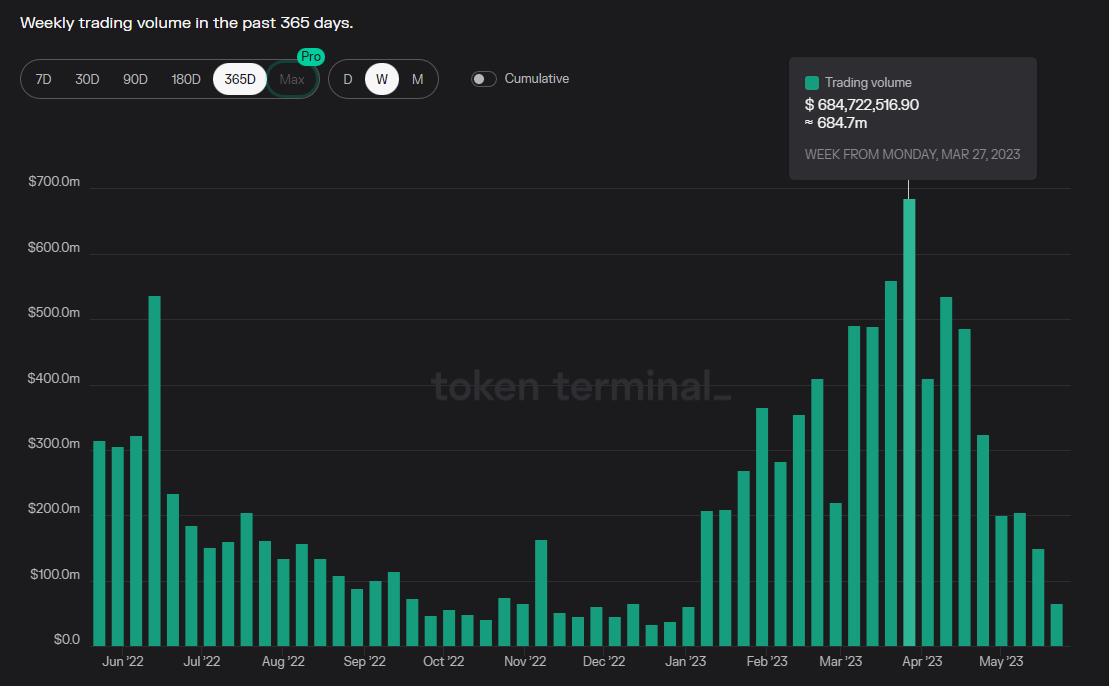
Data source: https://tokenterminal.com/terminal/projects/trader-joe
In terms of trading volume, Trader Joe reached a new high in a year in late March of this year when the market was relatively active (which was also the period of the most active trading after the Arbitrum airdrop), with a weekly trading volume of US$688 million.
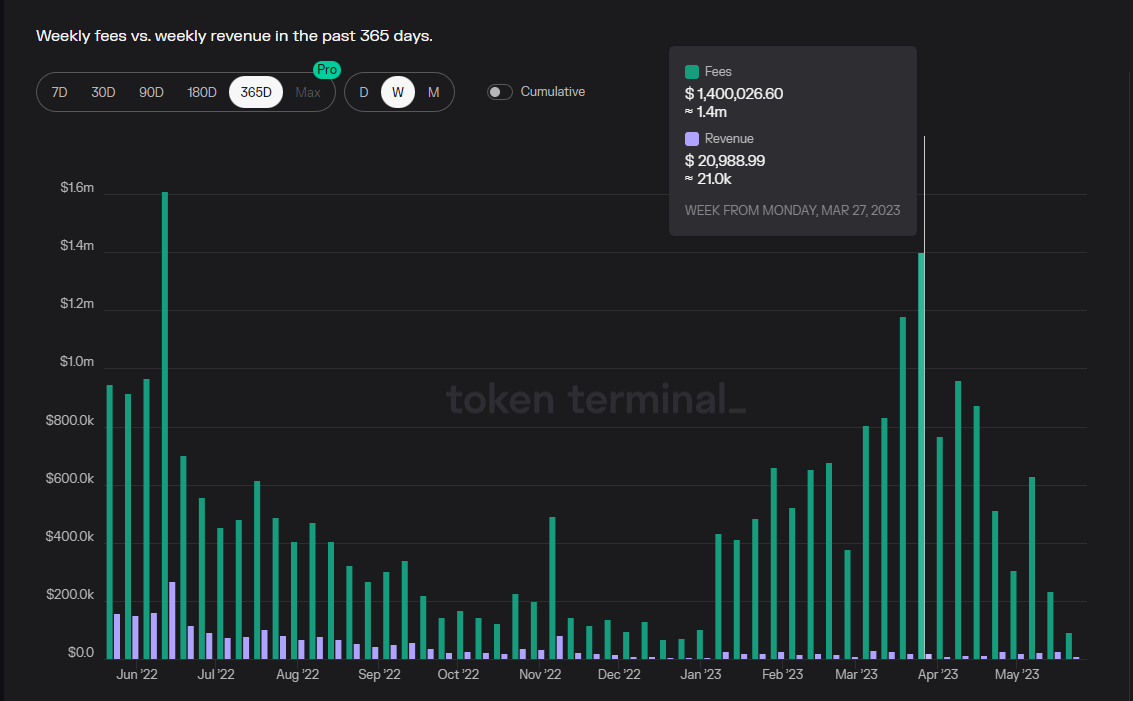
Data source: https://tokenterminal.com/terminal/projects/trader-joe
However, during the same period when trading volume returned to a new high, Trader Joe’s fee income was far less than the fee income during last year’s peak period. The weekly fee income at the end of March was $21,000, less than 1/10 of the weekly fee income of $260,000 at the peak in June last year.
The reason for this is that since the launch of Trader Joe’s V2 in November last year to April this year, Joe has allocated all of V2’s fees to LP, and only recently began to collect protocol fees and distribute them to Joe’s stakers after the launch of V2.1. In addition, the protocol income ratio of Trader Joe has multiple modes, among which:
-
V1: 0.05% of all transactions are charged as protocol income
-
V2: No protocol fees are charged, and all protocol fees are distributed to LP
-
V2.1: Different LB pools are charged different rates of protocol fees, ranging from 0-25%. For example, in the JIMBO/ETH pool shown in the figure below, the basic fee rate is 0.8%, and the dynamic fee rate upper limit is 2.4875%, with 25% of the protocol fee charged as protocol fees
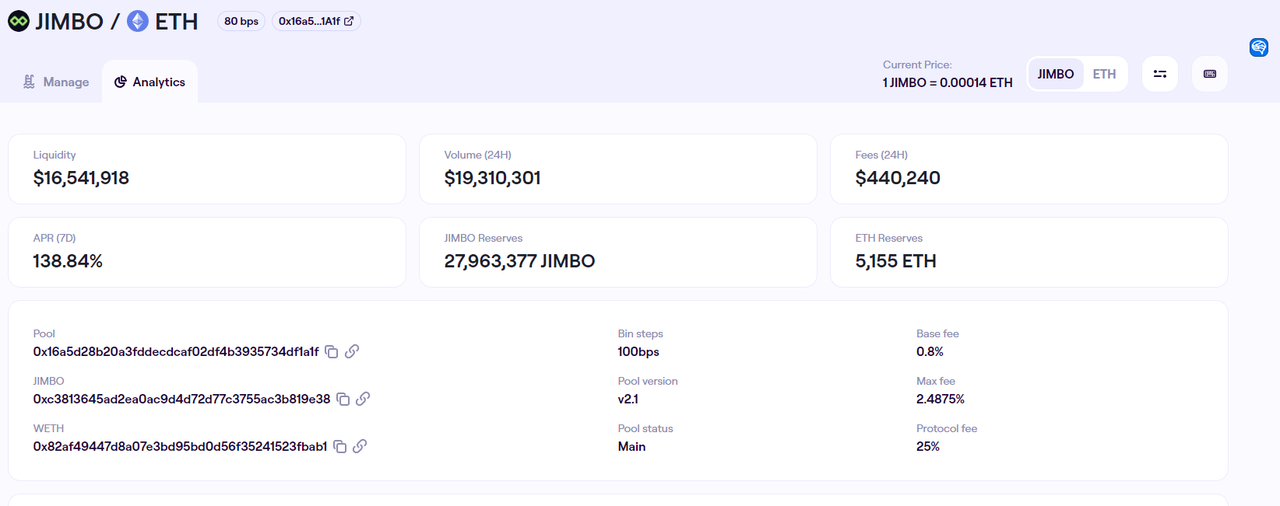
After the launch of V2.1, Trader Joe’s protocol revenue/total fee ratio has been rising again from the low point in March this year (0.62%), and currently the protocol revenue accounts for 9.57% of the total fee.
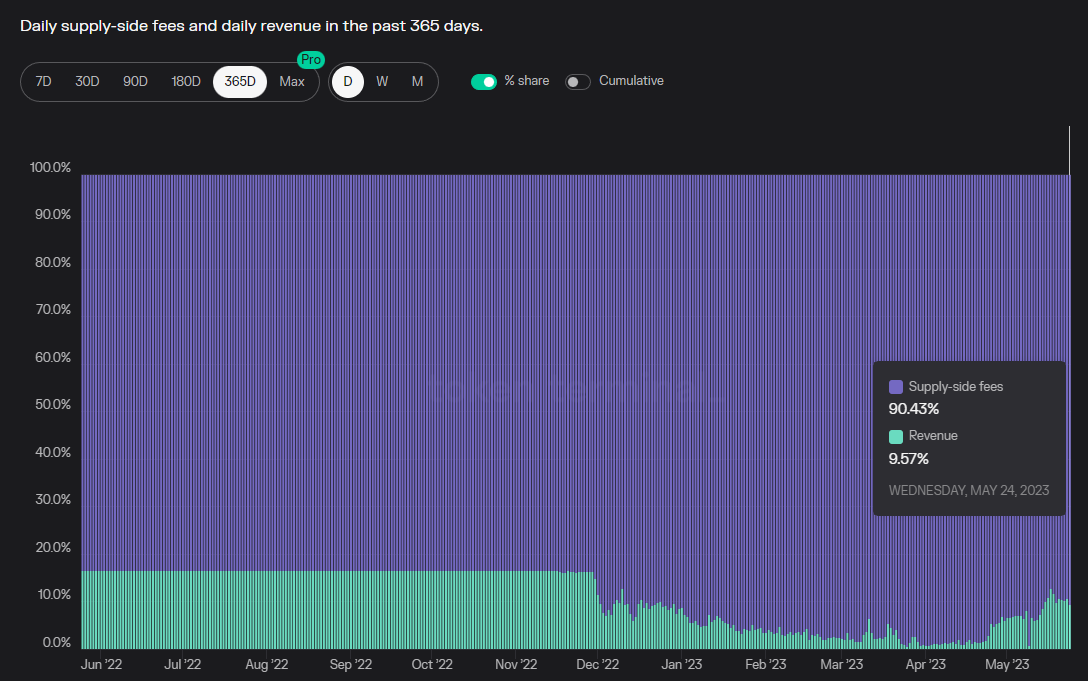
Data source: https://tokenterminal.com/terminal/projects/trader-joe/revenue-share
In order to have a comprehensive understanding of the protocol charging design of Trader Joe V2.1, the author conducted statistics and comparison of the protocol fee rate of several LB Pools with large trading volume on the chain where Trader Joe is located, as follows:
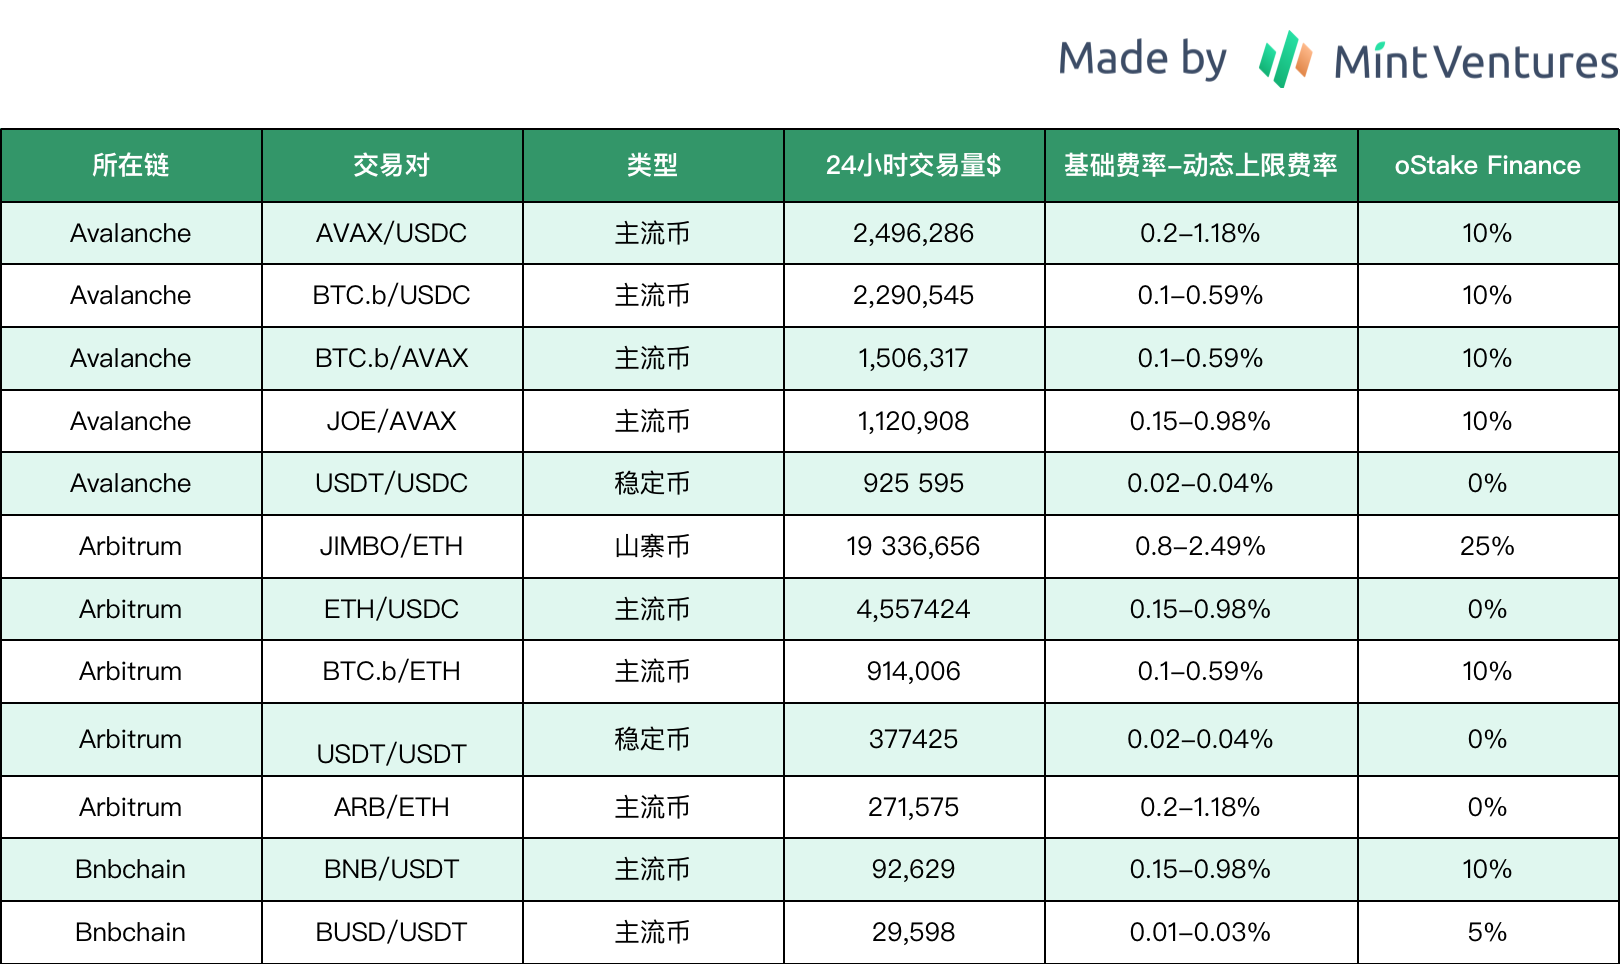
Statistics time: 2023.5.26
From the above table, we can see that the pricing strategy for protocol fees adopted by Trader Joe currently is:
1. Focus on developing the Arbitrum market and adopt a strategy of charging less or no protocol fees
2. Mainstream stablecoins basically adopt a free strategy and only make business data (transaction volume and TVL) without making money
3. The BNBchain business can be basically ignored, so the normal fees are charged
4. For new projects, especially those based on LB mechanism design (such as JIMBO and LOTUS), higher fees are charged
3.2.3 Active Users
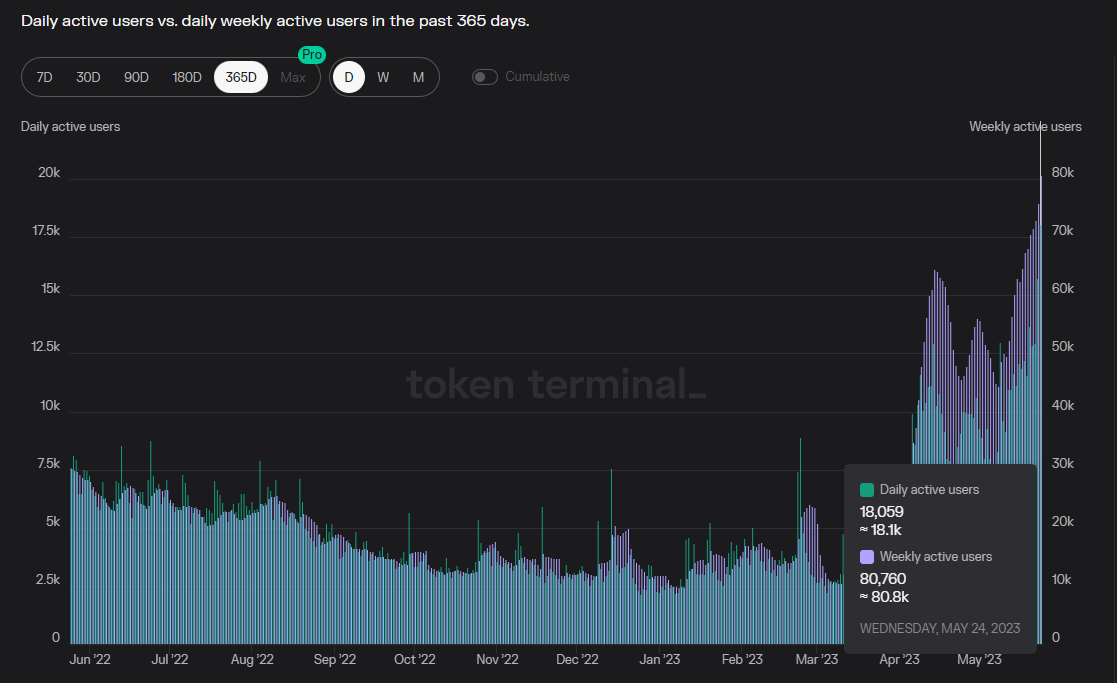
Data source: https://tokenterminal.com/terminal/projects/trader-joe
Since the deployment of V2.1, the number of active users on Trader Joe has increased significantly, reaching a new high since the protocol was born. The recent daily active address number is 18,000, the weekly active address number is over 80,000 (Defillama data is 110,000), and the monthly active address number is nearly 200,000. The continuous growth of C-end users should be attributed to Trader Joe’s excellent product interaction experience.
3.3 Project Competition Pattern
From the current perspective, Trader Joe is mainly based on Avalanche as its main business base, and puts most of its energy into the business expansion of Arbitrum, which is also the main source of its business growth in the future. We will focus on the market share of Trader Joe on Avalanche and Arbitrum.
3.3.1 Avalanche
Avalanche is one of the fastest-growing L1s in the last bull market, but during the bear market, its market share in terms of TVL and trading volume has been continuously declining. The TVL share has dropped from a peak of 9.8% to the current 1.51%, and the trading volume share has dropped from 9.84% to the current 1.19%.
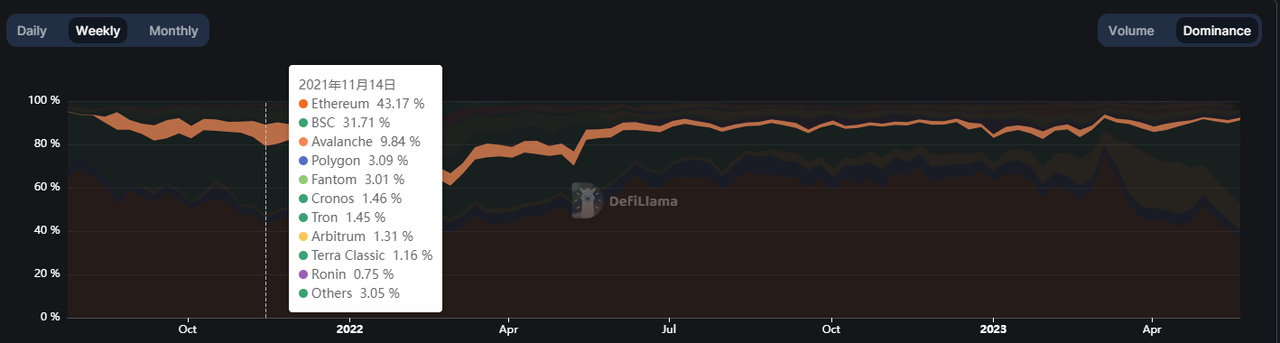
Avalanche trading volume market share, source: https://defillama.com/dexs/chains
On Avalanche, Trader Joe has a clear advantage in both TVL and trading volume due to its early establishment and development.
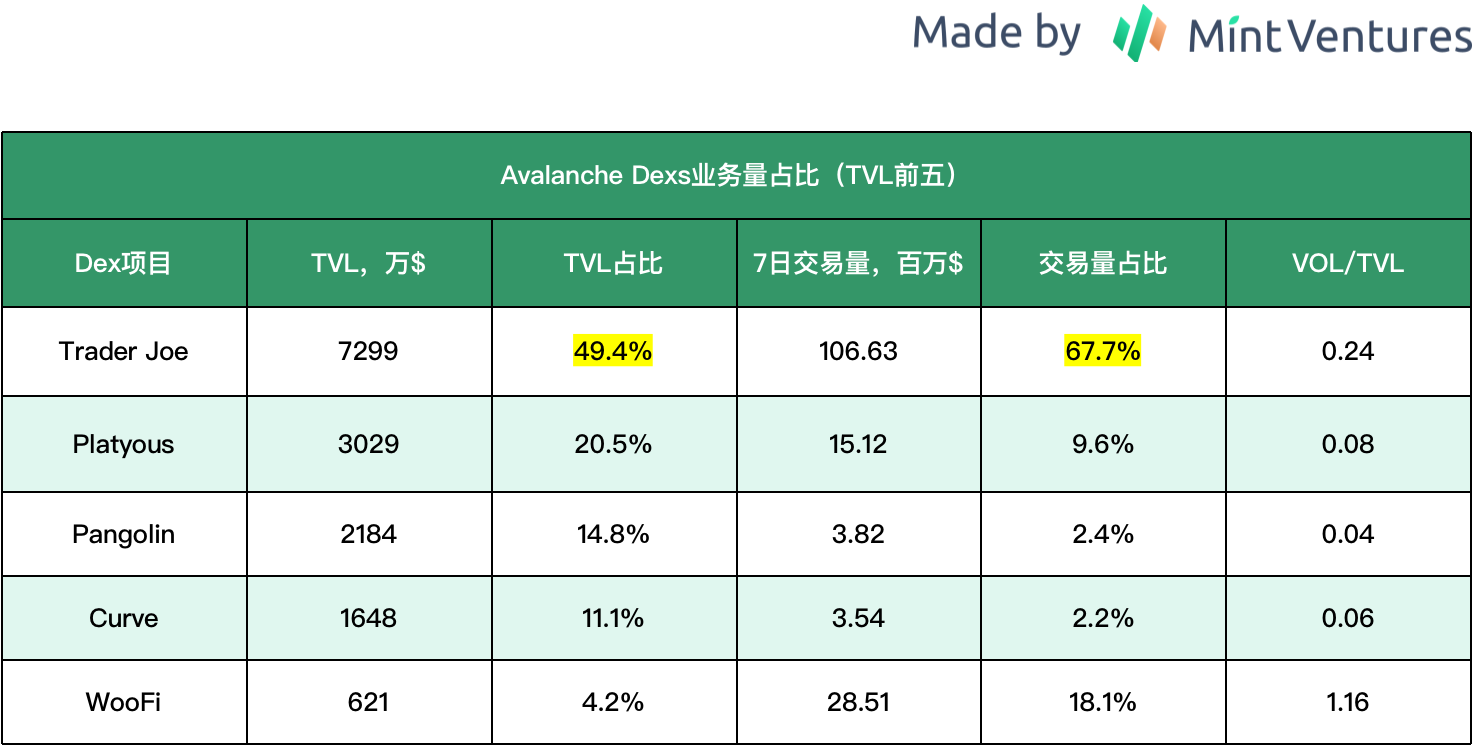
Source: Defillama, PS: The proportion calculation is based on the top 5 total volume statistics time: 2023.5.26
It is worth noting that in March of this year, Avalanche Labs and Uniswap’s governance members, the University of Michigan Blockchain Association, proposed deploying V3 to Avalanche. The proposal was passed on March 19th. According to the estimated time of the proposal at that time, the deployment would take about 5 weeks, which means that Uniswap V3 should be coming to Avalanche soon, bringing direct competition pressure to Trader Joe.
3.3.2 Arbitrum
Arbitrum is the fastest-growing L2 ecosystem in the past year, second only to BNBchain and Ethereum (excluding Tron) in terms of both TVL and trading volume. A more active ecosystem also means more intense competition. There are many DEX projects on Arbitrum, including Uniswap V3, Curve, and Balancer, which have been cross-chain deployed early, as well as native DEXs such as Camelot, Chronos, and Ramses.
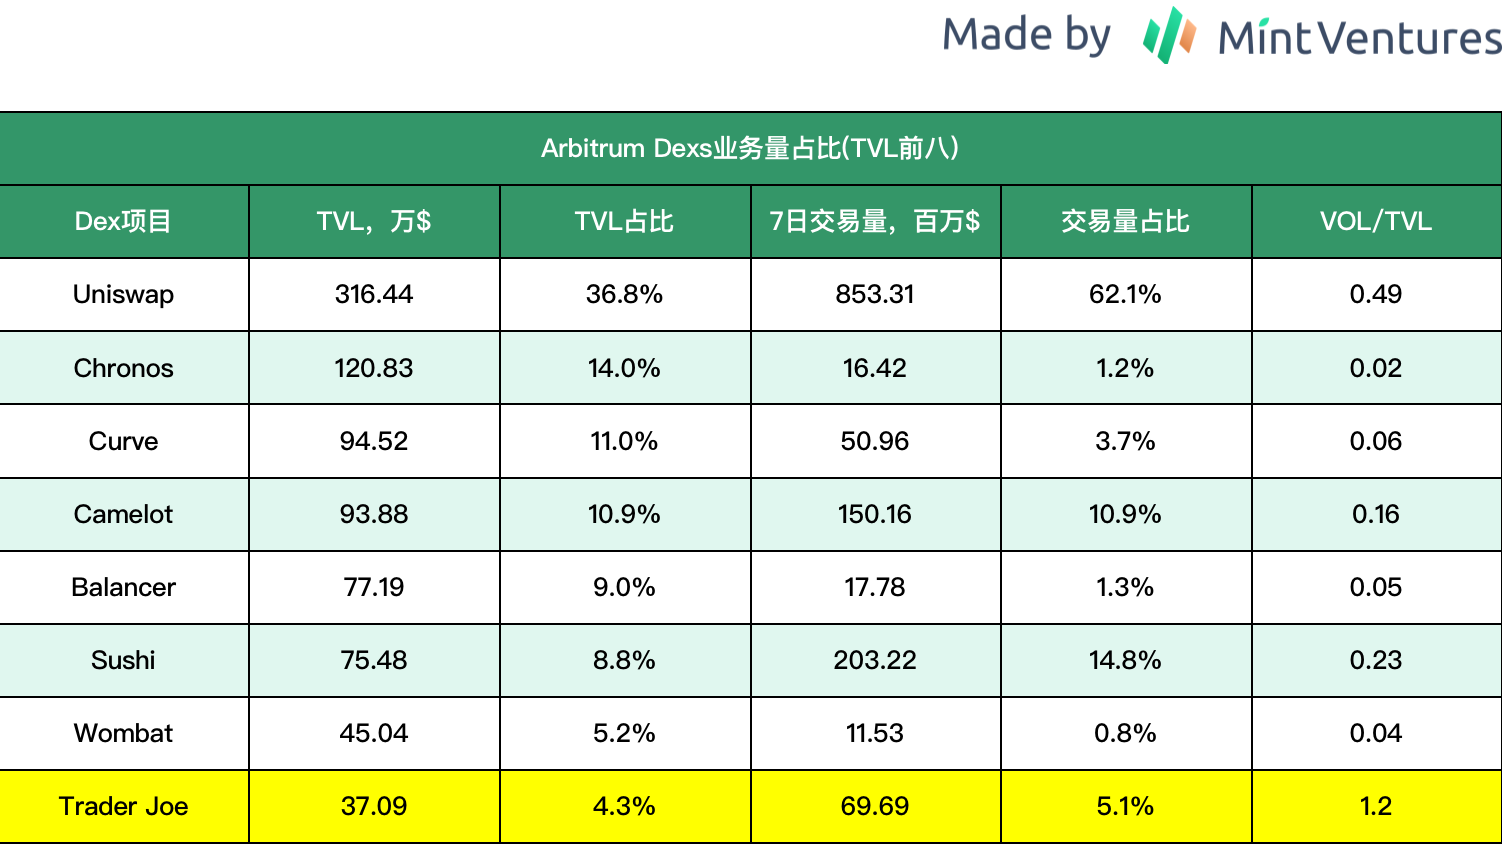
Source: Defillama, PS: The proportion calculation is based on the top 8 total volume statistics time: 2023.5.26
Although Trader Joe’s liquidity on Arbitrum currently ranks low, the following data is worth noting:
1. High capital efficiency (VOL/TVL): the highest among the top eight DEXs, even far higher than Uniswap V3, which also uses centralized liquidity.
2. Apart from Chronos, which was launched in early May, Trader Joe is the only DEX with a significant increase in TVL month-on-month over the past month, and this growth trend has continued for nearly six months.
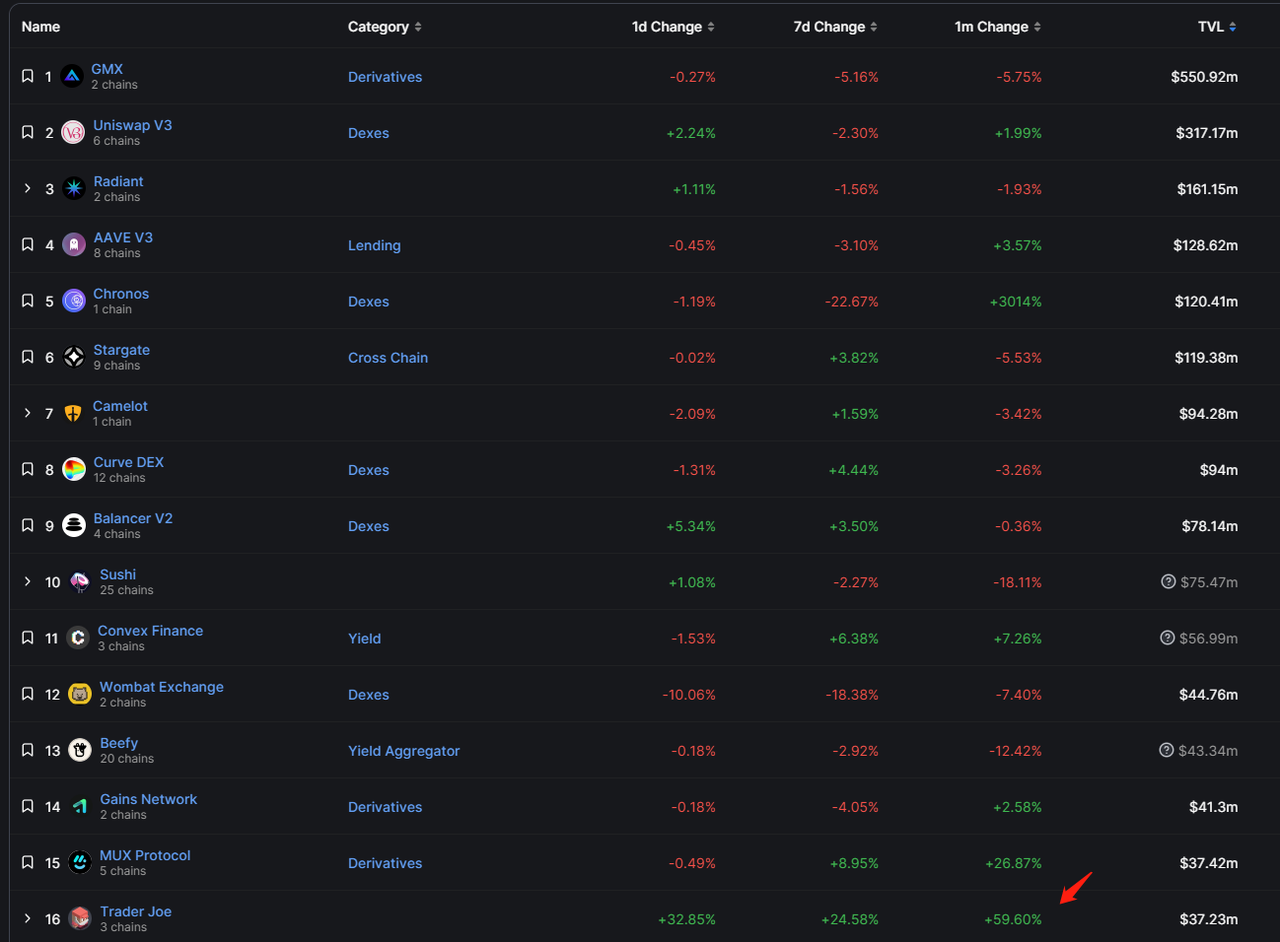
Data source: https://defillama.com/chain/Arbitrum?tvl=true
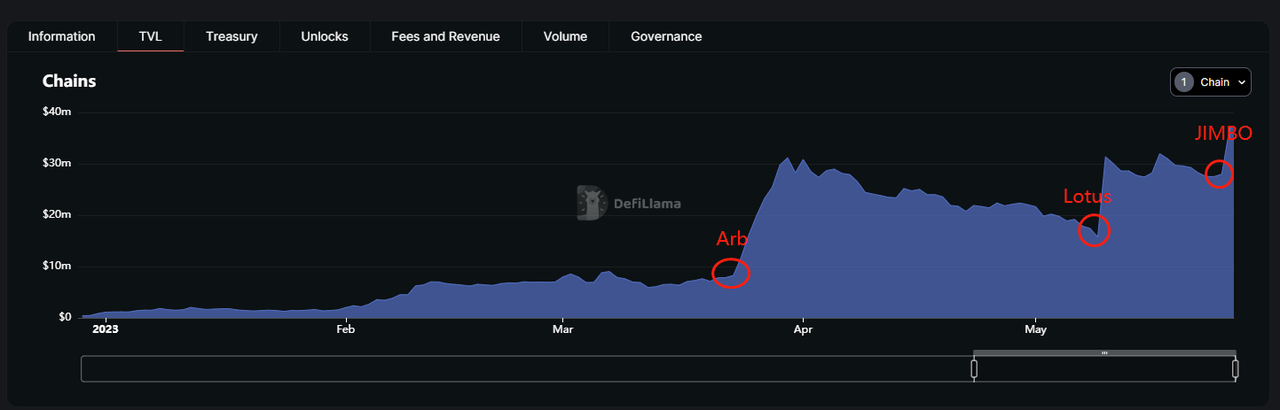
Trader Joe's Arbitrum TVL growth trend, data source: https://defillama.com/protocol/trader-joe
I believe that the driving force behind the growth of Trader Joe’s TVL on Arbitrum is mainly due to:
1. The introduction of the LB mechanism, which is more friendly to LP, gradually increases the volume of liquidity and trading funds, and strengthens each other
2. The emergence of new assets has sparked enthusiasm among users for liquidity provision and trading (see the three red circles in the figure above), and Trader Joe’s LB mechanism has attracted and accommodated this part of the funds and users well
The first point is the basic growth, and the second point is the event-driven factor, which has driven the pulse-like growth of Trader Joe’s LB products.
The three red circles in the figure above are three driving events, which have promoted the rapid increase in Trader Joe’s TVL and trading volume, but the logic behind them is slightly different:
a. ARB airdrop event
The ARB airdrop on March 24 this year created a lot of on-chain trading volume, and the advance expectation of this trading volume also caused many users to participate in the liquidity provision of ARB tokens. The motivation is different, some hope to obtain fee income through liquidity provision, and some hope to sell ARB or buy low through the variant DCA average cost method while obtaining fees through liquidity provision (see the logic in section 2.1.1-C. Liquidity order book scenario). On the one hand, Trade Joe has a more convenient liquidity provision and order product experience than Uni V3, which has introduced more LPs; on the other hand, it has also increased its investment in the Liquidity Book Rewards Program, making the dynamic liquidity funds near the ARB transaction price much denser, greatly reducing the slippage of transactions. This made Trader Joe’s LB Pool briefly have more trading volume than Uniswap V3 on the ARB-ETH trading pair (which in turn increased the LP’s liquidity provision APR).
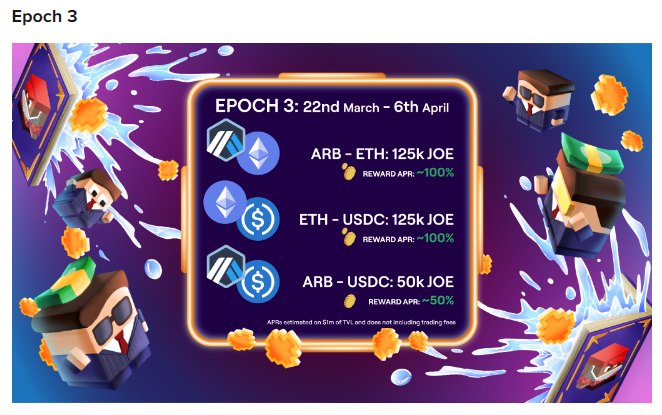
In the week after the ARB airdrop (Epoch3), Trader Joe provided 175,000 JOE token rewards for ARB’s LB liquidity providers
*The Liquidity Book Rewards Program is a dynamic incentive plan for LPs by Trader Joe, which is similar to flexible marketing activities. I will introduce it in detail in the token model section.
b.LOTUS and JIMBO Issuance
LOTUS has been introduced earlier, which is a Ponzi DeFi project based on Trader Joe for token issuance and stable pricing. JIMBO is an improved Fork version of LOTUS (there are two versions, and the one with the highest trading volume in the figure below is V2). On the one hand, these two products have brought huge TVL growth to LB (because the ETH and bottoming funds raised are still left in LB), and on the other hand, they have also created a lot of trading volume and fee income due to the huge price fluctuations in the early stage of token listing. As shown in the figure below, JIMBO’s 24-hour trading volume reached 20 million US dollars on May 25th, and its liquidity reached 16 million US dollars, while LOTUS’s liquidity is still at 13 million US dollars.
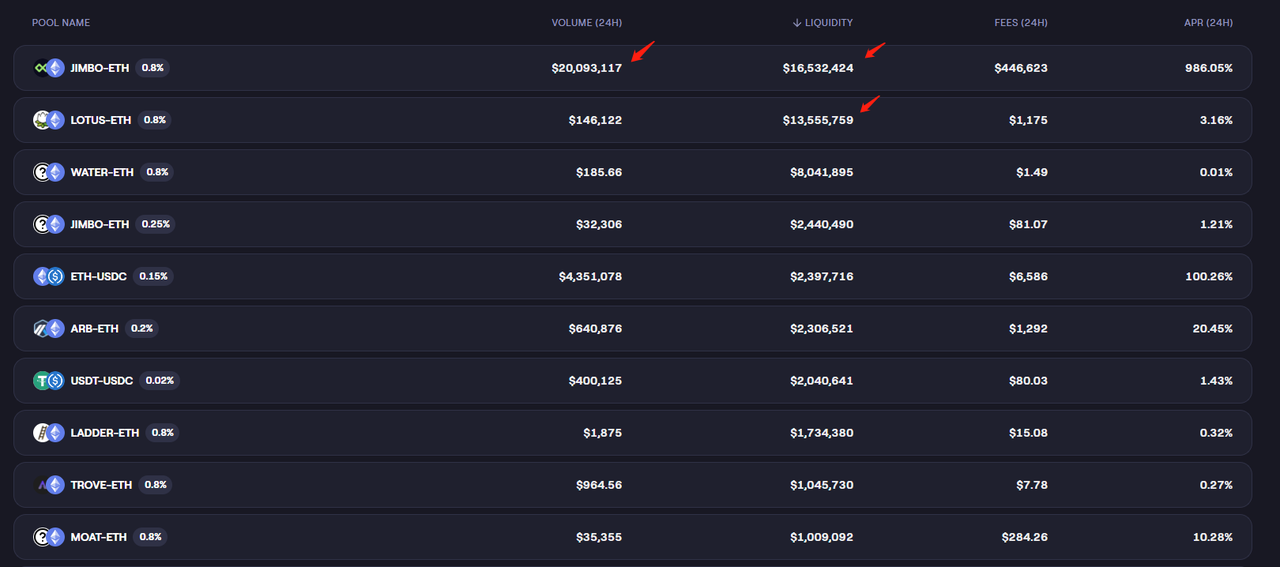
Image source: https://traderjoexyz.com/arbitrum/pool
The Ponzi property of LOTUS and JIMBO may determine the limited life cycle of the project, and the trading volume around these projects is often pulsating and lacks good sustainability.
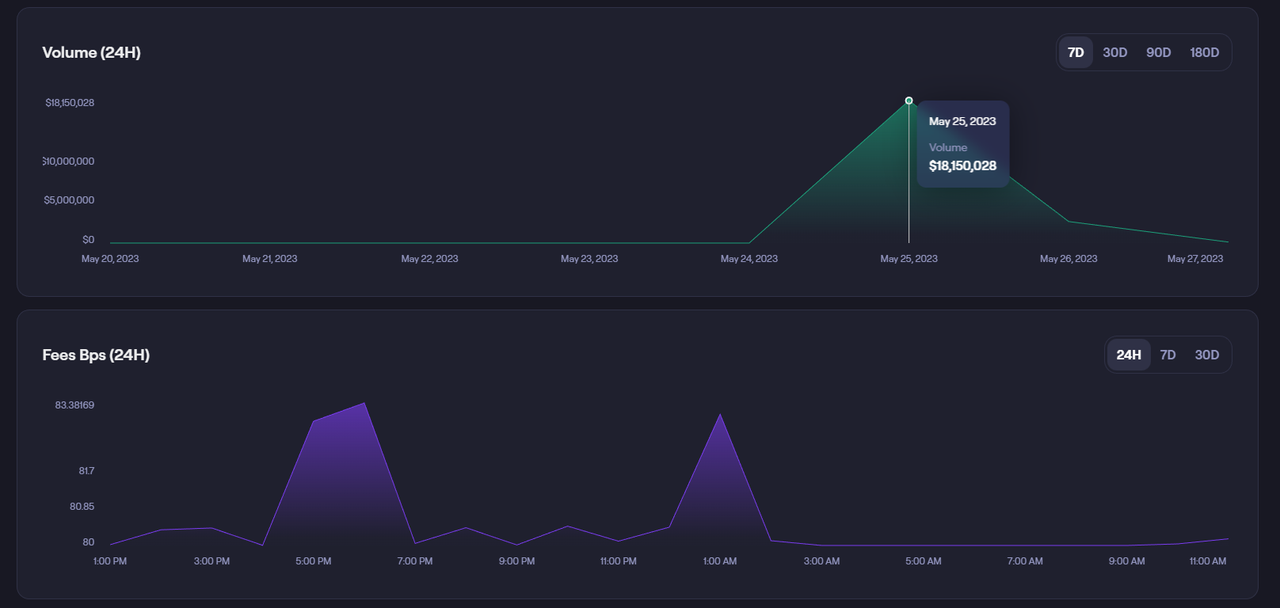
For example, JIMBO V2’s LB Pool had a daily trading volume of 18 million US dollars after the project went online, and it quickly dropped to 2.7 million US dollars the next day.
Nevertheless, their interesting attempts and good fundraising effects based on the LB mechanism of Trader Joe may inspire more projects to build their own liquidity or design more imaginative gameplay based on LB, thus bringing more TVL and trading volume to Trader Joe. However, the sustainability of the incremental trading and liquidity created by such new projects still needs to be observed.
3.4 Token Model Analysis
3.4.1 Total Amount, Allocation, and Release Speed of Tokens
Trader Joe’s token is JOE, with a total upper limit of 500 million and a 30-month unlocking period. The JOE token distribution ratio is as follows:
|
Allocation Object and Purpose |
Proportion |
|---|---|
|
Liquidity Incentive |
50% |
|
Community Treasury |
20% |
|
Development Team |
20% |
|
Strategic Investors |
10% |
According to the official unlocking conditions, as of May 27th this year, the unlocked token quantity of the total 500 million tokens should be around 488 million pieces:
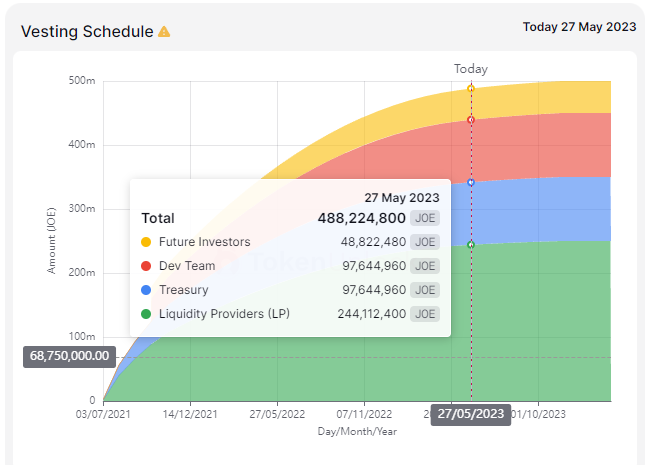
Data source: https://token.unlocks.app/joe
However, according to the official data on circulating supply, the actual circulating token quantity is about 340 million pieces, and other unlocked but uncirculated JOE tokens are mostly in the staking state.
It is worth mentioning that unlike most other DEX or DeFi projects that still maintain high incentive emissions, Trader Joe’s normal liquidity incentive emission amount is already very low, and currently only emits 850 JOE tokens per day (worth about $300), which is close to zero. After deducting the tiny emission incentive, Trader Joe has achieved positive profits for five consecutive weeks.
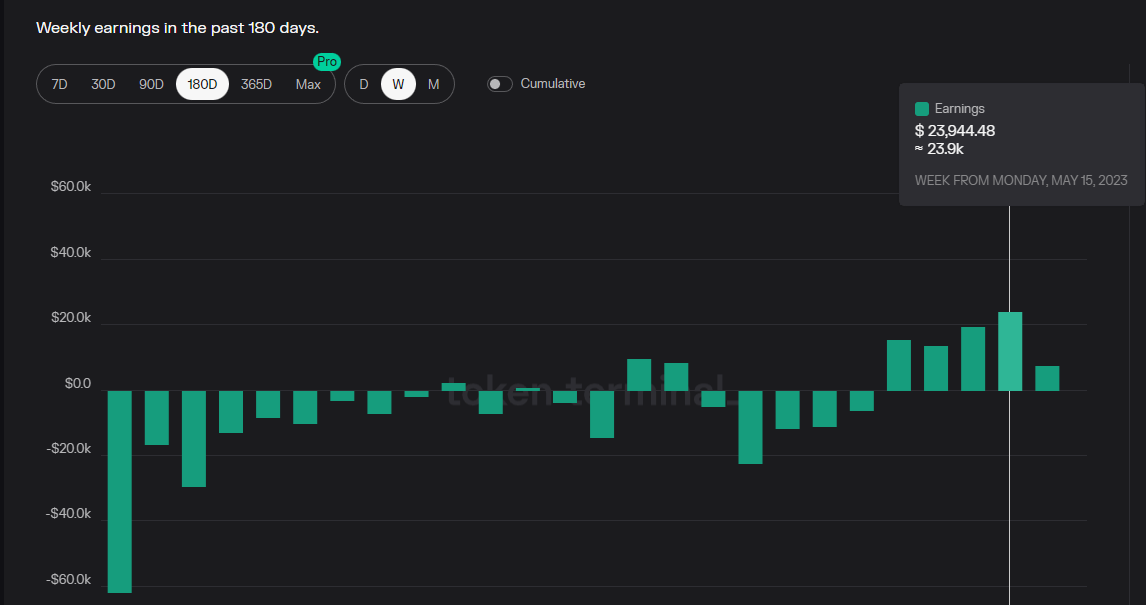
Trader Joe profit chart, source: https://tokenterminal.com/terminal/projects/trader-joe
This does not mean that Trader Joe no longer incentivizes liquidity, but the team has adopted a phased, short-cycle, and flexible incentive method around the LB mechanism, namely the “Liquidity Book Rewards Program”, which incentivizes LPs who provide liquidity in specific LB pools (such as during the ARB airdrop period, the incentivized pools are ARB-ETH and ARB-USDC). Unlike conventional liquidity incentive schemes, this program has the following characteristics:
-
Adopting a point PK system, the calculation object of the points is not liquidity or trading volume, but the “market-making fees obtained by LP during the activity period”, which means that in order to obtain rewards, LPs need to provide sufficient liquidity while timely and dynamically adjusting the liquidity range, so that their liquidity is in the price range with intensive transactions
-
Not all users can get rewards, users need to ensure that their transaction fees capture more than 1% of the total amount of this pool to participate in the reward distribution
-
The cycle is short, with a week as the activity unit, so that the program can flexibly and continuously adjust according to market changes and hotspots, continuously reducing the “cost-effectiveness” of subsidies
In the author’s view, this is a token incentive scheme that is based on a centralized liquidity mechanism and is relatively well balanced between liquidity and trading volume.
3.4.2 Token Use Cases
The Trader Joe team has explored multiple dimensions of JOE’s use cases, including:
-
Staking dividends: Stake JOE for dividends, withdrawable at any time. The source of dividends is 0.05% of the volume of transactions in V1 AMM and the protocol fee split of V2.1 LB pool. In the early days, the staking certificate for JOE was xJOE, and the dividend token was JOE. Later, it was changed to sJOE, and the dividend asset was USDC. Staking dividends are currently the main staking use case for JOE.
-
Staking acceleration: Stake JOE to obtain veJOE, which can also be withdrawn at any time. veJOE is used to accelerate the mining income of LP in V1 AMM. The number of veJOE depends on two factors: 1. the amount of JOE staked; 2. the cumulative duration of staking veJOE, which refers to the time when JOE staked has not been withdrawn. The longer the time, the more veJOE corresponding to the staked JOE, and the higher the reward acceleration, but once withdrawn, veJOE will be cleared. However, after the decline of V1 AMM, the liquidity rewards for V1 AMM are already very small, and veJOE is basically just a formality.
-
LanuchBlockingd quota: Stake JOE to obtain rJOE, which corresponds to the investment quota for participating in launchBlockingd. However, the rJOE mechanism will be cancelled in January 2023.
-
Participate in governance: Although JOE is the governance token of the project, the governance permissions currently opened by the project are very limited, only limited to voting on which basic tokens are added to LB and which valuation tokens are paired with basic tokens, and even the basic parameters of LB Pool are centrally configured by the team.
In summary, the main use case for JOE tokens at present is staking dividends.
Overall, the design concept of JOE’s token economy model is: 1. Actively empower the token’s economic capabilities, so that it can capture the project’s main business cash flow, or as a participation condition for core functions; 2. Low governance decentralization: the development roadmap and product parameters are still controlled by the team.
Although the team made many attempts at JOE’s economic model and value capture, they ultimately settled on a simple staking dividend model without too much complexity, which may not be a bad thing.
3.5 Risks
In addition to common industry risks such as smart contract security risks, regulation, and sluggish development of encrypted businesses, Trader Joe’s biggest risk comes from the increasingly fierce DEX competition.
On the Avalanche network side, Avalanche’s own ecological growth has already stagnated and shrunk, which directly limits Trader Joe’s trading volume growth. On the other hand, Uniswap V3 will soon be deployed to Avalanche, which may further divert Trader Joe’s trading volume.
On the Arbitrum network side, although Trader Joe’s liquidity and user growth is currently growing rapidly, hidden dangers still exist:
-
Low or zero fees are currently used for LB of many mainstream tokens, and intense competitive environment may limit the platform’s ability to charge and raise fees in the future.
-
Both liquidity and trading volume growth are driven by short-term events or strong Ponzi mechanism projects, and the long-term business retention and growth are in doubt. Especially for trading volume, after the trading volume peak brought by the ARB airdrop, LOTUS, and JIMBO issuance, we quickly observed the decline in trading volume and trading share.
On the BNBchain side, the current business progress is not smooth, and the growth of BNBchain itself is also very slow.
4. Preliminary Valuation
4.1 Five Core Questions
What stage of the business cycle is the project in? Is it in the mature stage or the early to middle stage of development?
The DEX track where Trader Joe is located seems to have become mature, and Trader Joe’s business form and products have also matured.
Does the project have a reliable competitive advantage? Where does this competitive advantage come from?
The DEX track where Trader Joe is located is facing fierce competition, and no DEX currently has a clear competitive advantage, including Trader Joe. However, Trader Joe still has some obvious strengths, including:
1. A team with excellent resilience, delivery, innovation, and operational capabilities;
2. Excellent product experience.
Investors and entrepreneurs alike are eager to participate in a market with strong barriers to entry and natural monopolies, but in reality, such markets are few and far between in the Web3 field. In industries with insufficient barriers, the survival strategy for all teams is to continue to compete for operational efficiency, or "run a marathon at a sprint's pace." This "operational efficiency" not only includes some "big things," such as designing and correcting strategies based on market conditions, innovating core mechanisms and products, but also includes small daily community operations and execution and delivery speed of development work. From what we can see, Trader Joe is a resilient team with very good operational efficiency in the blood bath competition of DEXs.
Is the project's long-term investment logic clear? Does it match the industry's trend?
The DEXs track is still the most fundamental infrastructure in the Web3 business world and the track with the most funds and users. As the industry cycle warms up, the long-term valuation of this track is expected to rebound from its current bottom.
What are the main variable factors in the project's operations? Are these factors easy to quantify and measure?
It is the fierce competition in the DEX market. At the quantitative level, we can track and observe the project's data on liquidity, trading volume, and profit levels to confirm the changes in its market share. At the qualitative level, whether more new projects are issued and liquidity is allocated based on Trader Joe's liquidity bootstrapping is a very important business observation point.
What is the project's management and governance method? What is the level of DAO?
The project has currently only opened very limited governance permissions and is still far from community governance.
4.2 Valuation Level
We use a vertical and horizontal comparative valuation method to observe the current valuation level of Trader Joe, and the comparative valuation indicators used are the cost multiple PF (the cost refers to the total cost generated by transactions) and the income multiple PS (the income refers to protocol revenue). Since DEXs have strong periodicity, the reference value of vertical valuation is not high and is only used for observation, and horizontal valuation comparison is more comparable.
Vertical Valuation Level
The following chart shows the trend of Trader Joe’s circulating market value and cost multiple (PF), and we can find that the valuation level and market value level of Dex, similar to traditional financial brokers, have strong cyclicality.
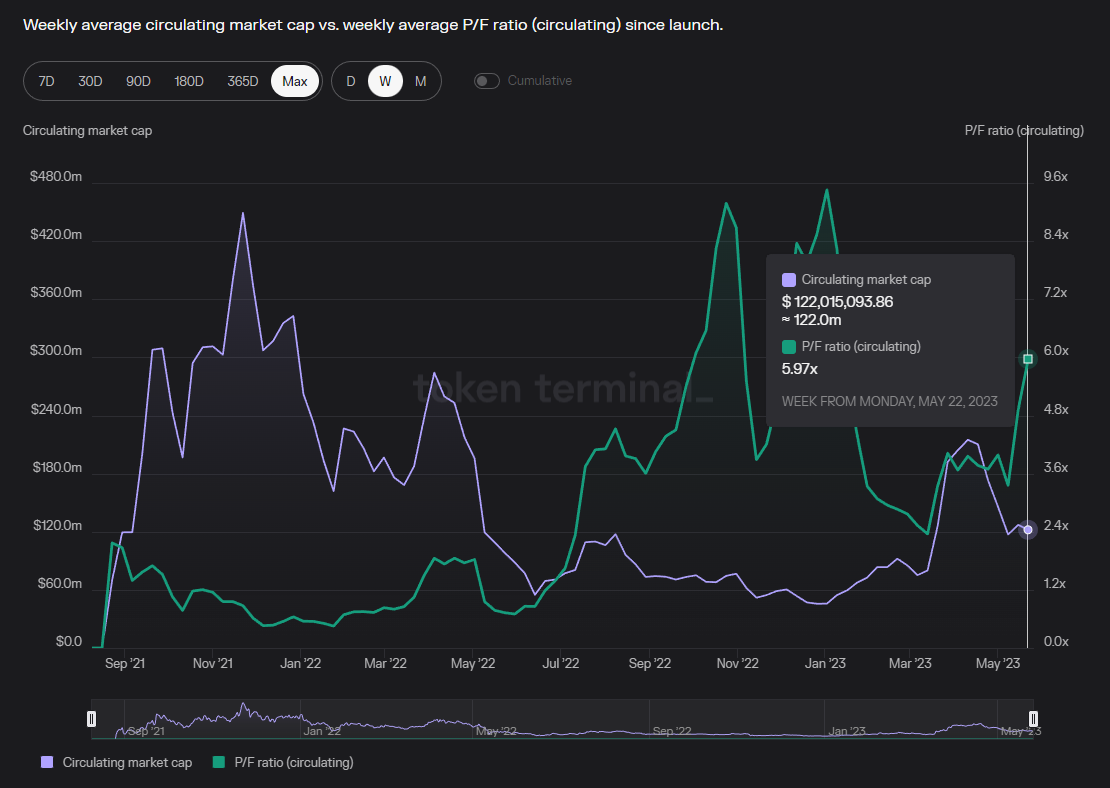
PF value, time span: 2021.8-2023.5, data source: https://tokenterminal.com/terminal/projects/trader-joe
Specifically, in the bull market cycle, the market trading volume is active, and the trading cost rises rapidly. Although the market value is also rising at the same time, the growth rate of trading volume is significantly higher than that of market value, which ultimately manifests as a decrease in PF and PS.
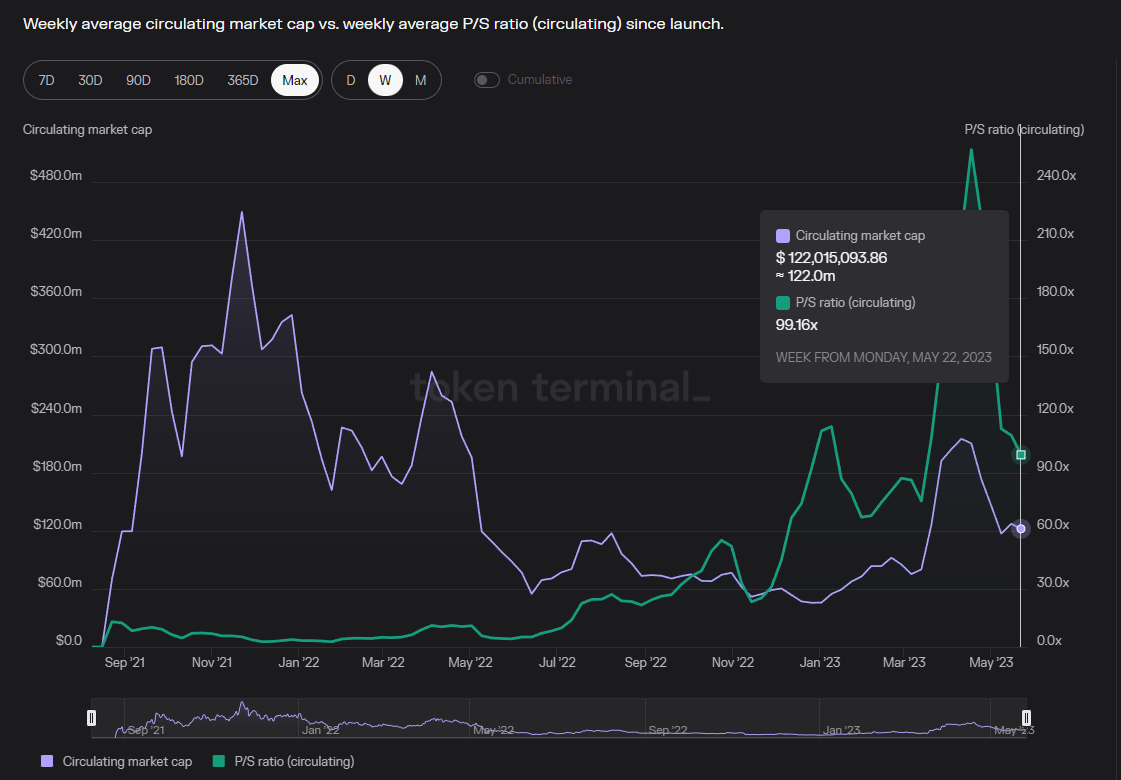
PS value, time span: 2021.8-2023.5, data source: https://tokenterminal.com/terminal/projects/trader-joe
Entering the bear market, the trading volume and protocol income quickly shrink, and although the market value also falls synchronously, the speed of decline is slower than that of income decline, which ultimately manifests as a rapid rise in cost and income multiples.
Horizontal Valuation Comparison
Among many DEXs, we exclude projects such as Curve, Balancer, and Velodrome that engage in liquidity buying and selling businesses outside of trading, and select Uniswap, Blockingncakeswap, Sushiswap, and Quickswap with more similar business models for comparison with Trader Joe.
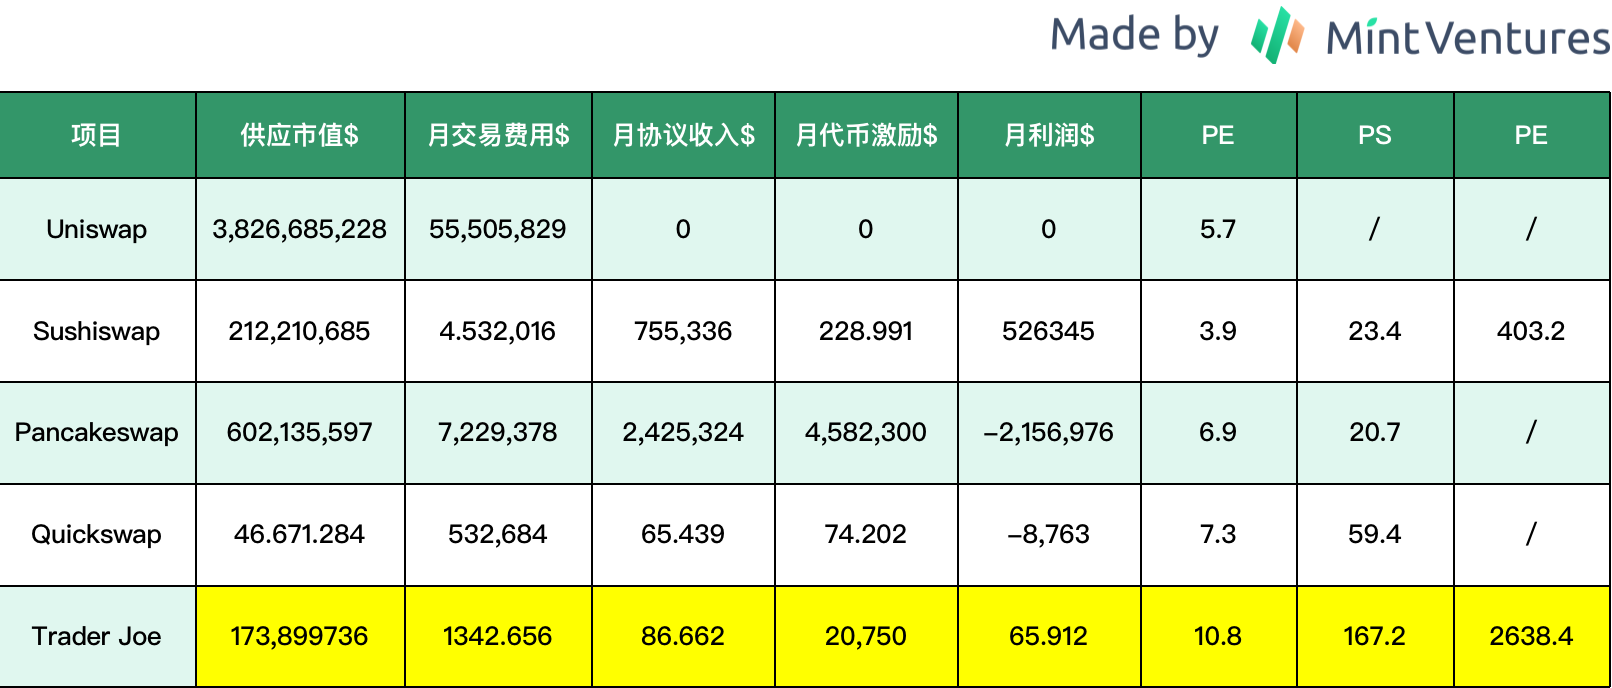
From the comparison of the above data, it can be seen that the market currently gives Joe a relatively high valuation in terms of both cost multiples, income multiples, and profit multiples. This relative valuation premium compared to market peers may come from optimism about Trader Joe’s core team’s resilience and innovation capabilities, or expectations for the future development of the LB mechanism, depending on the observer.
4.3 Summary
Trader Joe’s core advantage lies in its resilient, capable, and innovative core team, good product experience, and innovative liquidity order book, which has led to rapid user growth, with Arbitrum currently being the main engine of its business growth.
However, the fierce competition in the Dexs track continues, which means that no project in the track has strong bargaining power for traders and liquidity providers. Most projects are operating at a loss or thin profit. It is difficult to improve this market competition situation in the short term. However, due to the dual cyclicality of the crypto market and the Dexs track, projects represented by Trader Joe still have the potential to outperform the market.
5. References
Midaswap: Joe V2: A possible glimpse of what “Uniswap V4” should be.
Trader Joe documentation: https://support.traderjoexyz.com/en/
Liquidity Book documentation: https://docs.traderjoexyz.com/
Market cap data: https://www.coingecko.com/
Liquidity and trading volume data: https://www.coingecko.com/, https://defillama.com/home
Token unlock data: https://token.unlocks.app/
Like what you're reading? Subscribe to our top stories.
We will continue to update Gambling Chain; if you have any questions or suggestions, please contact us!
