Since 2023, the Bitcoin market has been showing a continuous growth trend, recently rebounding above $31,000 and consolidating around that price. Bitcoin is currently at the “midpoint” of the 2021-2022 cycle, with several indicators approaching the “re-accumulation period” level of the previous cycle. Although the hype around Inscriptions has cooled down recently, the Bitcoin trading market has become active again.
Summary
-
The Bitcoin price has been consolidating around $30,000, the midpoint of the 2021-2023 cycle, and its price performance from the beginning of the year remains strong.
-
The hype around Inscriptions has noticeably cooled down, and network congestion has begun to ease. However, we can see that Bitcoin trading volume is increasing, currently up 75% from the November low.
-
The Bitcoin price is at the break-even point, which was the “re-accumulation period” that lasted for several months in the previous cycle.
Bitcoin Remains Strong
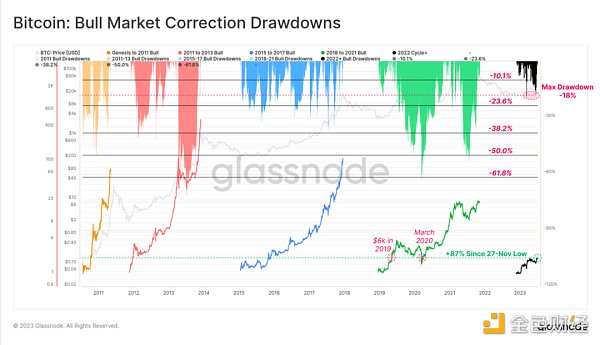
Since 2023, the Bitcoin market has been showing a continuous growth trend, recently rebounding above $31,000 and consolidating around that price. If we assume that the November 2022 low is the bottom of the cycle, we can compare the amplitude of the “pullback” from that time to the present. Next, we will compare this price performance with the previous cycle from the perspective of “high points” and “low points”.
Compared with the high point in 2023, the maximum price drop this year is only -18%, which is very shallow compared to all previous cycles. This may indicate the strong demand for Bitcoin in the current market.
Figure 1: Pullback Amplitude
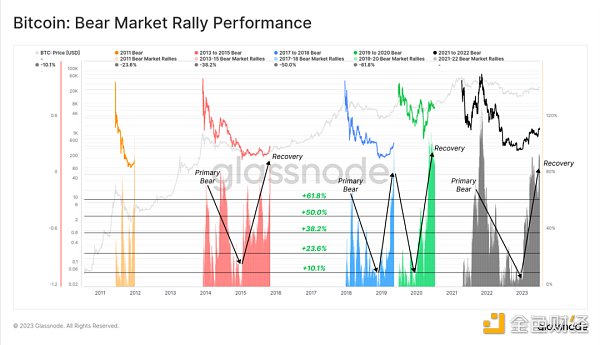
Looking at the low point, the strong rebound since the November low has risen by 91%, which is very similar to the rebound magnitude of the previous cycle.
Except for 2019, all previous cycles that have experienced similar bottoming rebounds have actually been the starting point of a new cycle’s upward trend.
Figure 2: Rebound Performance
Inscriptions Slowing Down, Bitcoin Reheating
One of the most surprising events in 2023 was the appearance of Ordinals and Inscriptions on Bitcoin. This brought about two different Inscription trends:
-
The first is mainly image-based Inscriptions, which has given rise to NFTs on the Bitcoin ecosystem. So far, a total of 1.08 million images have been engraved;
-
The second is mainly text-based Inscriptions related to “BRC-20” Tokens. Bitcoin currently has 14.8 million text-based Inscriptions.
In terms of the number of Inscriptions, the second type has a larger magnitude, but its activity has been declining steadily since May. This week, text-based Inscriptions have seen a brief rebound, and the number of unconfirmed transactions in the Bitcoin memory pool has also started to decrease.
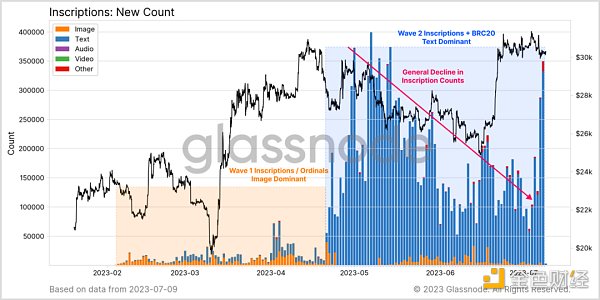
Figure 3: Inscriptions data
At the same time, we have also found a very interesting phenomenon in the on-chain activity indicators. Generally, the upward trend in Bitcoin’s on-chain activity indicators is a signal of usage growth and network health (i.e., an upward trend is usually a good thing).
However, at the same time, a large number of addresses are reused, and the transaction volume related to Inscriptions is also very small (~10k sats), which reduces the block space demand dominated by Inscriptions.
Therefore, we need a more detailed explanation for the high demand for Bitcoin blocks. The summary is shown in the following table:
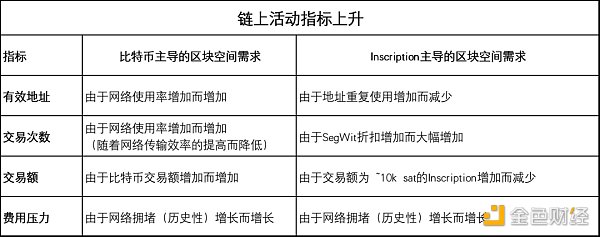
Table 1: The upward trend of on-chain activity indicators
As a result, with the cooling of the Inscriptions trend, the momentum of active Bitcoin addresses has begun to rise again. Some people may think that this is because Bitcoin network activity declined in the previous 2-3 months, but in fact, at that time, Inscriptions traders were using a large number of repeated addresses, and network activity was actually thriving, and block space was also squeezed.
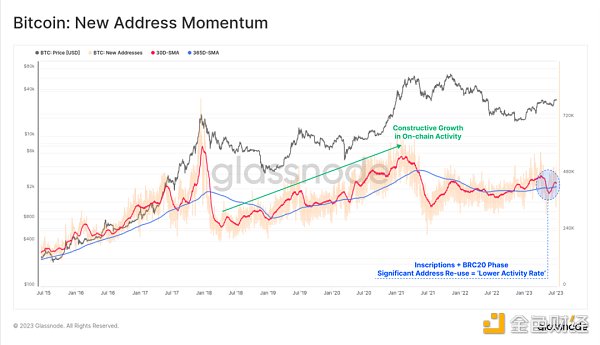
Figure 4: The growth trend of new Bitcoin addresses
Due to the application of SegWit, the number of Bitcoin transactions has also reached a new high. This means that Miners can pack more transaction data in each block, and some blocks are even close to the theoretical limit of 4MB.
In recent weeks, Bitcoin’s daily trading volume has also decreased significantly, consistent with the trend of slowing down Inscriptions activity.
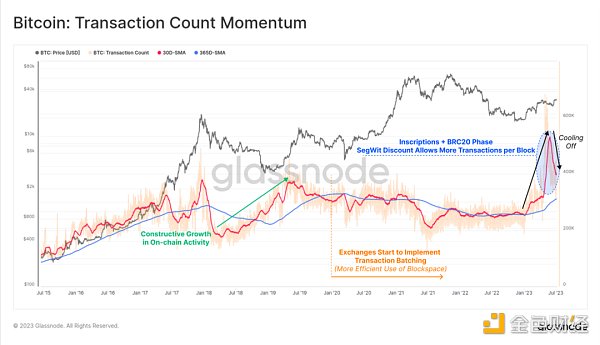
Figure 5: Bitcoin Transaction Activity
After several months of network congestion, the Bitcoin memory pool is slowly clearing out and on-chain transaction fees are also beginning to decline. The average Bitcoin transaction fee, priced in USD, has dropped over 96% since the Brc-20 boom in May, currently sitting at $1.33 with the median fee dropping to $0.16.
Fee indicators indicate that on-chain transaction activity is slowing down across the board.
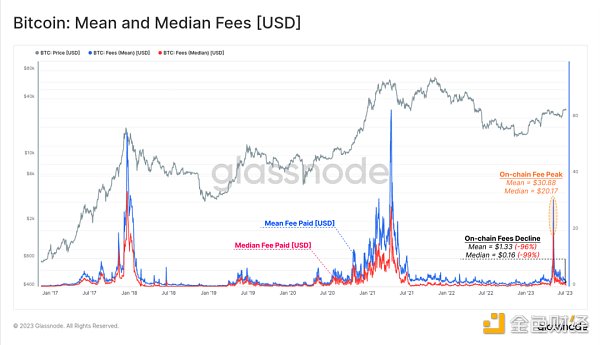
Figure 6: Average and median fees (USD)
As on-chain transaction activity slows down, the amount of BTC being transacted is increasing. The current BTC transaction volume is up 75% from the low point during the FTX meltdown period, with a total settlement amount of $4.2 billion daily.
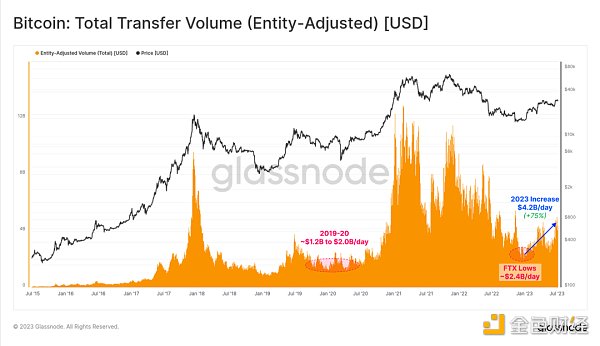
Figure 7: Settlement Amount (USD)
If we only observe the inflow and outflow of trading platforms, we can see that the Bitcoin network is entering a period of vigorous development. The monthly average of trading platform traffic is consistently higher than the annual average, which is a good sign from an asset perspective, showing that more and more people are using Bitcoin.
While some other on-chain activity indicators are cooling down, this indicator is sufficient to indicate that Bitcoin’s dominant position is returning.
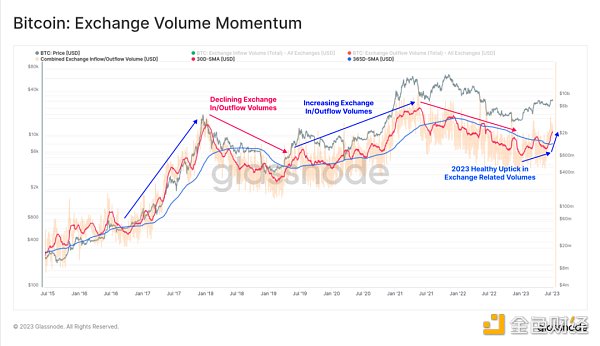
Figure 8: Trading Platform Traffic
From this trading platform-related activity, we can establish an NVT price model. The model aims to provide a “fair value” for a given on-chain transaction volume settlement.
The NVT price model short-term (28-day) “fair value” is $35.9k, which is the first time this price has been higher than spot price since November 2022. The 90-day model also sharply rises, going from the level of $24.7k.
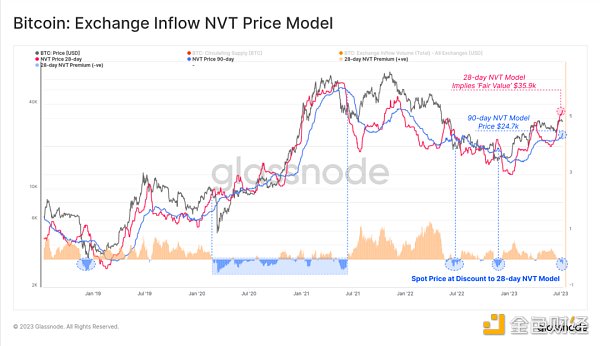
Figure 9: NVT Price Model Inflow
Solid Foundation
Through the above, we have determined that the recovery of the Bitcoin market in 2023 is very strong, both in price performance and network usage. The following chart helps us better understand this, showing the approximate situation of buying Bitcoin at prices below $30,000.
We can see that a significant amount of Bitcoin was purchased between $15,000 and $30,000, indicating a lot of Bitcoin trading activity in the past 12 months. Only 25% of Bitcoin supply was acquired at prices above $30,000, with transactions occurring between 2021-2022.
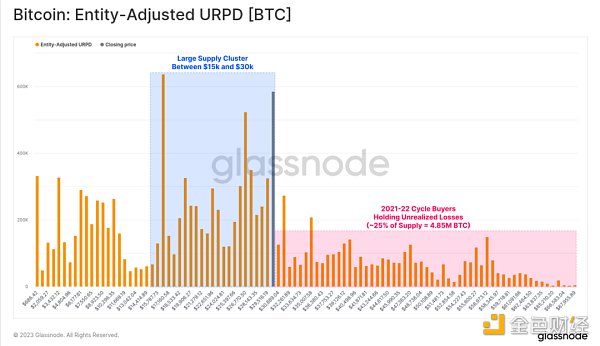
Figure 10: Realized Price Distribution
By introducing long-term and short-term holders into the picture, we can draw the following conclusions from the realized price distribution chart:
-
Blue section: A significant amount of Bitcoin held by long-term holders was purchased between $15,000 and $25,000 (and is therefore profitable), although the price has reached $31,000, it has not yet been sold.
-
Blue section: Almost all Bitcoin purchased at prices above $30,000 is held by long-term holders, who are either survivors of the 2021-2022 bear market, seasoned HODLers, or those preparing to sell when the price rebounds.
-
Red section: Despite the US regulatory crackdown, Bitcoin trades between $20,000 and $30,000 have continued to rise since February.
Overall, the Bitcoin supply distribution is quite stable, and holders’ “basic cost” is relatively low, averaging below $30,000.
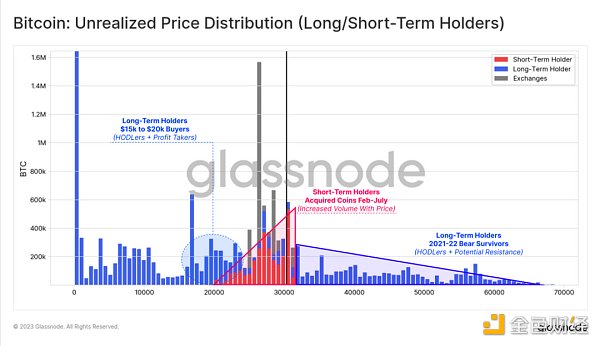
Figure 11: Realized Price Distribution (Long-Term/Short-Term Holders)
According to the figure below, the supply of Bitcoin has recently turned from a “loss” to a “profit” state, with about 2.47 million coins having turned from “loss” to “profit” status during the period when Bitcoin prices adjusted to $25,000, which is about 12.7% of the total supply.
In contrast, the number of “loss” Bitcoins has fallen to 4.79 million, similar to the number in July 2021 ($30,000), July 2020 ($9,200), April 2016 ($6,500), and March 2016 ($425).
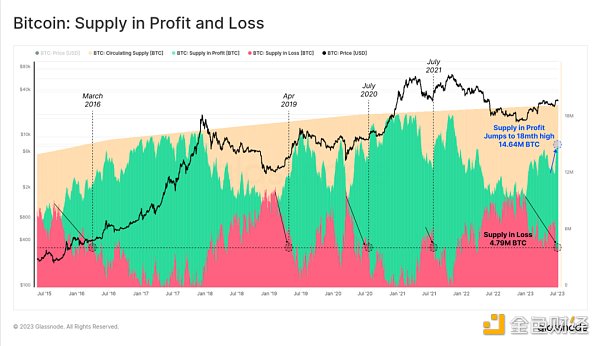
Figure 12: Bitcoins in "Profit" and "Loss" States
History Repeats Itself
Bitcoin’s data always shows amazing similarities in different cycles. The $30,000 price level in the 2021-2022 cycle can be seen as the “midpoint” and fluctuates around that point to some extent.
During the period of 2013-2016, $425 was also a very similar “midpoint” for this period, and $6,500 in 2018-2019 was also. The “loss” supply at these price levels is highly similar.
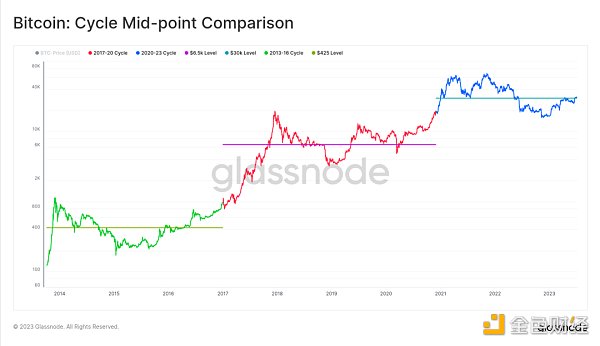
Figure 13: Comparison of Midpoints
As the market price consolidates below the $30,000 “midpoint”, we can see that around 75% of the total Bitcoin supply is in a profitable state, while 25% is in a loss state. This ratio is the same as when the price reached the midpoint in 2016 and 2019.
This 75:25 balance can also be seen as the overall balance point of Bitcoin. On all trading days, 50% of the trading days have a break-even point higher than this point, and 50% of the trading days have a break-even point lower than this point.
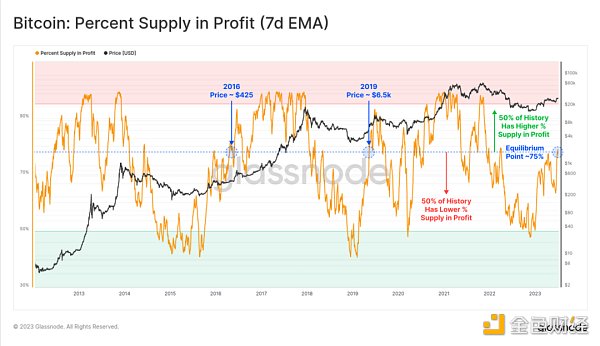
Figure 14: Profitable Supply Percentage (7D)
In history, this balance point will last for a period of time, and many Bitcoin analysts call it the “re-accumulation period”.
We can intuitively understand this by observing the proportion of market capitalization of unrealized losses (the purchase price is higher than the market price, but has not been sold yet). In the early bear market, the market was in a loss and investors gradually withdrew. Subsequently, the market rebounded from the low point, and the profitability sharply recovered to levels similar to today.
The characteristic of the previous “re-accumulation period” was the lack of macro market direction, and it often lasted for several months at this point. Whether breaking this balance point now still requires such a long and tortuous process remains to be seen.
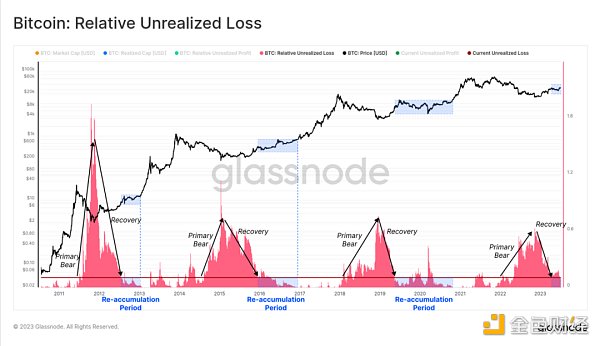
Figure 15: Unrealized Losses
Summary
The Bitcoin price is currently consolidating below the $30,000 “midpoint” of the 2021-2022 cycle, while several indicators have reached the relevant balance points of the “midpoint”. This is the same as the “re-accumulation period” in the previous cycle, which is characterized by almost no macro direction in a few months.
However, the price performance from the beginning of the year to the present is relatively strong, with a maximum drop of only -18%. Bitcoin on-chain activity has declined, mainly due to the decline in the popularity of inscriptions. However, Bitcoin trading volume has begun to rebound, and the liquidity and usage situation is gradually showing a positive trend.
Like what you're reading? Subscribe to our top stories.
We will continue to update Gambling Chain; if you have any questions or suggestions, please contact us!
