With the giants stepping up their entry into Bitcoin, the financial asset properties of Bitcoin are becoming stronger. Although Bitcoin is considered an independent asset with its own price trend, as Bitcoin further becomes an important part of the global financial system, its correlation with traditional assets will inevitably increase.
We explore the correlation between Bitcoin and risk assets (US stocks), safe-haven assets (US bonds and gold), and the global macroeconomic cycle (commodity index) from 2012 to the present, and focus on analyzing the correlation between Bitcoin and other assets after the successful breakthrough and stabilization of Bitcoin’s price above $1,000.
In the early stages, Bitcoin went through a period of exploration and imitation. This was because when Bitcoin first appeared, people did not understand its nature and potential, and the value and use of Bitcoin were not clear in this stage. Mainstream investors and institutions were cautious about it.
However, over time, the decentralized and fixed supply characteristics of Bitcoin have attracted more attention and trust, gradually shaping Bitcoin and eventually gaining mainstream recognition. Especially since 2017, the correlation between Bitcoin’s price and US stocks, US bonds, gold, and commodities has become increasingly strong.
- Is PWA used by friend.tech the best solution to bypass application portals for encrypted apps?
- Tightening of encrypted payment channels Mastercard and Visa suspend some cooperation with Binance
- Aside from the absence of tokens, why does Base Chain not violate US law?
From the stage of exploration and indistinctness to clear positioning and maturity, the evolution process of Bitcoin over the past decade has not only witnessed the curve growth of its price but also witnessed its increasingly prominent position in the global asset market.

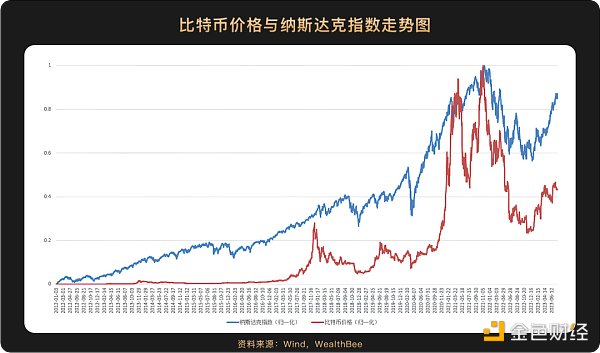
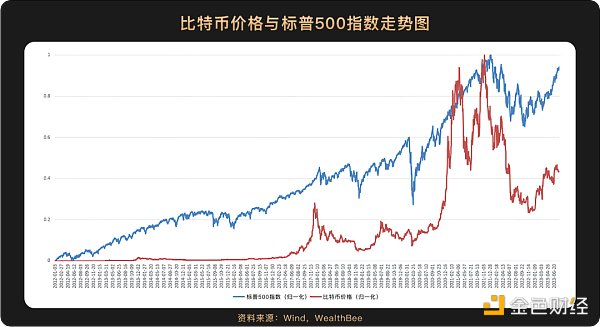
From the graph, it can be clearly seen that the US stock index has a high correlation with the price trend of Bitcoin. Taking the breakthrough of Bitcoin’s price above $1,000 in 2017 as the boundary, the correlation coefficients between Bitcoin and the Nasdaq and S&P 500 before 2017 were 0.6996 and 0.7217 respectively (Pearson correlation coefficient).
The two reached a phase high point near the end of 2017 almost simultaneously, and reached the highest point in the statistical period near the end of 2021 almost simultaneously, followed by a simultaneous decline and rebound. Since 2017, the correlation coefficients between Bitcoin and the Nasdaq and S&P 500 have been 0.8528 and 0.8787 respectively (Pearson correlation coefficient). A comparison between the two reveals that the correlation between Bitcoin and US stocks has gradually strengthened. The correlation coefficients have been greater than 0.8 since 2017, falling into the strong correlation category.

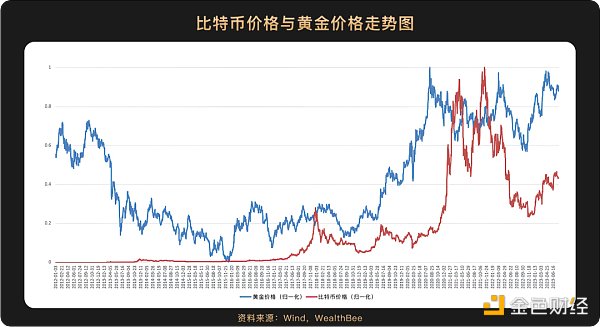
We choose London spot gold (XAU) as the anchor for analyzing the trend of gold prices. Gold is a typical safe-haven asset. From the graph, we can see that before 2016, the gold price was gradually decreasing while the Bitcoin price was slowly increasing. Then the two trends showed convergence, and both reached a phase high point in 2018. In August 2020, the gold price reached its highest point and then fell back, but the Bitcoin price quickly rose afterwards, entering a bull market. The peak of the Bitcoin price coincided with the periodic low point of the gold price in 2021. However, after November 2022, both of them rebounded from the bottom at the same time, showing consistency in their trends.
Similarly, we choose 2017 as a watershed. Before 2017, the correlation coefficient between the two was -0.6202, indicating a clear negative correlation trend. After 2017, the correlation coefficient between the two was 0.6889 (Pearson correlation coefficient), indicating a moderate linear correlation.

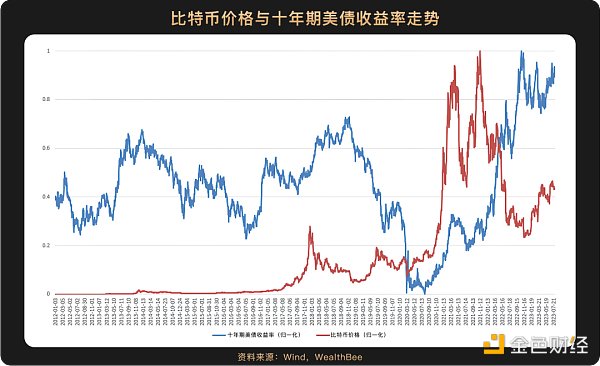
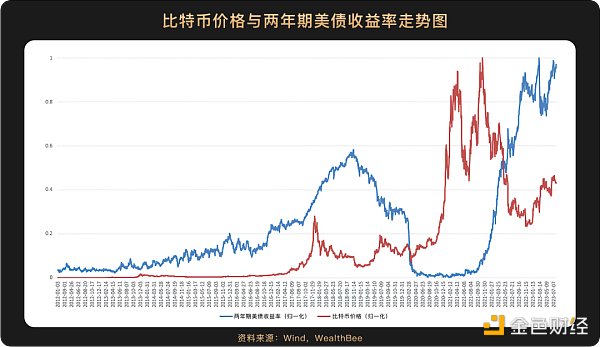
We have selected the most representative 10-year and 2-year US Treasury bonds, which are approximately considered to represent long-term risk-free interest rates and short to medium-term risk-free interest rates, respectively. US Treasury bonds, like gold, are typical safe-haven assets. From the graphs, both the 10-year and 2-year yields show a poor correlation with the bitcoin price. Especially for the 2-year US Treasury bond, the yields were extremely low in 2020 and 2021, while the bitcoin price continued to rise. The correlation coefficients between bitcoin and the 10-year and 2-year US Treasury bonds after 2017 were -0.1382 and -0.1756 (Pearson correlation coefficient), indicating a low correlation, and both showed a negative correlation.

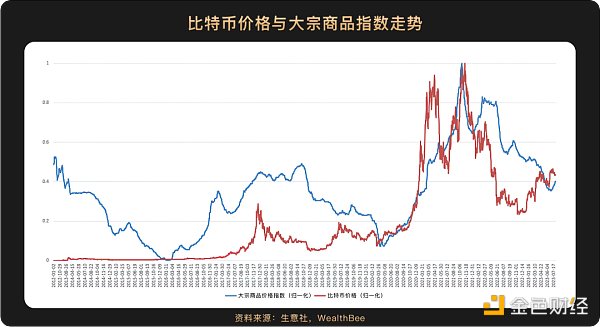
Commodity prices are influenced by many factors but can generally reflect the global macroeconomic cycle. From the graphs, the correlation between the two is high. Both prices continued to rise after the rebound in the first half of 2020 and reached their highest points almost simultaneously in November 2021, before starting to decline in sync. The correlation coefficient between the two after 2017 was 0.7184 (Pearson correlation coefficient), indicating a moderate to high correlation.

Based on the above calculations and analysis, after 2017, the ranking of bitcoin’s correlation with other assets is “US stocks > commodities > gold > US Treasury bonds”. It has a high correlation with risk assets and the macroeconomy, but a low correlation with safe-haven assets. Therefore, we can consider bitcoin as a risk asset.
Fundamentally, the price movement of a financial product is influenced by two factors: fundamental changes and market risk appetite. When the global economy is improving, that is, when commodity prices are rising, market risk appetite naturally increases, and bitcoin, like other risk assets such as US stocks, also rises. Recently, the US economy has remained strong, and with the widespread application of AI models, it will become the main driving force for productivity improvement in the next 10 to 20 years. With productivity improvement, interest rate cuts are also easier to accommodate more liquidity. Therefore, we have reason to believe that global investors’ risk appetite will gradually increase, and there will be more investment funds flowing into the market, which will likely lead to a performance of the bitcoin price.
Like what you're reading? Subscribe to our top stories.
We will continue to update Gambling Chain; if you have any questions or suggestions, please contact us!
