Web3 is a dynamic ecosystem where its founders, token holders, developers and users come together to create a decentralized Internet that truly belongs to users. In just a few years, Web3 has grown from simple infrastructure and vision to a variety of innovative use cases, covering everything from finance, arts, and supply chain management (such as automated asset management, parametric insurance, and real estate tokens). vertical field.
This article begins by exploring why Web3 metrics are changing, and what value creating more robust metrics will bring to the Web3 ecosystem. Afterwards, the article will explain various Web metrics in detail, which are used to measure the adoption of protocols, compare the growth trends of various developer communities, analyze user usage, and estimate the value that Web3 can achieve. These new metrics come as the Web3 economy becomes more connected to the real world.
focus
- On current trends, Web3 users will reach one billion by 2031.
- The value generated by Web3 systems is expected to reach $827 trillion.
- Crypto user fees and realized transaction value (TVE) are gradually becoming new metrics that can give us deeper insights into the Web3 ecosystem.
How are Web3 metrics changing?
It is true that existing Web3 metrics can effectively track ecological growth, but ecosystem members may rely too much on these indicators. Since the market will motivate project parties based on indicators such as total lock-up volume (TVL), project parties will pay more attention to such indicators instead of focusing on product-market fit and landing applications. Therefore, we need to establish a more robust set of metrics, such as dApp revenue, daily active users, and transaction value realized (TVE), which can better measure the fundamentals of the protocol.
Various innovative metrics have now emerged, allowing us to better observe the dynamic Web3 ecosystem. To cover the development of Web3 in an all-round way, a series of different measurement indicators must be adopted, spanning various dimensions such as investment, developers, users and the overall ecology.
Here are a few megatrends driving changes in Web3 metrics:
- Capital— As the Web3 ecosystem matures and interest rates continue to rise, capital begins to focus on economically sustainable indicators such as revenue, cost-effectiveness, and overall value capture.
- Developers— The emergence of developer tools can better help Web2 developers enter the Web3 ecosystem.
- Users— The development of various expansion solutions is about to reach an inflection point, and transaction fees will be greatly reduced, enough to compete with more Web2 services.
- Ecology – Core Web3 infrastructure such as Chainlink is connecting the Web3 ecosystem to real-world assets.
While the following metrics do not adequately reflect the current state of the Web3 ecosystem, they do outline where it is headed and provide us with a more robust framework for assessing the emerging Web3 economy.
A measure of the economic strength of the protocol
Total Locked Volume (TVL)
The total locked amount represents the dollar value of digital assets locked in a certain protocol. Different from the “number of users” and other metrics usually used to measure application usage and growth rate, TVL measures the total value of assets managed by the protocol, including the huge amount of liquidity contributed by “giant whales” to the protocol.
Yield farming has risen in the DeFi Summer of 2020 and made TVL the main criterion for comparing various Web3 projects. For example, on October 21, 2020, Aave’s TVL was US$899 million. One year later, Aave’s TVL increased to US$18.97 billion.
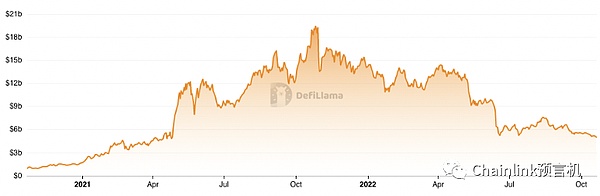
Aave’s TVL Grows Over 20x in DeFi Summer
With the continuous development of Web3, more and more assets in the real world are stored on the chain, and this indicator also effectively reflects the degree of integration of Web3 and the off-chain economy. “Real-world value” represents the total value of all assets stored on-chain in the global economy, including real estate, stablecoins backed by dollars, carbon credits, and commodities.
The World Economic Forum estimates that Web3 systems will leverage $827 trillion in value in the global economy. As Web3 is more and more closely connected with the real world, and Web3 is enhancing the traditional back-end system through a safe and reliable trust-minimized infrastructure, more and more real-world assets will be migrated to the chain in the future, which is more secure It is stored on the chain accurately and applied in DeFi and other dApps.
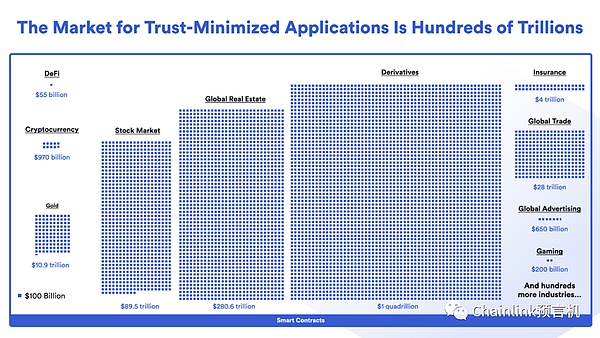
Web3 will realize hundreds of trillions of value on the chain
TVL of Ethereum L2
Ethereum is currently gradually transforming from a single blockchain to a modular system. Previously, all transactions were executed on the underlying blockchain; now, more and more dApps are running on L2 networks such as Arbitrum, Optimism, zkSync, and Starknet. Paying attention to the growth rate of L2 TVL can effectively judge the development and liquidity of the expansion plan of Ethereum.
The total amount locked in the Ethereum L2 network
dApp revenue
dApp revenue refers to user fees earned by a protocol. dApp revenue can be used to measure L1 blockchain, infrastructure services, and dApps.
While dApp revenue is not a critical metric for early Web3 startups and growth projects, many mature projects are now focusing on this metric. Kain Warwick, the founder of Synthetix, once said: “In my opinion, crypto user fees are the key indicator for the next stage.”
dApp revenue is becoming a key measure of the Web3 ecosystem for the following reasons:
- dApp revenue directly reflects end-user demand for Web3 services, and can identify long-term sustainable business use cases.
- The L2 scaling solution introduces extremely low transaction fees and aims to compete with Web2 services, so dApp revenue is a key metric when making comparisons.
- Typically, traditional investors also measure valuations in terms of revenue. A high-income ecology will attract more capital.
- dApp revenue can bring revenue to the underlying blockchain and infrastructure services, so it is a key factor in determining the success or failure of the Web3 ecosystem.
Developer Metrics for Assessing Web3 Productivity
Number of GitHub stars
GitHub users can “star” repositories to bookmark a repository for later use or simply to show support for a project. In addition to star ratings, the number of branches and contributors in the GitHub code base can also effectively reflect the influence of the project.
Bitcoin was the first blockchain to emerge, and its GitHub codebase has the most stars, three times as many as other projects, which speaks volumes about Bitcoin’s reputation. Recently, there have been many other blockchains that have gained a lot of attention as well. For example, the Solana code base has 9,300 stars. The project has developed rapidly in the past year. The number of stars in its code base is currently half that of the Solidity code base (the Solidity code base has 18,100 stars).
The growth of the number of stars in the Web3.js code base is also worthy of attention, because it reflects how many Web3 front-end developers are developing in the ecosystem.
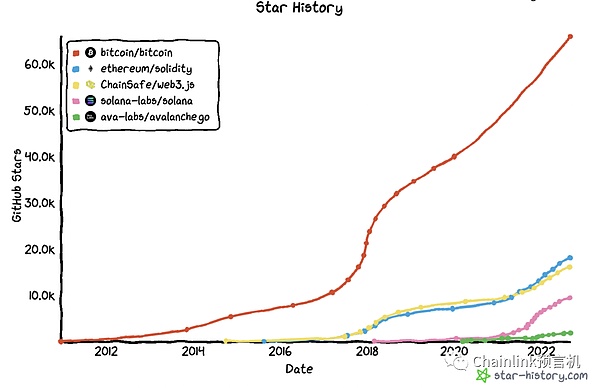
Number of Stars on GitHub Repositories for Bitcoin, Solidity, Web3.js, Solana, and AvalancheGo
Number of active developers per month
The total number of developers refers to the number of programmers actively participating in the development of a blockchain network.
Ethereum was the first smart contract platform and spawned a lot of early innovation and development in the blockchain industry. Ethereum has created a developer community and launched a wealth of development tools and resources to move the ecosystem forward. As can be seen in the figure below, the development trend of Solana is similar to that of Ethereum in the early days.
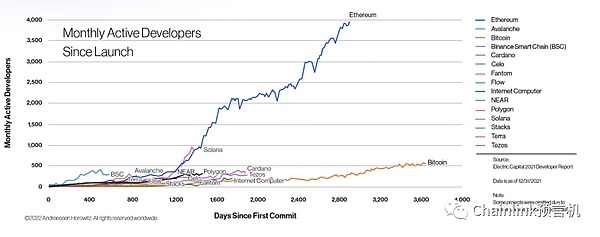
Growth of monthly active developers from December 2020 to December 2021
User metrics to measure usage
Unique on-chain address
Unique on-chain addresses refer to the total number of unique addresses on the blockchain. This is a very important metric because it reflects the network effects that drive the rapid development of Web3 and how many people are empowered by blockchain technology.
Measuring the total number of unique addresses on all blockchains can help us get a general idea of the usage of Web3; comparing the active addresses on different chains can help us to compare and analyze different blockchain ecologies.
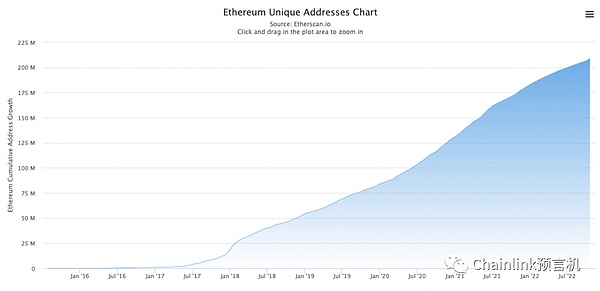
The Growth of Unique Addresses on Ethereum
Alternatively, we can compare unique on-chain addresses to the number of Internet users. Since Web3 is an upgraded version of the Internet, participants can compare the current number of active on-chain addresses with the number of users in the early days of the Internet.
a16z mentioned in a report titled “2022 State of Crypto” that Ethereum is currently expected to have 7-50 million active users. Therefore, the current application level of Web3 is relatively close to that of the Internet in 1995. Judging from this trend, Web3 users will reach one billion by 2031, which is the development level of the Internet in 2005.
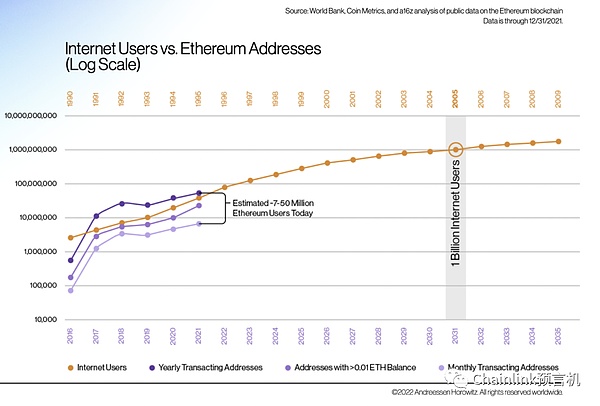
The adoption rate of Web3 is very similar to the early Internet
Daily active users
Daily active users refer to the number of daily active users of an app. Active addresses on the chain can reflect the growth of the entire network, and daily active users can effectively measure the success of an application.
This metric reveals which services are currently being used and allows developers to prioritize, drive, and scale successful use cases.
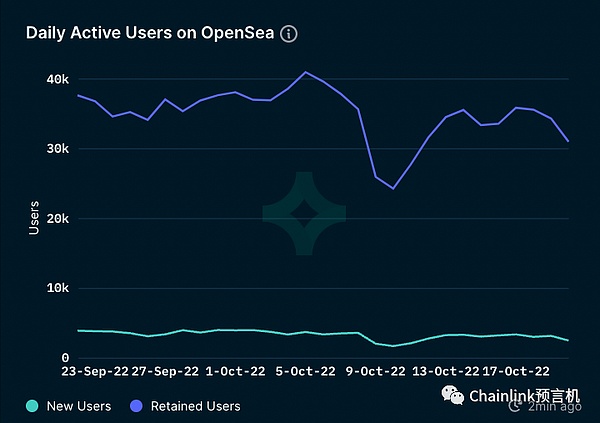
Daily active users of NFT platform OpenSea
Ecological metrics to measure the real-world impact of Web3
Crypto Market Cap
Crypto market value refers to the total value of tokens in the Web3 ecosystem. This is a measure of the overall financial health of the Web3 industry and can be used to tell the difference between bulls and bears. We can take a look at the market value growth of the Web3 industry. The market value of the Web3 industry has grown from $17 billion in early 2017 to $2.9 trillion in November 2021.
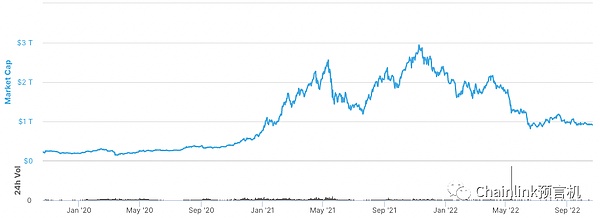
Crypto market capitalization since September 2019
Bitcoin dominance
The bitcoin dominance chart below shows the distribution of crypto market capitalization for each token. Although Bitcoin itself is growing steadily, it can be seen that the entire crypto ecosystem is growing at a faster rate and showing an active trend. As this trend continues, we will also need a very secure, decentralized and reliable protocol for cross-chain interoperability.
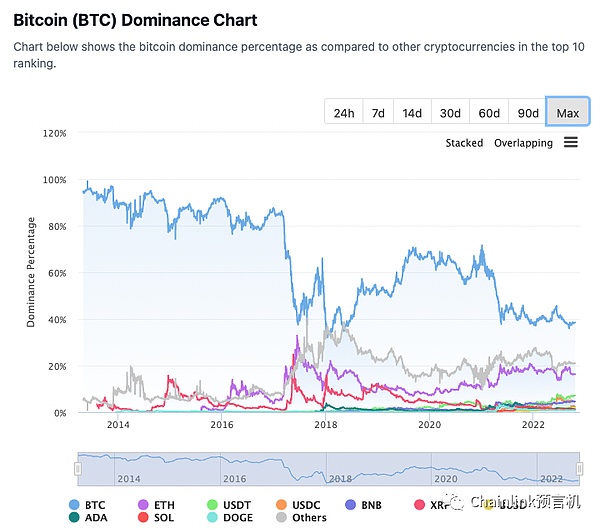
While Bitcoin still has the largest market share, its dominance is slipping
total stablecoin supply
Stablecoin is a crucial on-chain financial primitive that supports the growth of the entire DeFi ecosystem. The token anchored to the fiat currency can allow users on the chain to obtain assets with stable prices, which can be used as a trading medium in the entire Web3 ecosystem and used as collateral for yield farming and other DeFi applications.
Trading volume
Transaction volume refers to the number of transactions concluded at a certain stage. The daily transaction volume of the Ethereum ecosystem has doubled from 500,000 at the beginning of 2020 to 1 million in August 2022.
The market value of crypto can better reflect the financial health of the ecology, while the transaction volume can reflect the scale expansion capability of transaction throughput. As these ecosystems continue to develop, transaction volume on the L2 network will become a key metric.
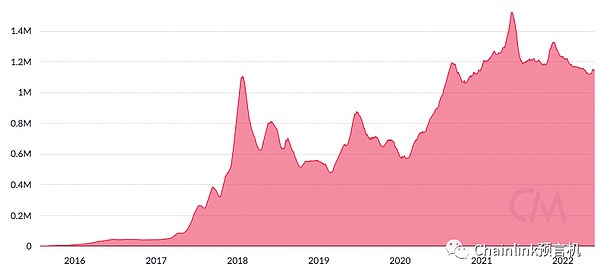
Total Ethereum transaction volume has roughly doubled over the past two years
Total Value of Coverage (TVS)
TVS refers to the total value of US dollar-denominated assets deposited in the market secured by critical infrastructure such as oracles. Chainlink oracles provide data such as price feeds, weather data, sports statistics, and proof of reserves to on-chain smart contracts. For example, as of October 17, 2022, Chainlink Price Feeds secured more than $1 billion worth of stablecoins for Compound, and these amounts were counted into Chainlink’s TVS.
TVS is a key metric because oracle networks can connect to external systems and real-world economies for deterministic blockchain networks while maintaining high levels of trust minimization and security.
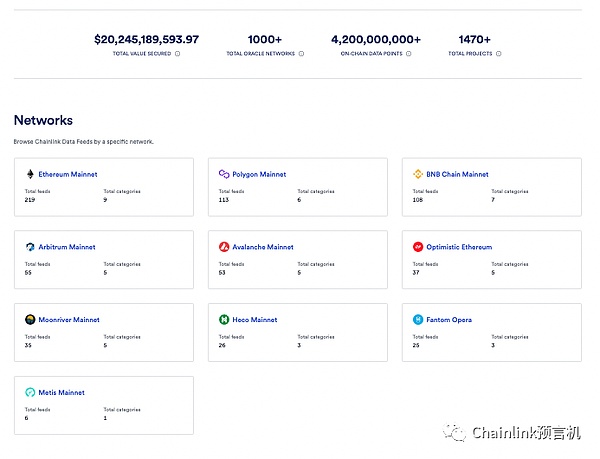
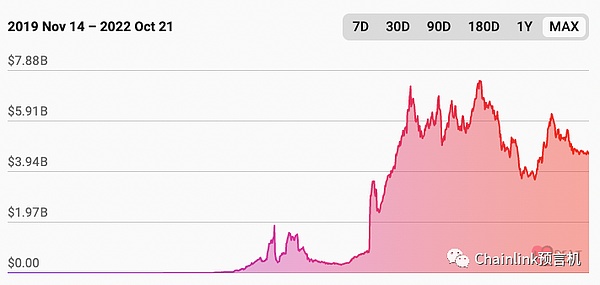
Chainlink’s TVS increased 300% from $7 billion in December 2020 to $20 billion in October 2022
Transaction Value Realized (TVE)
TVE is a Web3 metric that measures the cumulative monetary value of transactions realized by a protocol over a period of time. TVE is calculated by adding up the dollar value of every transaction that passes through the protocol over a certain period of time. For example, if someone borrows $100 worth of ETH on Aave and uses the Chainlink Price Feed to discover the price, then the TVE of the transaction is $100.
TVS can reflect the value guaranteed by key Web3 infrastructure at a certain point in time; while TVE reflects the sum of the value of activities generated during a certain period of time. Ultimately, TVE is an advanced measure that can bring us more insight into the Web3 ecosystem.
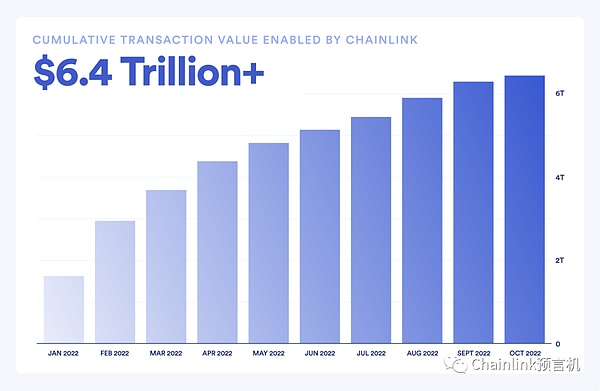
Chainlink’s TVE Breaks $6 Trillion in 2022
Emerging Web3 Economy
As Web3 continues to develop, the project uses various incentive mechanisms to attract developers and activate growth, so as to create next-generation applications, attract more users, and ultimately achieve more value. In this positive cycle, the Web3 ecology can continue to develop. In a broader sense, the development path of Web3 is similar to that of emerging economies. The Web3 industry builds core infrastructure and increases productivity by attracting capital. Now, the entire industry is ready to expand into new markets.
Chainlink’s decentralized oracle network plays a key role in this, connecting smart contracts to the real world safely and smoothly, allowing the Web3 ecosystem to conduct transactions with mature industries in developed markets around the world. As Chainlink’s trust-minimized services continue to cover more of the Web3 economy, Chainlink’s realized transaction value (TVE) will also become a key Web3 metric, giving us a better understanding of the overall impact of Web3 on the world economy.
Like what you're reading? Subscribe to our top stories.
We will continue to update Gambling Chain; if you have any questions or suggestions, please contact us!
