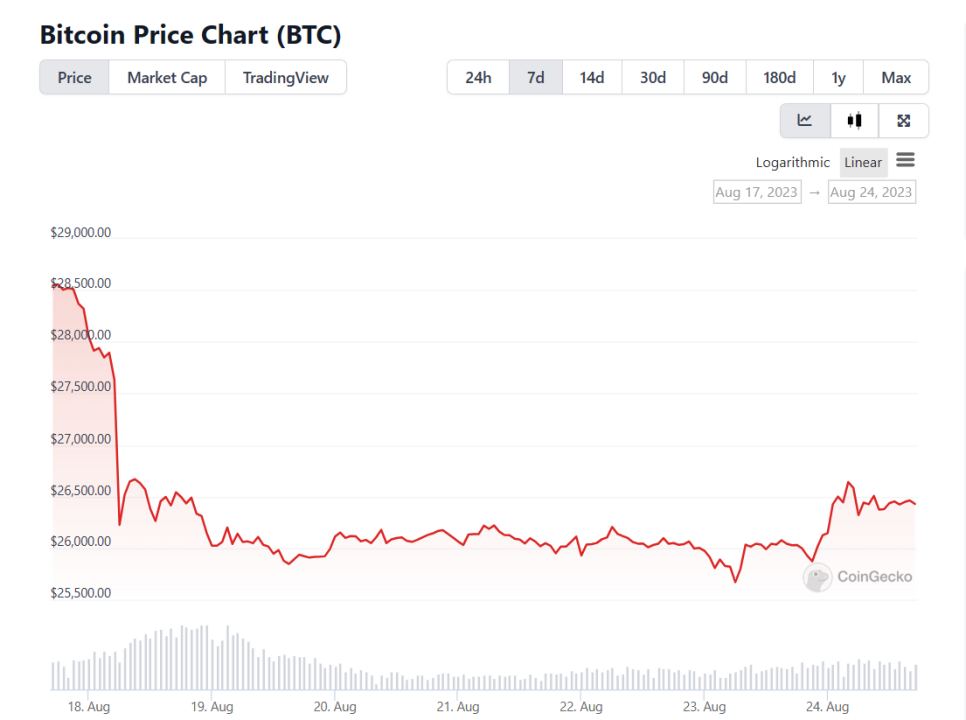
Bitcoin experienced a significant repricing from August 17th to August 18th, dropping by about 10% within a few hours between 4 pm and 6 pm Eastern Time. According to Coinbase’s data, the price of Bitcoin dropped by 8.8% from the opening price on August 17th, reaching a low of $25,244. This drop caused BTCUSD to fall below the 200-day and 200-week moving averages. During and after this event, the open interest in the perpetual futures market decreased by about $2.75 billion, marking the largest Bitcoin deleveraging event since the collapse of FTX in early November 2022.
Many people have started speculating about the reasons behind this sudden plunge in BTC. Some believe that the reason for the drop in Bitcoin’s price is that investors in the market have become skeptical about the future of cryptocurrencies, while others believe that this is just a normal market adjustment. In this article, the veDAO Research Institute will interpret the reasons behind this and make predictions about the market trends based on some data and analysis conclusions.
Reasons for BTC’s decline
Market hot events
- Is the Crypto King back? Alleged Su Zhu wallet address revealed Purchased tokens against the trend and surged over 10 times in half a month.
- Smrti Lab Interpreting the Current Situation and Future of Building the Blockchain Market
- September Outlook for the Cryptocurrency Market Layer2, ETF News, DeFi Airdrops
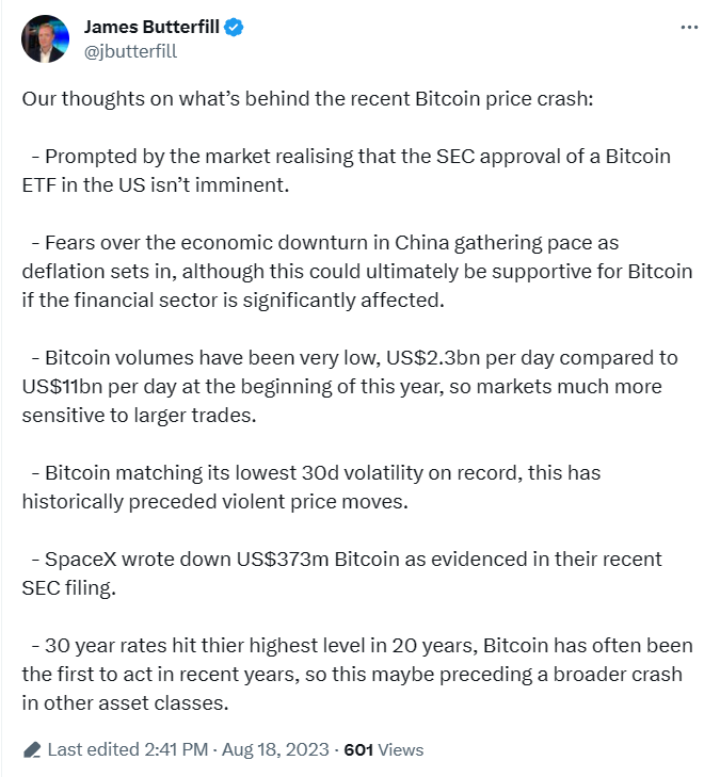
James Butterfill, Research Director at CoinShares, shared his views on the reasons behind this crash on Twitter. He emphasized the market’s adjustment expectations for the approval of Bitcoin ETF by the U.S. Securities and Exchange Commission (SEC), indicating that it is expected not to be approved immediately. At the same time, he also expressed concerns about the decline in the Chinese economy and the potential deflationary effects it may cause. In addition, the significant decrease in Bitcoin’s trading volume makes the market more susceptible to the impact of larger trades. Historical data also shows that Bitcoin’s low volatility usually precedes significant price changes.
Other news affecting BTC include: The Wall Street Journal’s report on August 17th examined SLianGuaiceX’s financial statements, pointing out that SLianGuaiceX has written down a total of $373 million worth of Bitcoin on its balance sheet, indicating that it has seemingly been sold. On the same day, U.S. housing finance institution Freddie Mac released data showing that the average 30-year fixed mortgage rate in the U.S. rose to 7.09%, reaching the highest record since April 2002, which may indicate that a broader range of asset classes will also decline. Essentially, the price of Bitcoin is influenced by various global and market factors, not just these key events.
On-chain data analysis
By observing some key on-chain indicators, it is not difficult to see that the real reason behind this crash comes from the derivatives market, particularly massive liquidations of leveraged positions and long liquidations, ultimately leading to a squeeze on longs.
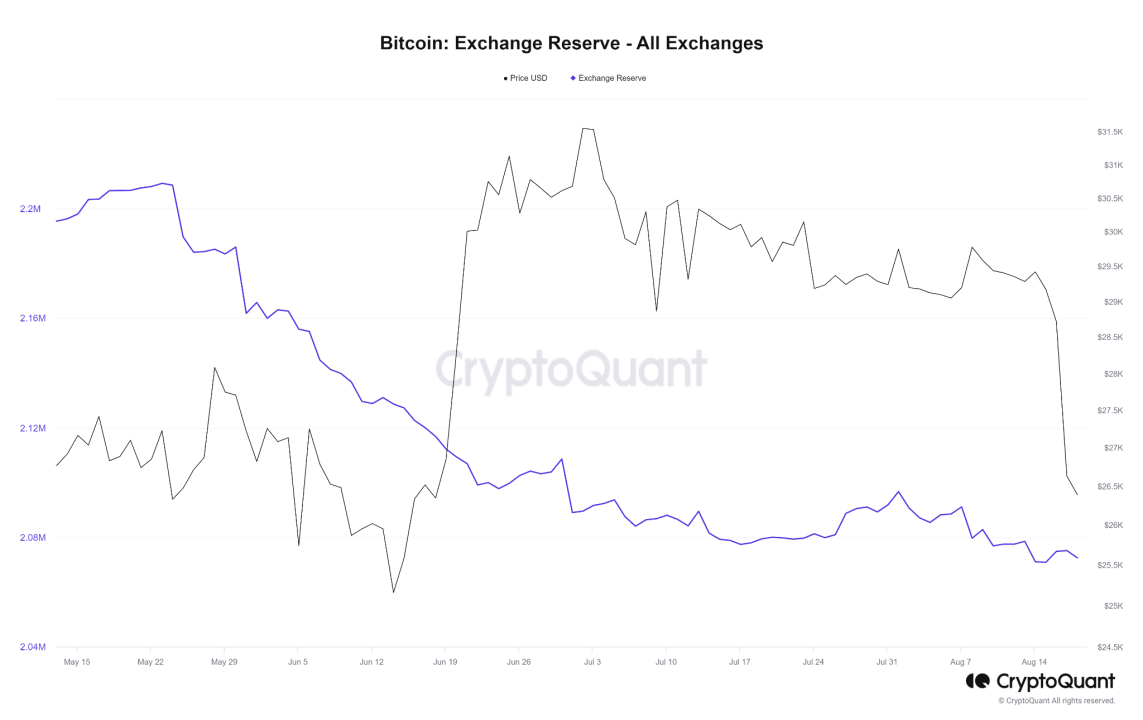
Firstly, by observing the Bitcoin balances held by major exchanges, we can see that there is no significant inflow of funds into exchanges. This means that on-chain holders have not returned their Bitcoin to exchanges for sale, so the selling pressure does not come from this aspect.
But according to the chart of open contracts, we can see a different situation. Open contracts refer to the number of open positions (including long and short positions) on the derivative exchange. There has been a sharp decline here, indicating that many traders have closed their positions. The majority of closed positions are long positions.
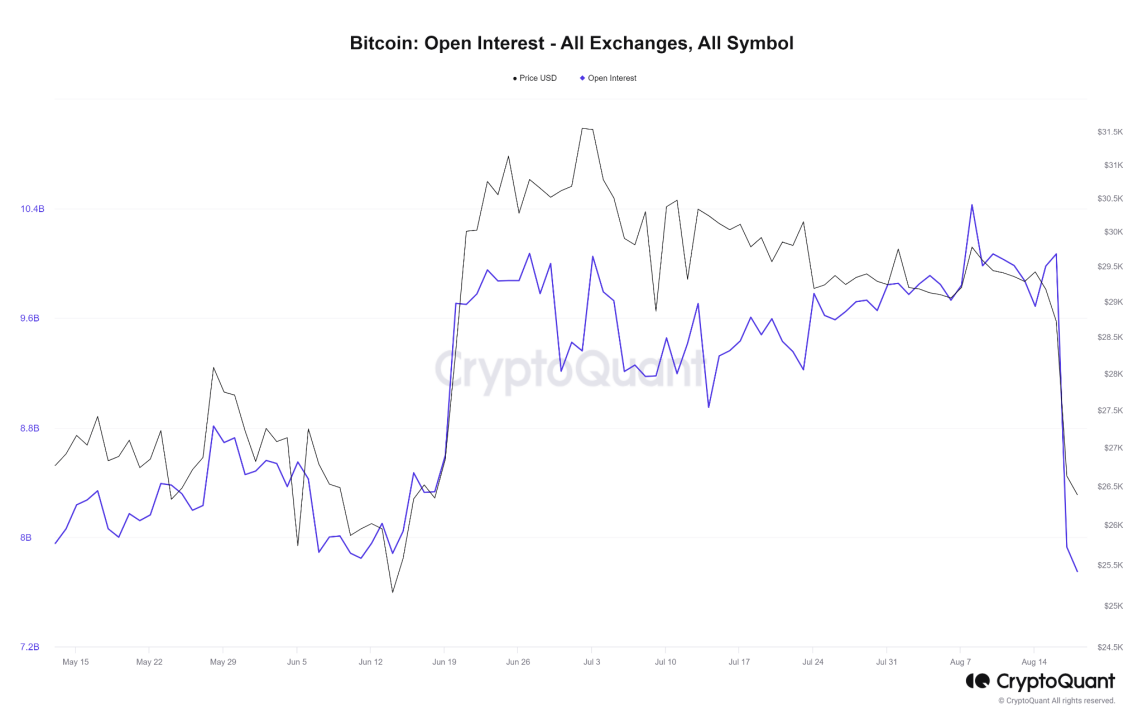
Open contracts
This event marks the highest long position liquidation we have seen this year, with 5,694 contracts liquidated on August 17. The last time we saw such a high number was on November 9 last year, when the number was even slightly higher and the price of Bitcoin dropped by 27%.
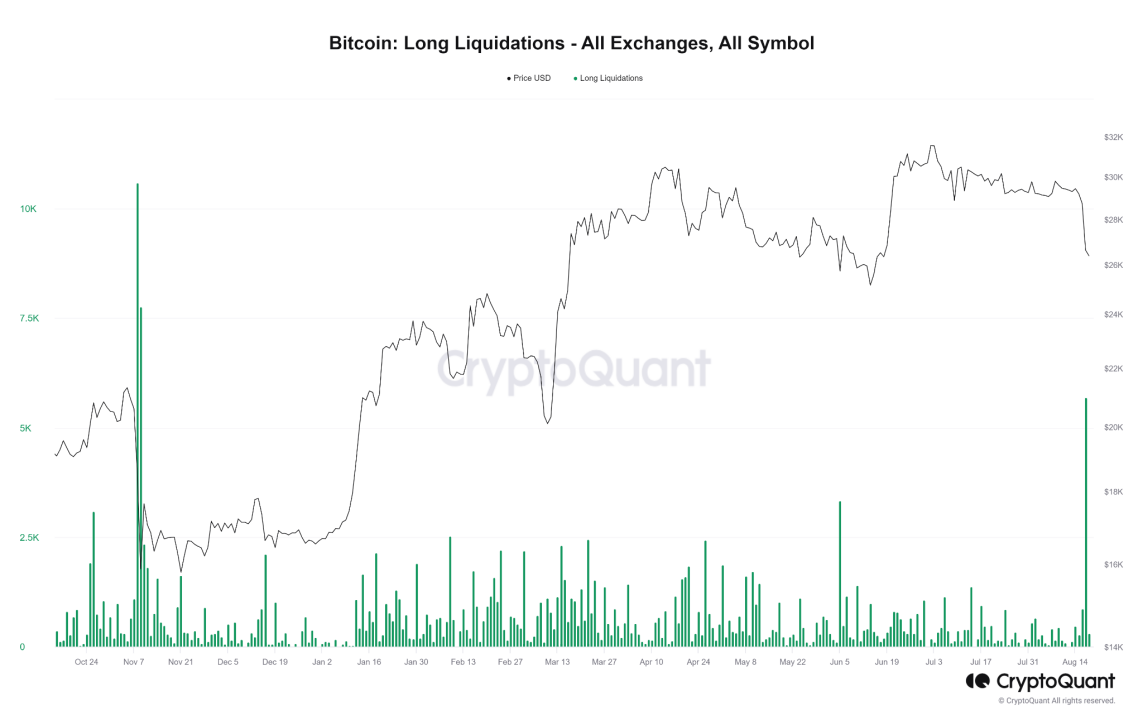
Long position liquidation
As shown in the following chart, in comparison, the number of closed short positions can be considered negligible.
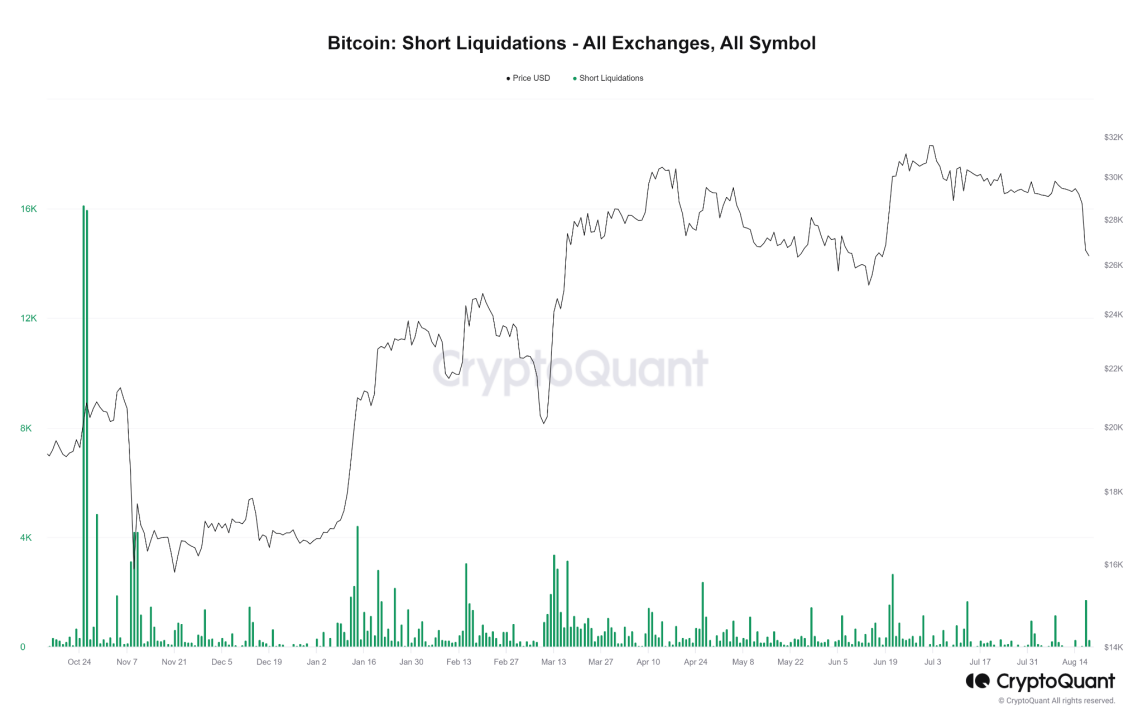
From these charts, we can conclude that long traders have been forced to liquidate their positions, forcing them to sell, resulting in a chain reaction known as a long squeeze.
Price Analysis
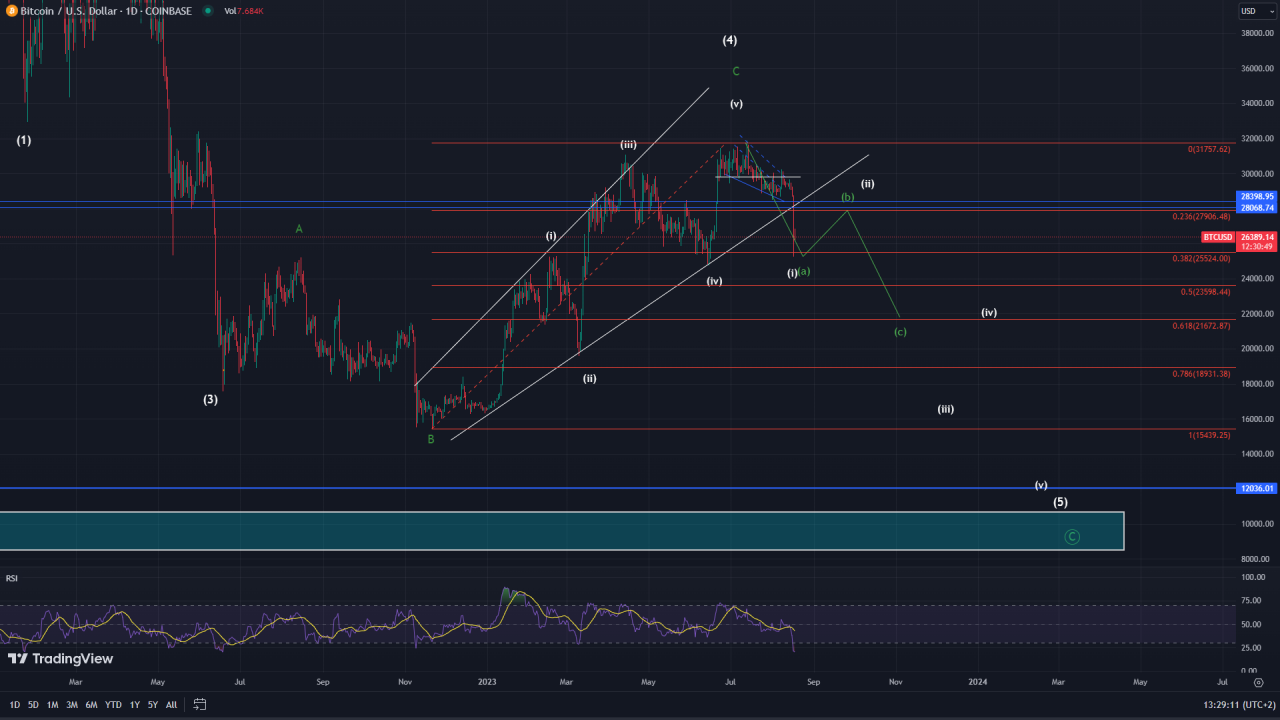
On a macro level, there are two scenarios for the future, but both indicate the same short-term price trend. As shown in the chart, based on Elliott Wave theory, we can view the situation since November 21 last year as a completed five-wave impulse phase. Therefore, we either see a three-wave corrective phase or a larger five-wave trend, which would lead to the final bear market for BTC.
In the short term, it is expected to recover from the current level and most likely return to $28,000. This recovery is either the B wave in a bullish scenario (three-wave correction) or the 2 wave in a bearish scenario (five-wave impulse).
Next, it can be expected that the price will start to rise from the current level, from which we can further validate which scenario will be the dominant one. If the bullish trend is playing out, then the price will move towards the 0.618 Fibonacci retracement level at $21,500. If the price falls below the 0.618 Fibonacci level, it may indicate that we are seeing the third wave in the five-wave impulse phase, and the ultimate target for completing this pattern could be around the next significant support area of $11,000.
Conclusion
Since August 17, the entire BTC market has been declining, but with the occurrence of a sharp decline, a rebound will soon follow. However, due to the market structure indicating the start of a downtrend, this rebound can only push the price up to a certain extent.
From historical data, August and September are usually not favorable for mainstream cryptocurrencies. Nevertheless, during the bull market phase before August, BTC showed considerable resilience. Although history may be similar, there are still changes brought about by the market environment. Factors such as global policy environment, investor confidence, and the application of emerging technologies can all have a significant impact on the value of BTC. When analyzing the trend of Bitcoin, it is still necessary to continue monitoring these key factors in order to more accurately predict the future direction of the market.
Like what you're reading? Subscribe to our top stories.
We will continue to update Gambling Chain; if you have any questions or suggestions, please contact us!
