Author: Ding HAN, CryptoVizArt, Glassnode
-
We compared two on-chain pricing models with the current market situation, both of which are related to past market bottoms and the major crash event in March 2020.
-
The accumulation and distribution patterns often align with local highs and lows, and we demonstrate this in on-chain data.
-
Currently, most short-term holders are in a loss position, and new data shows that this group generally has negative sentiment.
- a16z Founder The Only Important Factor in Entrepreneurship
- Regulation cannot keep up with the pace of the market? New requirements for cryptocurrency listings in New York show signs of fatigue that cannot be fulfilled.
- Fed Paper Tokenization is a New and Rapid Financial Innovation in the Crypto Market
Finding the Market Bottom
The Bitcoin market continues to oscillate around $26,000, failing to sustain above the midpoint level of around $31,400. The two attempts in April and July this year effectively set up a double top pattern for the price. Among the other indicators related to short-term holders that we reported last week, this may indicate an early shift in market sentiment and confidence.
The chart below illustrates the two pricing models:
-
Investor Price ($17,600) reflects the average acquisition price of all coins but excludes the coins obtained by miners (i.e., only coins acquired on the secondary market are counted).
-
Delta Price ($11,100) is a model that combines on-chain pricing and technical pricing and is commonly used to predict market bottoms.
In the two cycles of 2018-19 and 2022-23, the time spent trading within the bottom range predicted by these models was quite similar. It is worth noting that during the chaotic period of the market sell-off in March 2020, the market retested the investor price level.

In addition to the duration between these models, we also measure the contraction and expansion between these pricing models as a criterion for market recovery. As a large amount of capital flows into the market, the gap between these models narrows during market peaks. Conversely, divergence indicates a slowdown in capital inflows, with price decline becoming a driving factor.
 These models help monitor the transition of the market from the depths of a bear market to recovery. Therefore, the current state of the market appears to be similar to the market adjustment stages in 2016 and 2019.

Capital Rotation Cycle
“Realized HODL Ratio” (RHODL) is a market indicator that tracks the wealth balance between recently moved coins (<1 week) and longer-term HODL (1-2 years). In the next chart, we use the 2-year (half cycle) median as a threshold for capital flow regime transitions between bull and bear market structures.
From this indicator, it can be seen that new investor activity in 2023 is not significant, but the RHODL ratio is nearly at the 2-year median. Although the influx of new investors is a positive sign, its momentum is relatively weak.

We can use the cumulative trend score to visually see this mild capital entry. This tool reflects the relative balance changes of active investors in the past 30 days.
From this, we observe that the market recovery in 2023 was driven by a large amount of funds accumulating at a high level above $30,000. This indicates that investors are showing a “panic buying” trend. In contrast, the “market surrender” event in the second half of 2022 saw new investors taking advantage and accumulating at market lows.
 We can use the realized profit and loss indicator to assess the sudden change in investors’ profitability. This indicator calculates the value change of all sold coins, comparing their value at the time of sale to their acquisition value. The following chart shows the sum of realized profits and losses on a weekly basis, normalized by market value for comparison across different periods.
Here, we can see that there are intersection points between these periods of intensive accumulation and profit-taking. Both peaks occurred at market highs in 2023, and there is a similar crossing phenomenon at market highs in January and December 2021.

Holders in a Loss Position
In last week’s analysis, we reviewed a series of indicators to explore the current loss situation of many short-term holders.
In a bear market, when over 97.5% of new investors are in a loss position, selling pressure decreases significantly. Conversely, when over 97.5% of short-term holders are profitable, they tend to sell when the market is balanced or in a profit position.
During the rebound period with prices exceeding $30,000, this indicator reached a state of complete profit saturation for the first time since November 2021. However, after falling below $26,000 in recent weeks, over 97.5% of short-term holders are currently in a loss position, the lowest point since the FTX crash.

With so many short-term holders currently in a loss position, we can use two powerful indicators to analyze their positions:
-
STH-MVRV: This indicator describes the magnitude of unrealized profit/loss for holders and is a key indicator for evaluating selling motivation.
-
STH-SOPR: This indicator describes the magnitude of locked-in realized profit/loss and is an indicator of actual selling pressure.
First, through STH-MVRV, we can evaluate extreme fluctuations of this indicator compared to its 155-day average, including the upper bound (average plus standard deviation) and lower bound (average minus standard deviation).
It can be observed that recent market highs and lows have occurred multiple times outside these boundaries, indicating that investors’ profit and loss ranges are statistically significant.

The analysis of STH-SOPR also shows a similar trend, which highlights that investors have started to take action by taking profits at market highs and selling coins at lows, resulting in significant losses.

We have already identified the correlation between unrealized profitability and STHs’ expenditure (realized profitability). Now, we will explore how to evaluate the trend of this relationship.
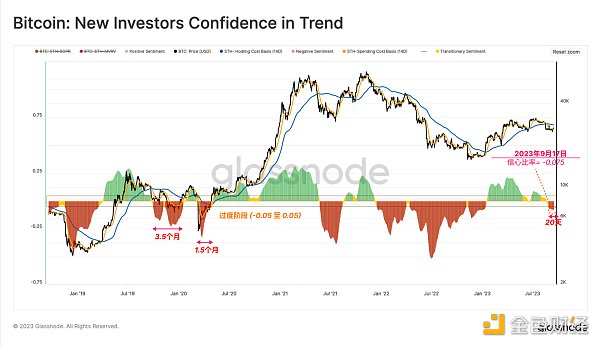
We attempt to judge the change in sentiment of new investors by comparing the differences between the cost basis of holders and sellers.
-
When the cost basis of sellers is lower than that of holders, it indicates a negative sentiment;
-
On the contrary, if the cost basis of sellers is higher, it shows an optimistic sentiment.
From this perspective, when the market dropped from $29,000 to $26,000 in mid-August, the cost basis of the sold STHs was lower than that of the holders, indicating panic and negative sentiment in the market in the short term.

To represent this indicator more intuitively, we have normalized it using the spot price.
 Significantly, this indicator usually fluctuates between -0.25 and 0.25, but there can also be outliers at critical market moments. Here, we ignore the neutral range of -0.05 to 0.05 (which is arbitrarily set).
The first important insight is that the negative sentiment in the bear market recovery phase usually lasts for 1.5 to 3.5 months. Recently, the market has entered a negative range since the end of 2022.
Analysts can use this tool to observe the sentiment change of STH. When the trend returns to the transitional zone and enters the positive zone (>-0.05), it implies that funds are flowing back into the market and holders are back in a favorable position.
Summary and Conclusion
The sentiment in the Bitcoin market is undergoing profound changes, and most short-term holders are now facing supply shortages. This has led to a negative shift in sentiment, with the prices at which investors are selling now lower than the costs of other groups. This indicates that a period of panic sentiment is affecting this group, which is the first time since the FTX crash.
Indicators show that although there are new capital and new investors entering in 2023, the momentum is not strong enough. This seems to suggest that the current macroeconomic conditions, regulatory pressures, and market liquidity constraints have increased uncertainty.
Like what you're reading? Subscribe to our top stories.
We will continue to update Gambling Chain; if you have any questions or suggestions, please contact us!
