
The inflation report last week, which could find reasons for both hawks and doves, is not expected to significantly change the Fed’s policy inclination, and the moderate rise in bond yields confirms this. The S&P 500 and Nasdaq Composite Index both fell for the second consecutive week, down 0.2% and 0.4%, respectively. The main decline occurred on Friday (the largest single-day decline in three weeks), before which the stock market sentiment was more positive.
The strike by the UAW auto union on Friday was the direct trigger, marking the first time in the 88-year history of the union that it has challenged all three major automakers at the same time.
In addition, the Philadelphia Semiconductor Index fell 3% on Friday. There are reports that TSMC will delay delivery of equipment to its factory in Arizona due to cautious outlook on demand; Adobe’s financial report exceeded expectations but unexpectedly fell sharply on Friday, also leading investors to take a more cautious attitude towards technology stocks on Friday. After Arm, a popular chip design company, rose 25% in its IPO on Thursday, its stock price fell 4.5% on Friday.
- Interpreting Mountain Protocol Will the profit-generating stablecoin USDM become the new underlying asset in the cryptocurrency market?
- Weekly Selection | Token2049 held in Singapore; Friend.tech regains popularity; FTX asset liquidation event causes market fluctuations
- Secondary Market Observation Up 300% in a month, what changes have occurred in Bluzelle’s short-term funding situation?
The rise in oil prices has exacerbated pessimism, with oil prices surpassing $90 per barrel, hitting a new high for the year. WTI rose 3.5% for the week, while Brent rose 3.8%.
Meanwhile, the continued rise in U.S. Treasury yields has continued to weigh on the stock market, with the 10-year Treasury yield climbing to 4.32%.
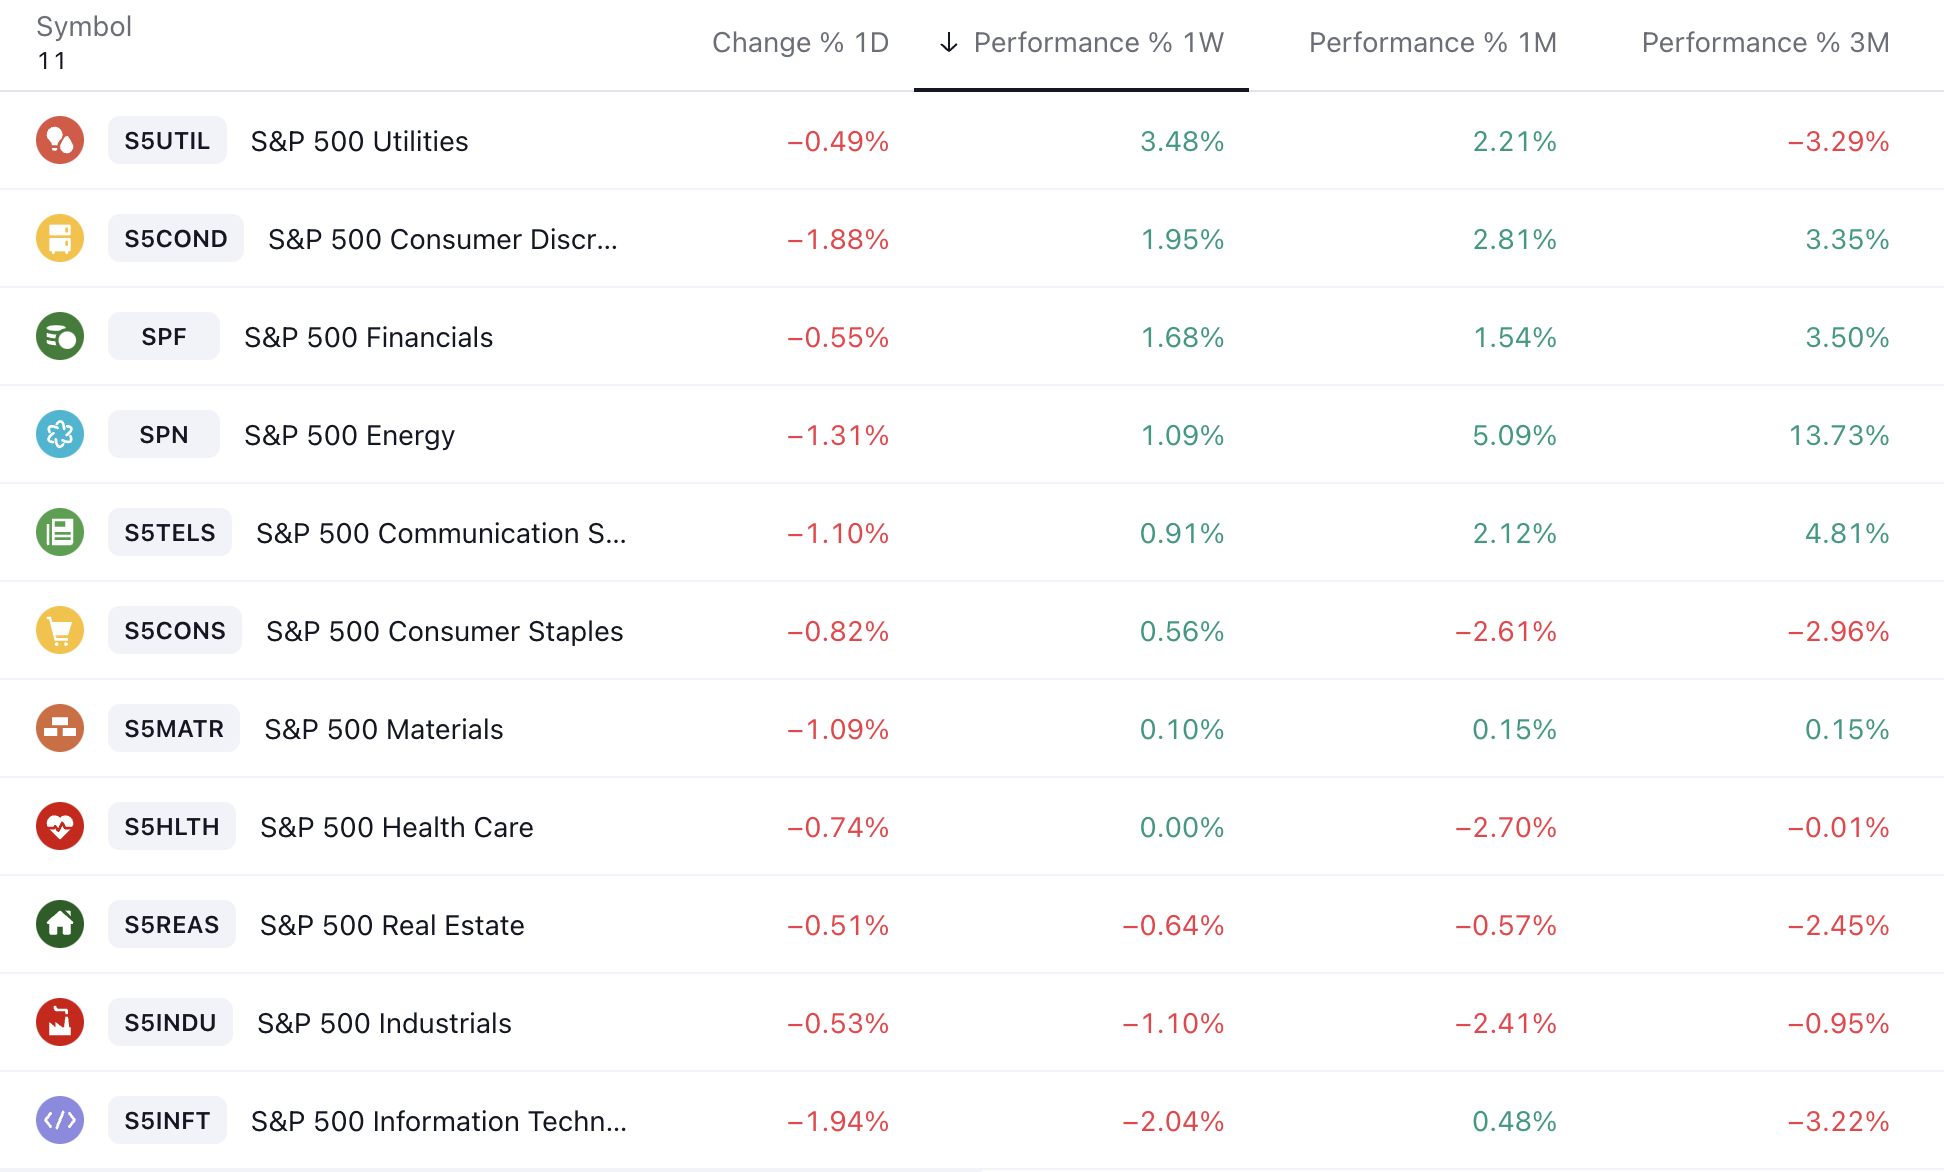
In terms of industry sectors, utilities (+3.5%), non-essential consumer goods (+2%), and finance (+1.7%) performed the strongest for the week, while industrials (-1.1%) and information technology (-2%) performed the weakest:
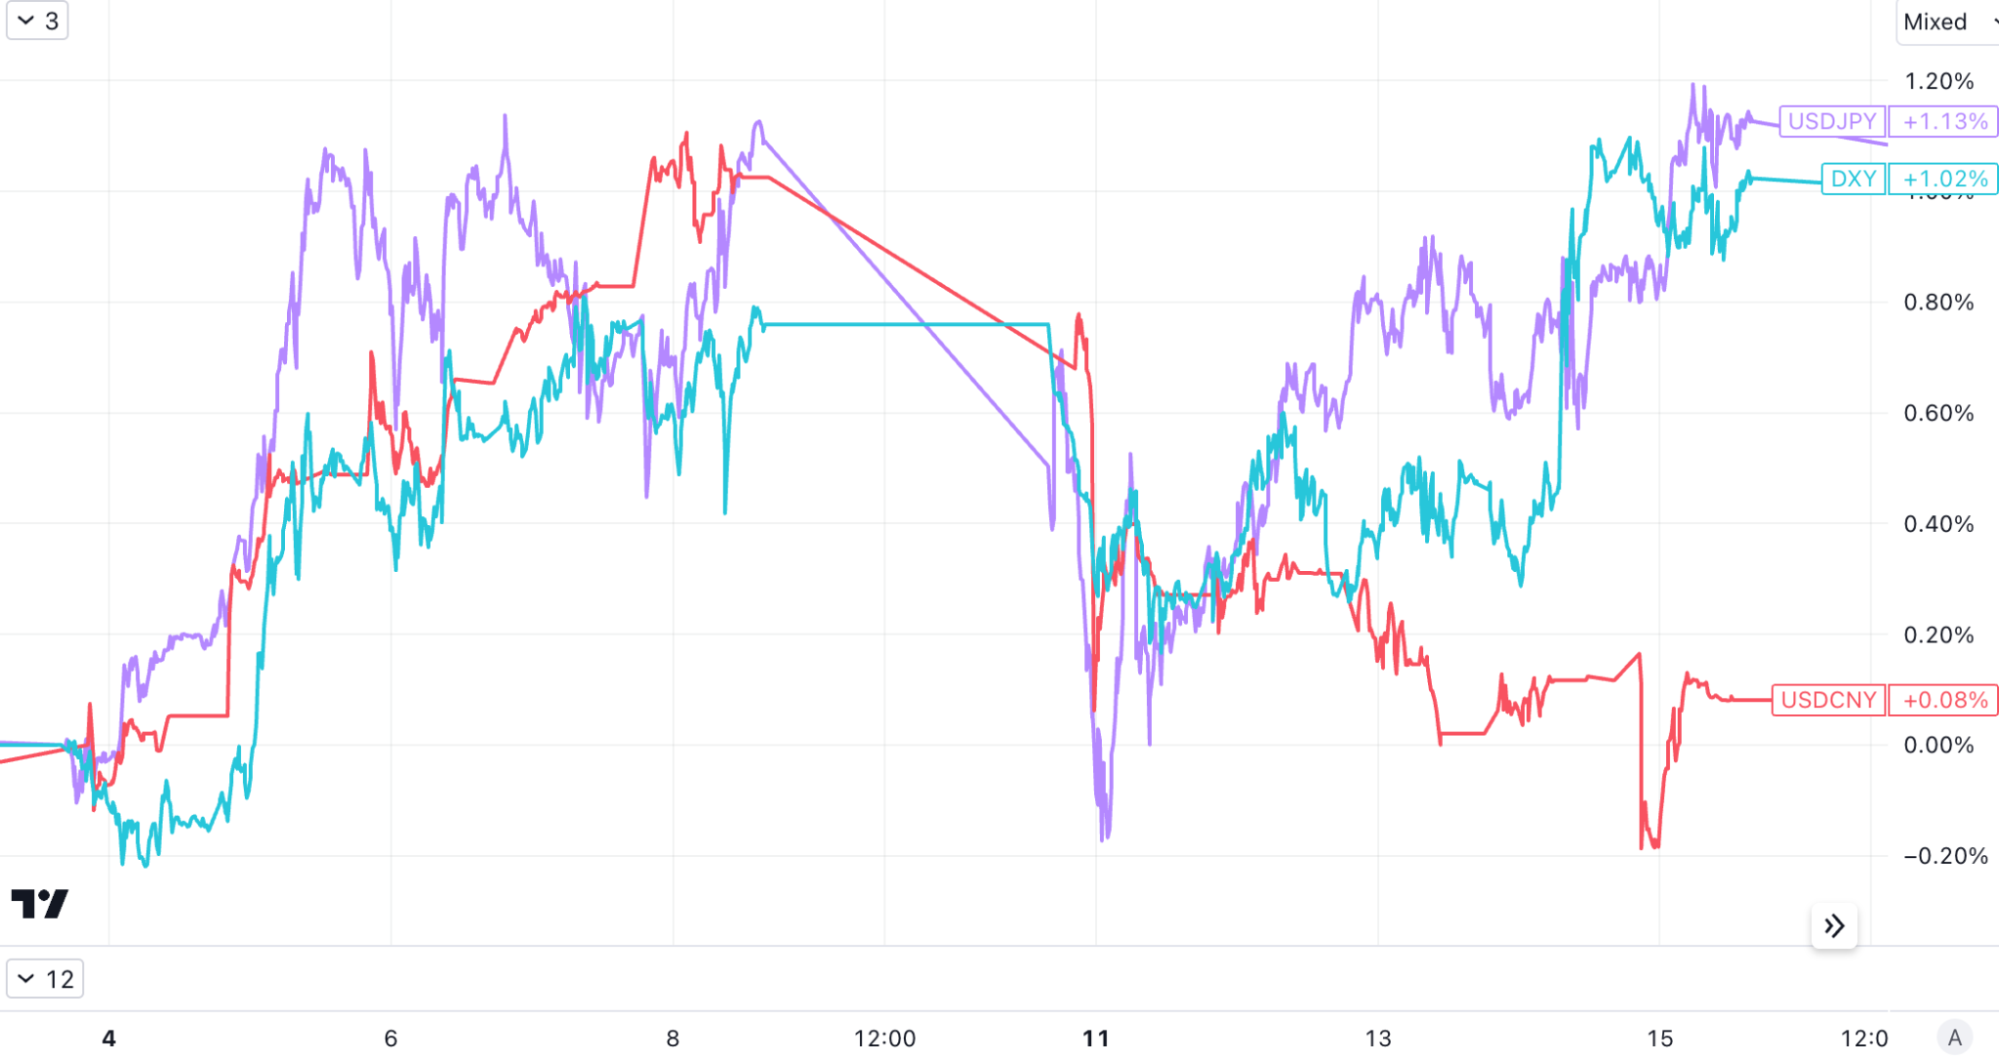
In the foreign exchange market, the U.S. dollar index fell and then rose, rising for the ninth consecutive week and hitting its highest level since March. Against the yen, it briefly touched 148, hitting its highest level since November last year. However, the renminbi has been strong in the past week, with USDCNY briefly falling to 7.25, hitting a new low since early August:
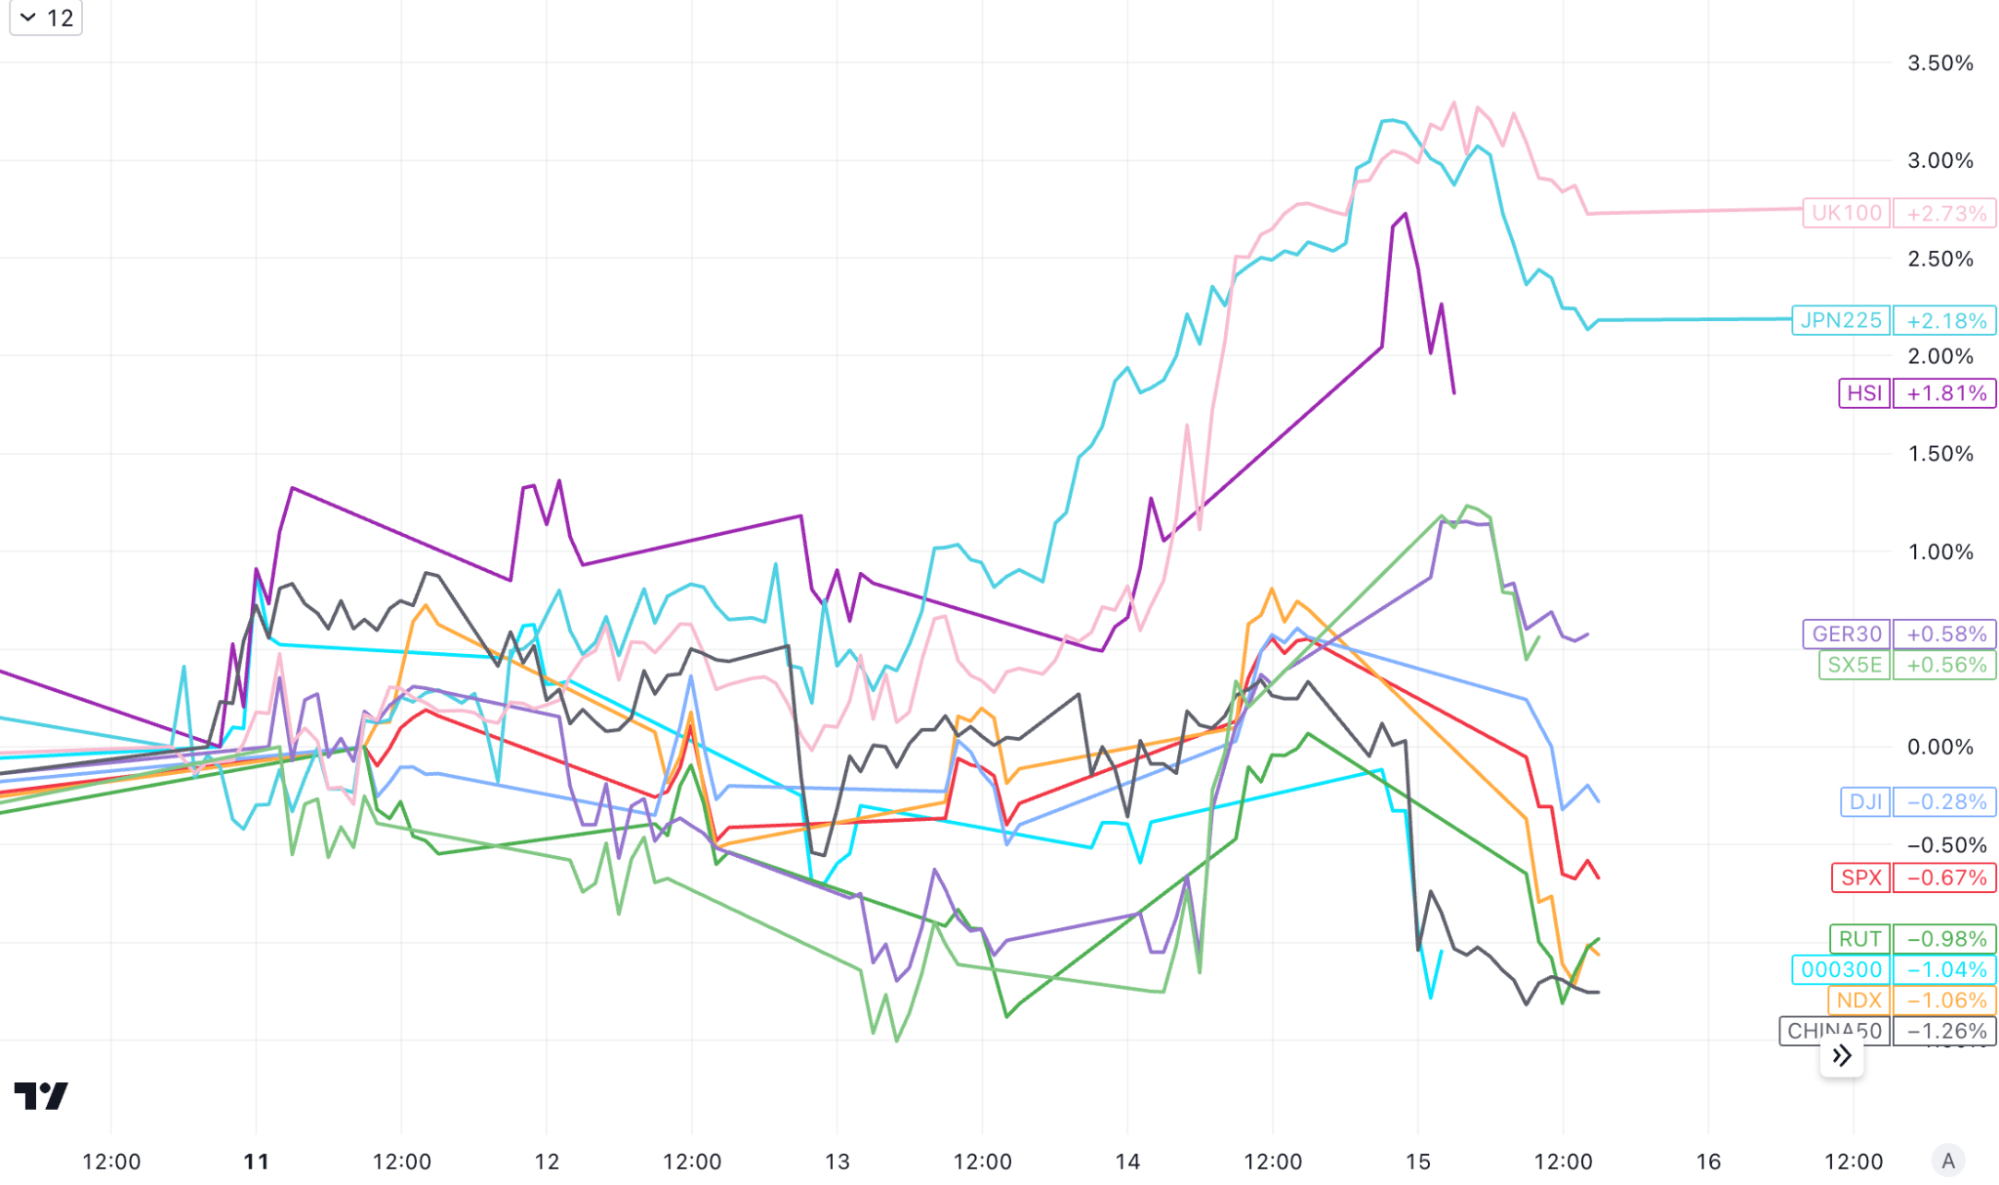
In other stock markets, Hong Kong, Japan (JPN225 hit a new high since July, as Japanese investors flocked to technology stocks after the strong listing of Arm under SoftBank Group), and the UK (UK100 hit a new high since June) performed strongly. The Stoxx50 in Europe also recorded a 0.6% increase, while the Shanghai and Shenzhen 300 indexes in mainland China fell for the third consecutive week:
Since 2023, we have not seen a 10% level correction, which usually occurs once a year. Therefore, if there is a deeper pullback in the historically weaker months of September and October, we would not be surprised (the stock market may also consolidate for a period of time instead of falling directly). However, in the short term, we have not seen any major economic or financial risks, so if there is a major decline, it can be seen as a good buying opportunity for long-term investment.
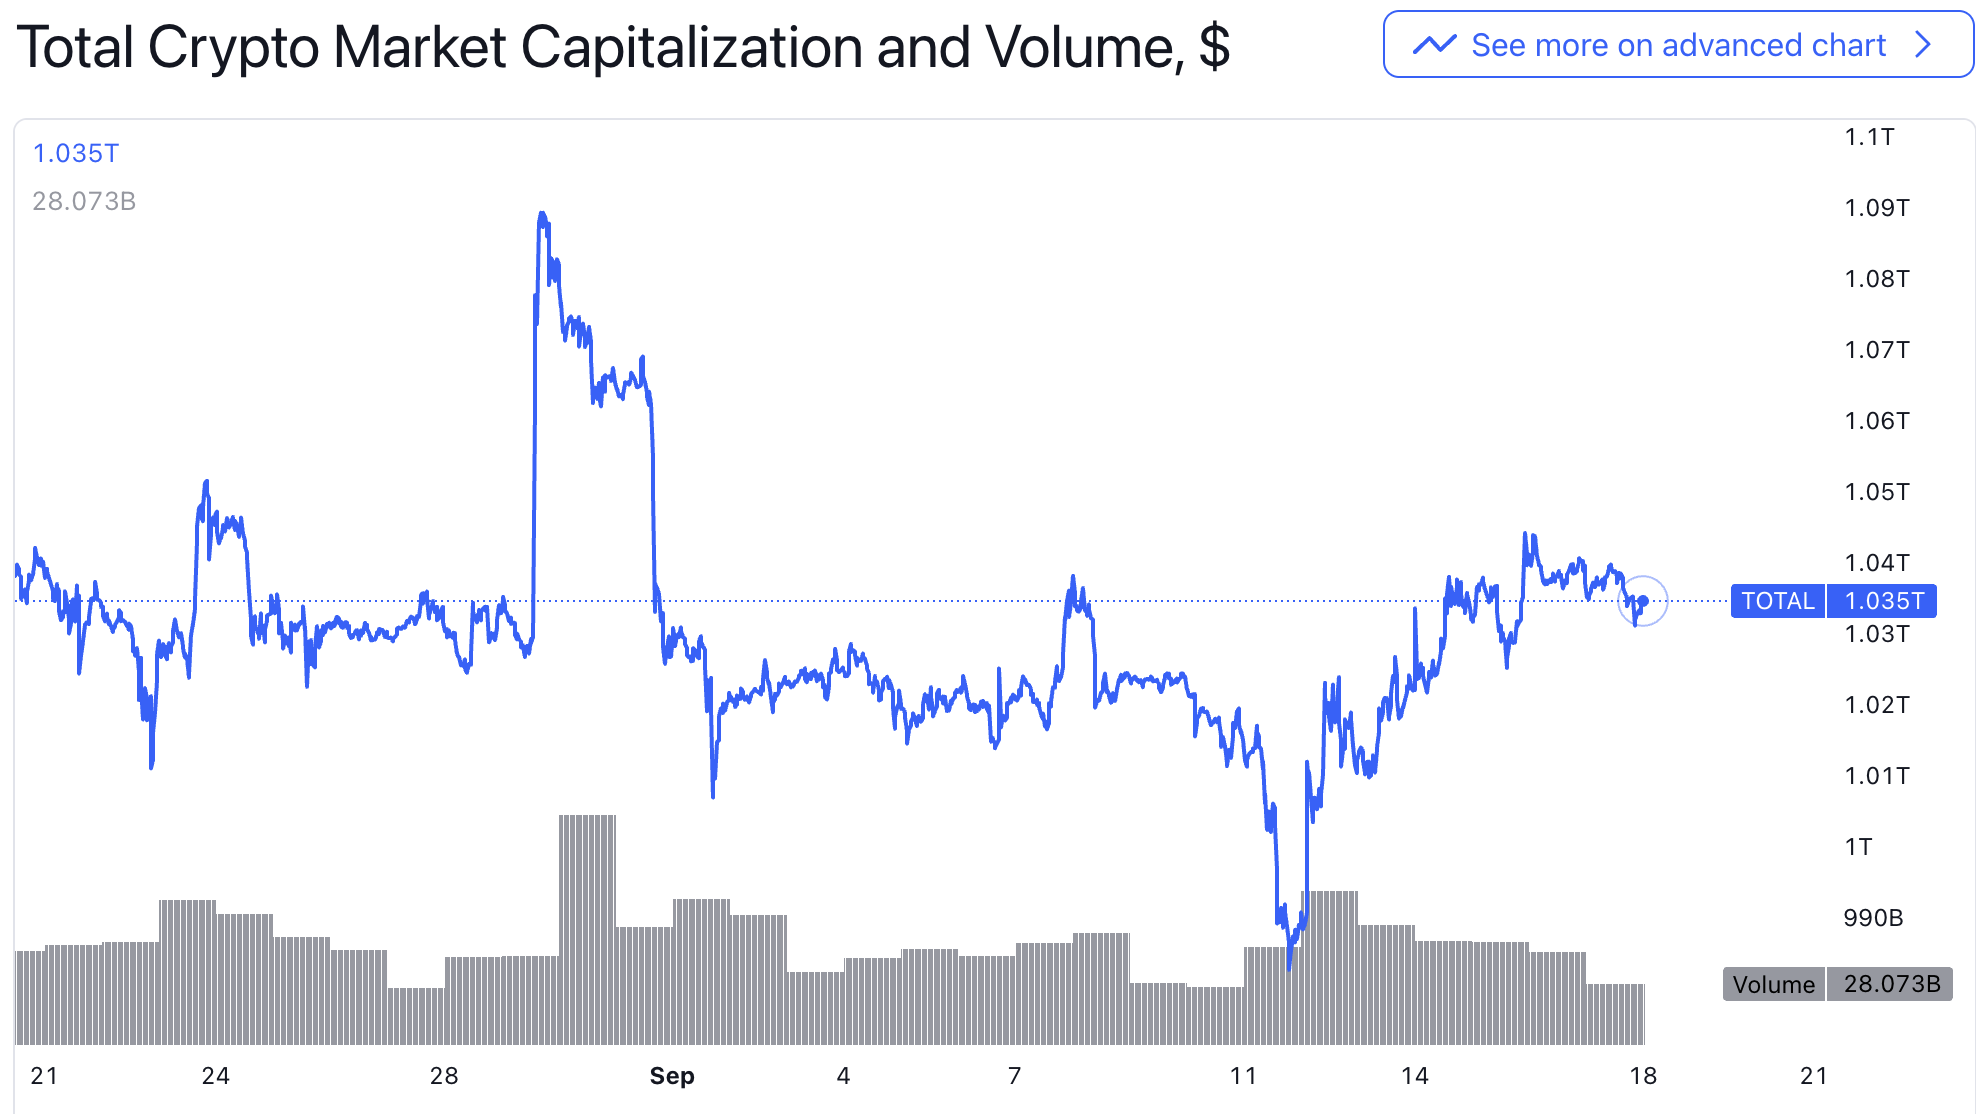
After a sharp drop in cryptocurrencies on Monday, there was a rebound. The main reason for the drop was the continuous fermentation of the news of the $3.4 billion cryptocurrency liquidation by FTX. However, after it was confirmed on Thursday, the market did not show a significant decline. We have already analyzed this in detail during the Muse morning meeting on Thursday:
Important Financial Events
【European Central Bank Raises Interest Rates by 25 Basis Points, but Suggests Rates May Have Peaked】
The European Central Bank raised its benchmark interest rate by 0.25 percentage points to 4% on Thursday. This is the 10th consecutive interest rate hike since the bank started rapidly raising rates from below zero levels last year. ECB President Lagarde suggested that Thursday’s rate hike may be the last in this round of rate hikes, which caused the euro to plummet. The US dollar index broke through 105.3, reaching its highest level since the March crisis. However, Lagarde also mentioned that it is currently impossible to determine whether the interest rates have reached their peak, and did not mention whether there will be an interest rate hike in November. She emphasized that the European Central Bank has not discussed lowering interest rates, but only mentioned that the market believes it is unlikely for the ECB to raise interest rates further based on weak data.
【Demand Slows Down, TSMC Reportedly Requests Suppliers to Delay Equipment Delivery】
On Friday, it was reported that due to the weak economic conditions and sluggish demand in the terminal market, Taiwan Semiconductor Manufacturing Company (TSMC) has requested major suppliers to delay the delivery of high-end chip manufacturing equipment. The affected companies include ASML, which manufactures lithography equipment. On that day, chip stocks in Europe and the United States fell together. TSMC’s Dutch suppliers ASML, BE Semiconductor Industries, and ASMI fell by 3.5%, 4.8%, and 6.6% respectively. The Philadelphia Semiconductor Index fell by about 3%, underperforming the market. NVIDIA fell by about 3.7%. TSMC’s US stocks fell by 2.4%, reaching a four-month low.
【Massive Strike in the US Auto Industry Affects 9% of North American Auto Production Capacity, Musk Benefits】
The United Auto Workers (UAW) union launched a strike against the “Big Three” in Detroit on Friday, September 15. This is the first time in UAW’s history that they have simultaneously launched a strike against the three major US automakers, and it is also one of the strongest strikes in the United States in recent years. However, the most successful new players in the electric vehicle field, such as Tesla and Rivian, have not formed unions. Regardless of the outcome of the strike, Tesla CEO Musk has already won. The “Big Three” will certainly spend more money, and any wage increase will further enhance Tesla’s huge cost advantage in the field of electric vehicles. Tesla’s stock price surged by 10% last week.
【Surpassing NVIDIA, Tesla’s Supercomputer?】
The surge in Tesla’s stock price is also related to Wall Street’s major banks raising their target prices. On Monday, Morgan Stanley raised Tesla’s stock price target from $250 to $400, emphasizing the potential of Tesla’s Dojo supercomputer project. Dojo is a supercomputer network that can integrate millions of Tesla vehicles and is designed to train artificial intelligence systems to perform complex tasks, such as assisting Tesla’s driver assistance system Autopilot and driving “fully autonomous driving”. As of July this year, Tesla has sold nearly 4.53 million vehicles, each of which sends data back to Tesla to develop autonomous driving capabilities.
By using this backend supercomputer specifically designed for learning real data, Tesla combines a huge network of mobile sensors and cameras with powerful edge computing capabilities. This unprecedented model allows Tesla to go beyond being just a car manufacturer.
Morgan Stanley believes that theoretically, Dojo could bring the company long-term value of up to $500 billion. Morgan Stanley predicts that by 2030, Tesla will be able to generate a recurring revenue of $2,160 per month from vehicle owners. This revenue will come from services provided by Dojo, as well as automotive subscription software, vehicle charging services, maintenance, software upgrades, and future content development related to autonomous driving systems.
[In August, China’s new RMB loans and social financing both rebounded significantly]
In August, RMB loans increased by 1.36 trillion yuan, and the scale of social financing increased by 3.12 trillion yuan. By the end of the month, the stock of social financing increased by 9% year-on-year, while broad money supply (M2) increased by 10.6% year-on-year. Compared with the previous period and the same period last year, the increase in new RMB loans and social financing in August was significantly higher. This is mainly due to the economic, stock market, and real estate stabilization measures introduced intensively by regulators in that month, which boosted market confidence. Financial support for the real economy has continued to strengthen, and real demand has also rebounded synchronously.
[Weight loss drugs are the new AI]
The weight loss drug market is booming. As the market value of the two major weight loss drug manufacturers, Novo Nordisk and Eli Lilly, continues to rise, the financial blog ZeroHedge directly calls it the “new AI” of weight loss drugs. According to JPMorgan’s latest forecast, by 2030, with the duopoly of Novo Nordisk and Eli Lilly, the annual sales of GLP-1 drugs will exceed $100 billion.
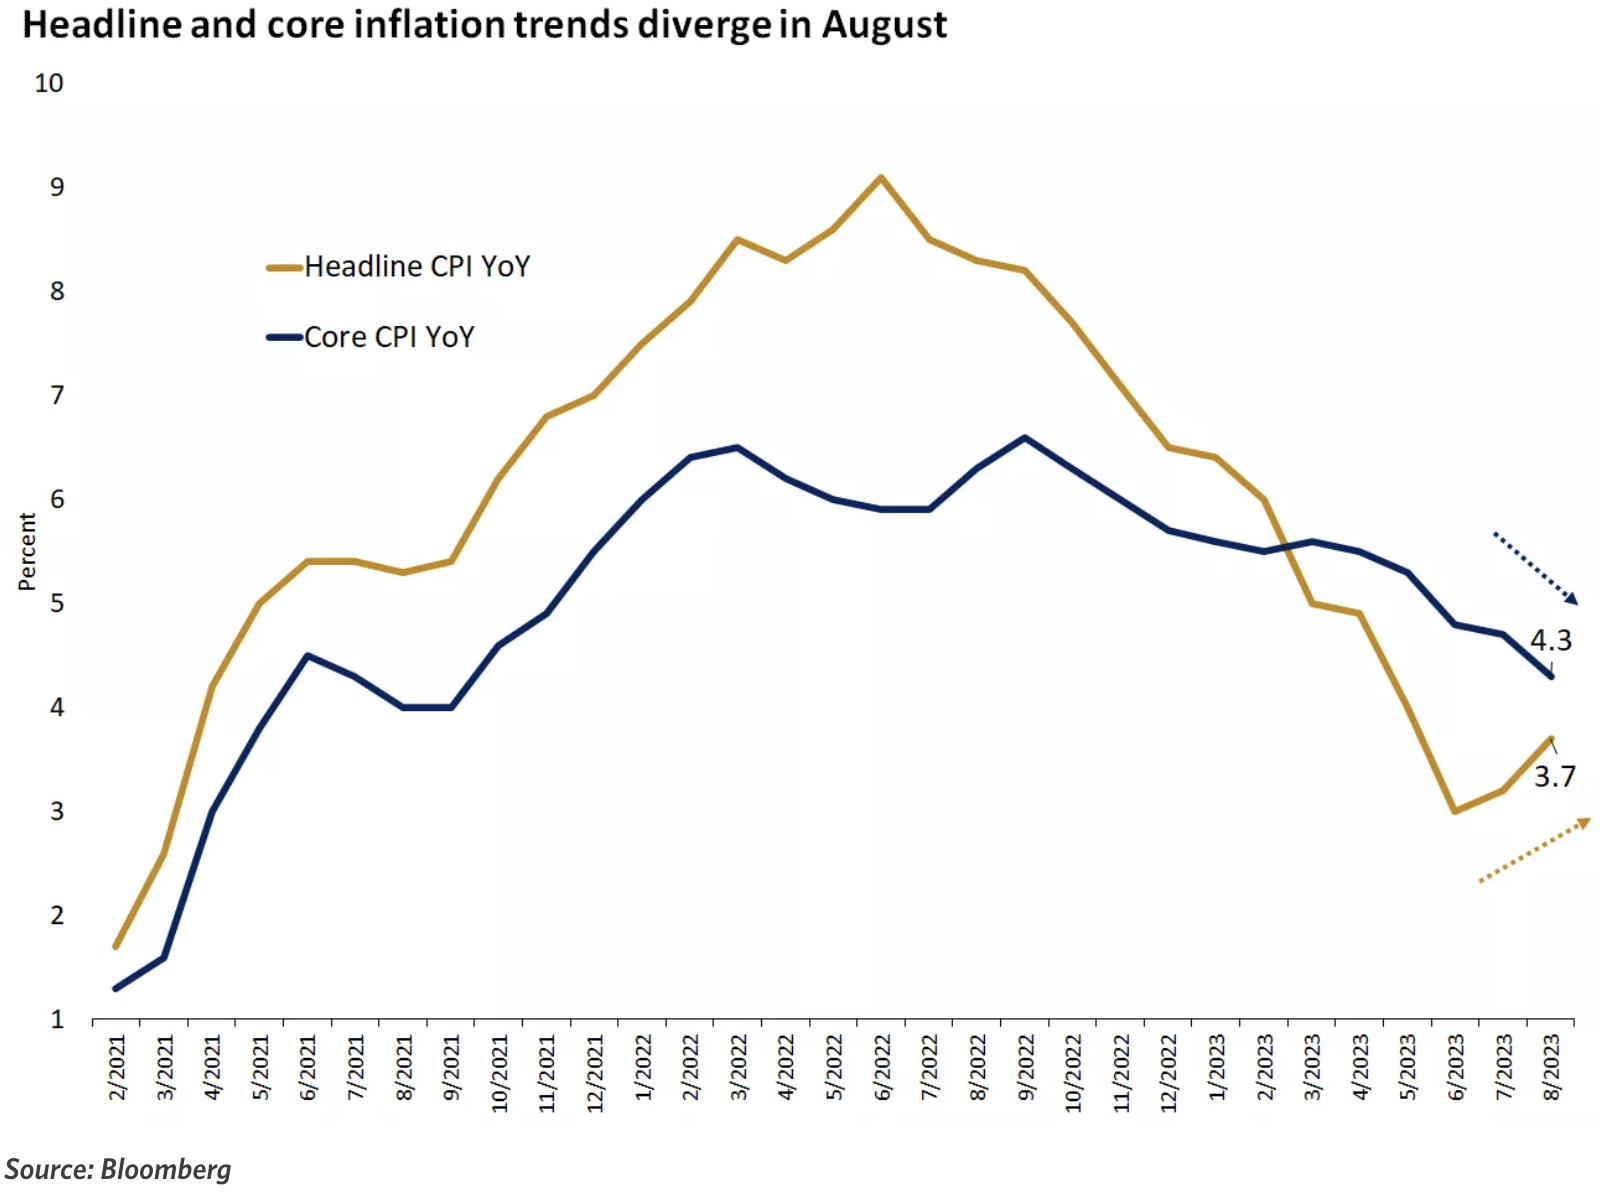
[Stubborn US inflation, August CPI rebounded to 3.7% year-on-year, core CPI accelerated for the first time in six months on a month-on-month basis]
Oil prices soared, and US inflation accelerated again in August, which may require the Federal Reserve to maintain high interest rates for a longer period of time. The overall CPI year-on-year growth rate rebounded for the second consecutive month and exceeded expectations at 3.6% (compared to the previous value of 3.2% in July). The month-on-month CPI growth rate increased from 0.2% in July to 0.6% in August, in line with expectations, marking the largest month-on-month increase in 14 months. The Federal Reserve pays more attention to core CPI, which excludes energy and food. The year-on-year growth rate of core CPI decreased from 4.7% to 4.3%, in line with expectations, marking the smallest increase in nearly two years. However, the month-on-month core CPI increase slightly rose from 0.2% in July to 0.3%, exceeding the expected 0.2% increase.
[US August PPI rebounds more than expected, up 1.6% year-on-year, marking the largest month-on-month increase in over a year]
Affected by the rise in energy prices, the US PPI in August continued to rise higher than expected, with a year-on-year increase of 1.6%, higher than the expected 1.3%, marking the second consecutive month of higher-than-expected growth; the month-on-month increase in PPI was 0.7%, the highest growth rate since June last year, and the July growth rate was revised up to 0.4%. In August, the core PPI increased by 2.2% year-on-year and 0.2% month-on-month, both slower than in July, in line with expectations.
[Strong support from gasoline prices, US retail sales increase by 0.6% month-on-month in August, far exceeding expectations]
In August, retail sales in the United States increased by 0.6% month-on-month, surpassing the revised value of 0.5% and far exceeding market expectations of 0.1%, achieving the fifth consecutive month of growth. Overall, retail sales in August still show resilience, mainly supported by the rise in gasoline prices, with price pressures starting to emerge in other areas.
Hot topic: Inverted yield curve
Many investors believe that the recent rise in real yields is different from the past because yields continue to rise despite the tightening cycle of central banks coming to an end. The market increasingly expects that the new equilibrium real interest rate level will be higher compared to the decade before the pandemic, which is derived from higher fiscal deficits and productivity growth. Due to higher fiscal deficits compared to the past, there is also more government bond supply, and recent technological innovations have brought about higher productivity, in sharp contrast to the long stagnation during the 2008 financial crisis.
Today, the real yields and real GDP growth in the United States appear similar to before 2008. In mid-2006, the 10-year Treasury bond priced in real yields at around 2.5%. The previous year, the real growth rate of the US economy was 3.0%, while the Fed raised its policy rate target to 5.25%.
Today, the 10-year Treasury bond offers a real yield close to 2.0%, while the real economy has recently grown by 2.5%. Even today, the target federal funds rate range of 5.25%-5.50% is similar to 2006. This market pricing is almost no different from the situation before the 2008 global financial crisis.
Most notably and of greatest concern is that compared to 2006, the yield curve is much flatter today, both in nominal and real terms. In mid-2006, the nominal yield on 2-year Treasury bonds was the same as the nominal yield on 10-year Treasury bonds. However, today, the 2-year yield is 70-100 basis points higher than the 10-year yield. Many people believe that the severity of the yield curve inversion in 2022 indicates a recession in 2023.
In addition to the market structure distortion caused by the expectation gap mentioned earlier, the size of the central bank’s balance sheet may also be a factor. The larger the proportion of long-term government bonds held by the central bank in the total issuance, the flatter the yield curve should theoretically be. Today, the size of the Fed’s balance sheet is an order of magnitude larger than in 2006, so for the same short-term policy rate, the yield curve should be flatter.
If we consider the impact of the balance sheet scale, today’s actual yield may actually be much higher than in 2006, which is an important difference. In 2006, the size of the Federal Reserve’s balance sheet was about $800 billion. Today, the size of the Federal Reserve’s balance sheet is about $8 trillion, which means it has expanded by about 10 times compared to 2006.
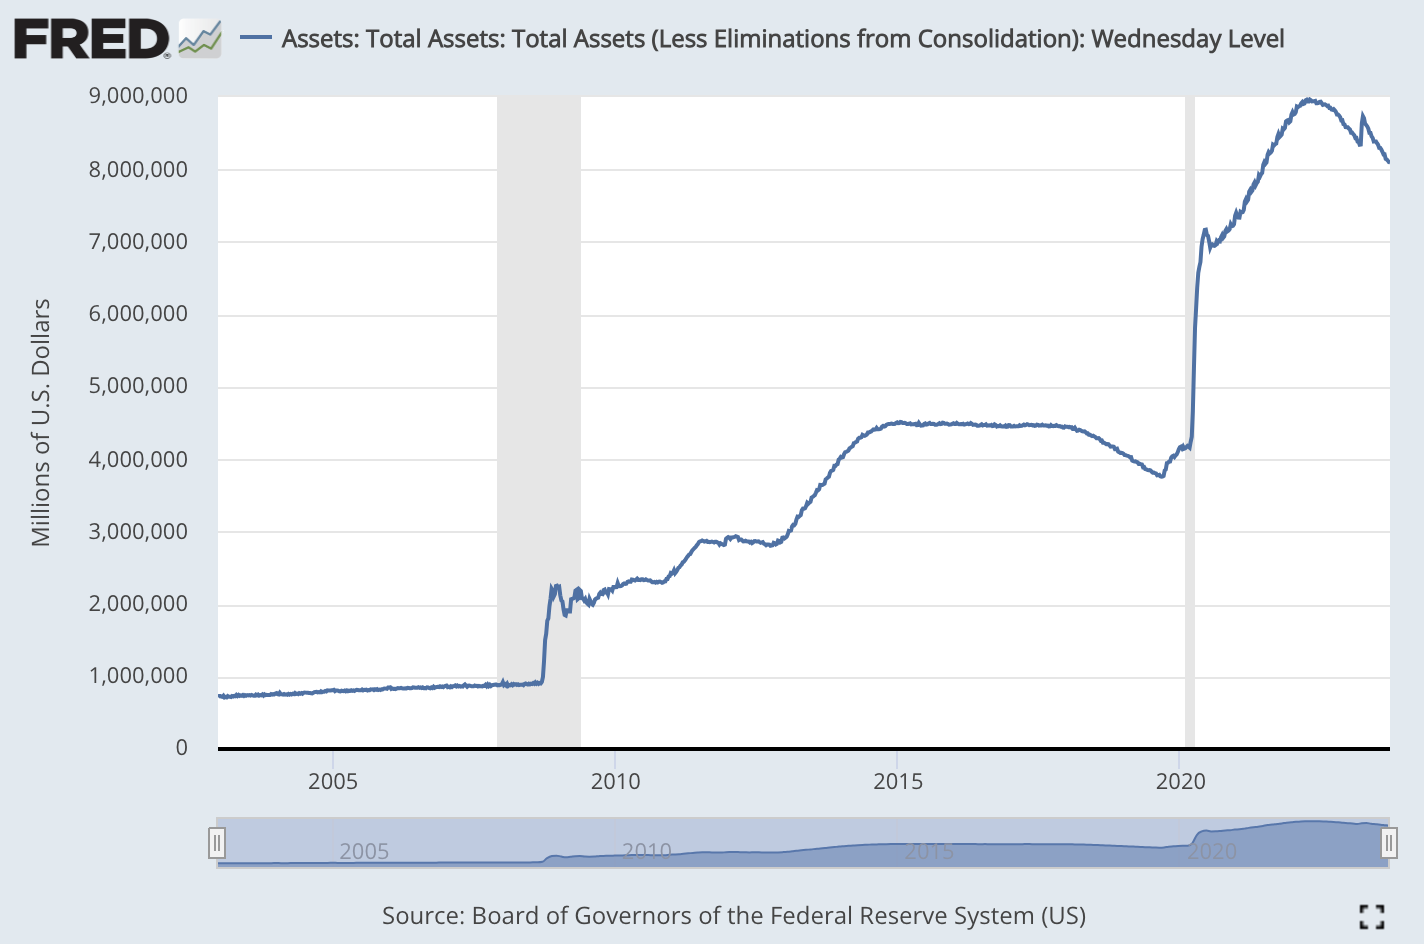
Against the background of the Fed’s continued tapering (although slow) and the government’s continuous issuance, it is difficult to expect a significant decline in the bond market yield curve in the short to medium term, unless there is a significant slowdown in the economy and a corresponding interest rate cut by the Fed, which is the crisis or recession scenario expected by many people.
Below is a pessimistic analysis from Via CICC on September 17th:
The Federal Reserve will begin monetary tightening in March 2022, but large-scale and sustained fiscal expansion has significantly delayed credit tightening. The resumption of fiscal expansion after the SVB incident in March is a typical example. However, delay does not mean absence, and the launch of credit tightening will become the “gravity” that restricts growth. Since March, while promoting government credit expansion, the increased exposure of risks for small and medium-sized banks has also accelerated the tightening of private credit, especially in indirect financing more closely related to small and medium-sized banks: 1) Bank credit standards have tightened significantly, especially for commercial real estate, large and medium-sized enterprises, and small business loan standards. The proportion of banks tightening standards has risen rapidly, approaching the highest point in the early stages of the epidemic; credit card and mortgage loan standards have also tightened. 2) The absolute scale of industrial and commercial loans has declined significantly, with year-on-year growth approaching zero growth, and the growth rate of consumer loans and mortgage loans has fallen from a high level.
Looking ahead, the main key points of the US economic cycle are: the Federal Reserve is approaching the end of interest rate hikes at the end of this year, and tight credit continues; excess savings will gradually be depleted at the beginning of next year, which will gradually suppress consumption, and destocking will continue until around the second quarter of next year. Therefore, the US economy may continue to decline by the end of this year and next year, but not to a deep extent (residential balance sheets are still healthy). Therefore, the market expects that the Federal Reserve may start an interest rate cut cycle after the second half of next year, at which time the credit cycle will stabilize, pushing for the reopening of the restocking cycle and achieving a recovery after the economic bottoming out.
On the other hand, an analysis from the optimistic Deutsche Bank:
In its report on September 14th, the bank believes that the US economy is currently in a period of resilient growth with no obvious signs of recession. This is mainly based on the following positive factors:
(1) Both businesses and households have good financial conditions and healthy balance sheets. Corporate leverage is low and household savings are sufficient. This is different from past economic recession cycles.
(2) The job market is still tight, with the unemployment rate close to historical lows. Companies are not willing to lay off employees. The number of employed people is still below the pre-pandemic trend level. (Until now, the total number of employed people is still slightly lower than the expected level of continuous growth at a rate of 1.6% from 2015 to 2019)
(3) During the epidemic, families have accumulated a large amount of additional savings. Even under optimistic assumptions, these savings are sufficient to support consumption until at least the second half of 2023.
(4) Real estate is the most sensitive part of the economy to interest rates, but its GDP share is low, only 2.8%. In addition, there are signs of stabilization in real estate sales in the near term.
(5) Corporate internal cash flow can cover dividends and capital expenditures. There is not much demand for new debt financing by companies.
Although various leading indicators show that the economy should enter a recession, the actual growth rate has only shown a slight slowdown. The report believes that the economy may continue to grow at a slow pace rather than experiencing a recession. The Fed’s interest rate hike cycle is also coming to an end, making it unlikely to tighten significantly again. However, the report also predicts that the Fed is unlikely to significantly cut interest rates to stimulate the economy in the future.
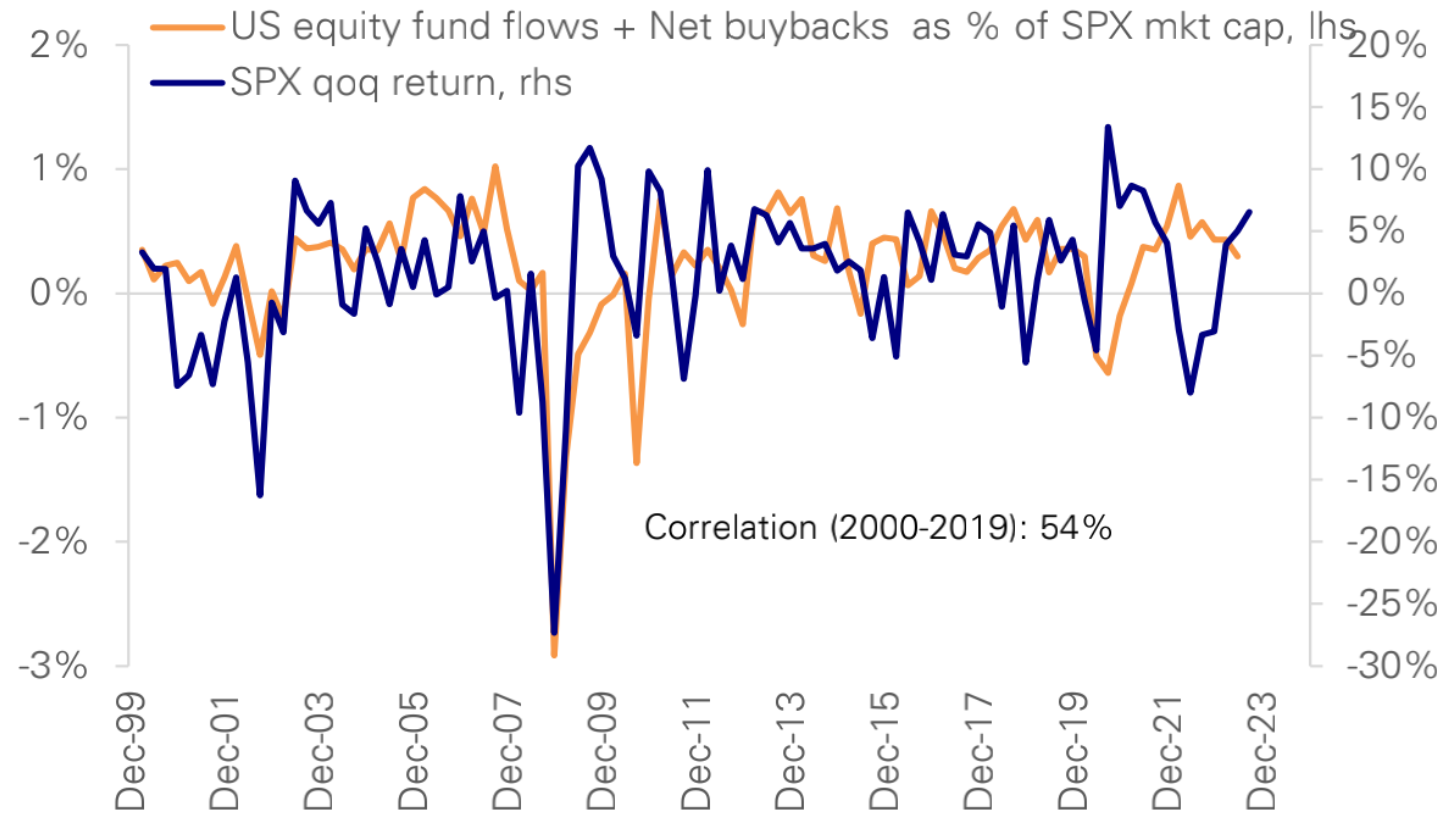
The combination of liquidity, stock buybacks, issuances, and changes in positions explains most of the changes in stock market returns in history. In a lighter and shorter-term recession, it is expected that positions will experience modest declines, and small outflows of funds will be offset by stock buybacks. The balance of supply and demand is sufficient to keep the S&P 500 index around 4500 points by the end of the year.
Funds and Positions
Summary: The overall stock position rose slightly last week, with subjective investors increasing their positions; stock funds saw the largest net inflows in 18 months, bond funds had a slight increase in inflows, and money market funds continued to have strong inflows.
In terms of the market, we are currently in a typical pullback phase. The overall stock position rose slightly this week, slightly higher than the neutral level (historical percentile of 61%), mainly driven by an increase in subjective investor positions:
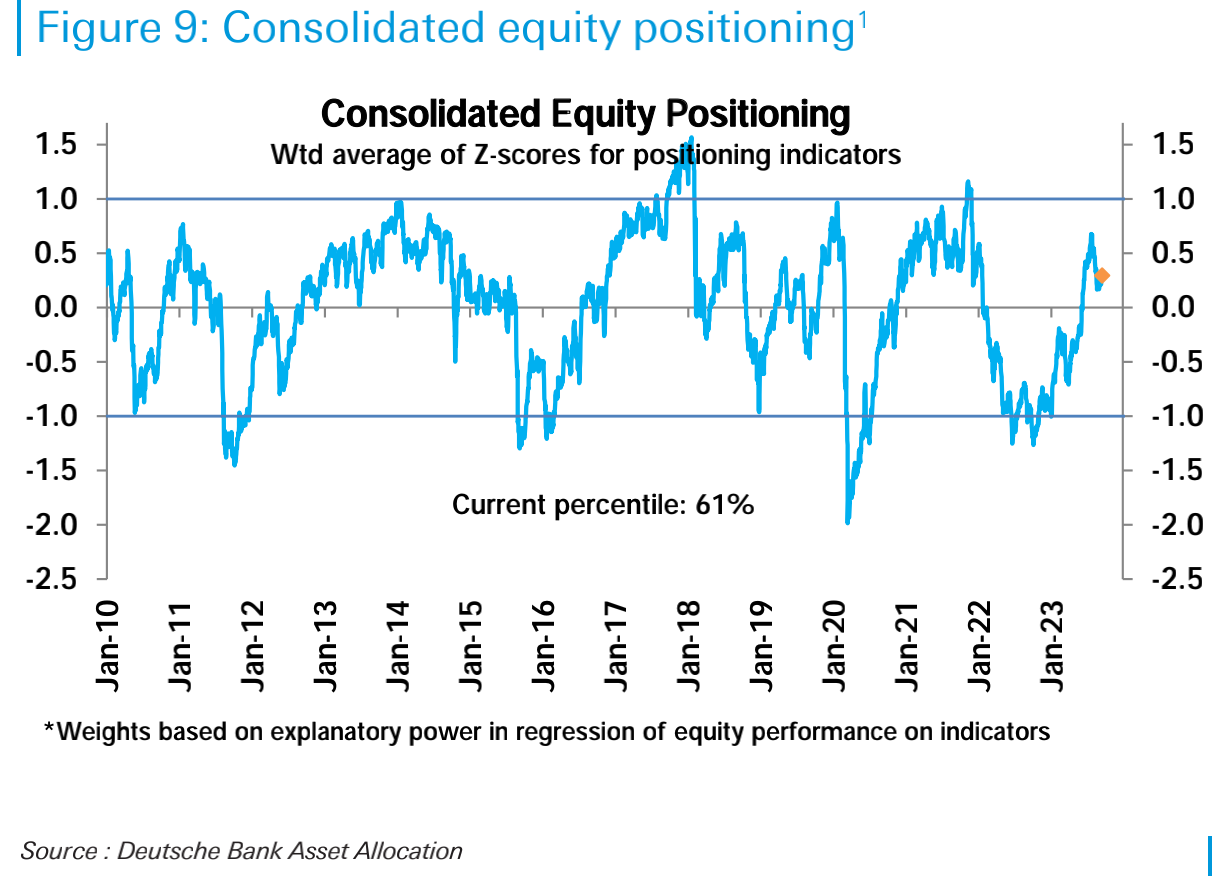
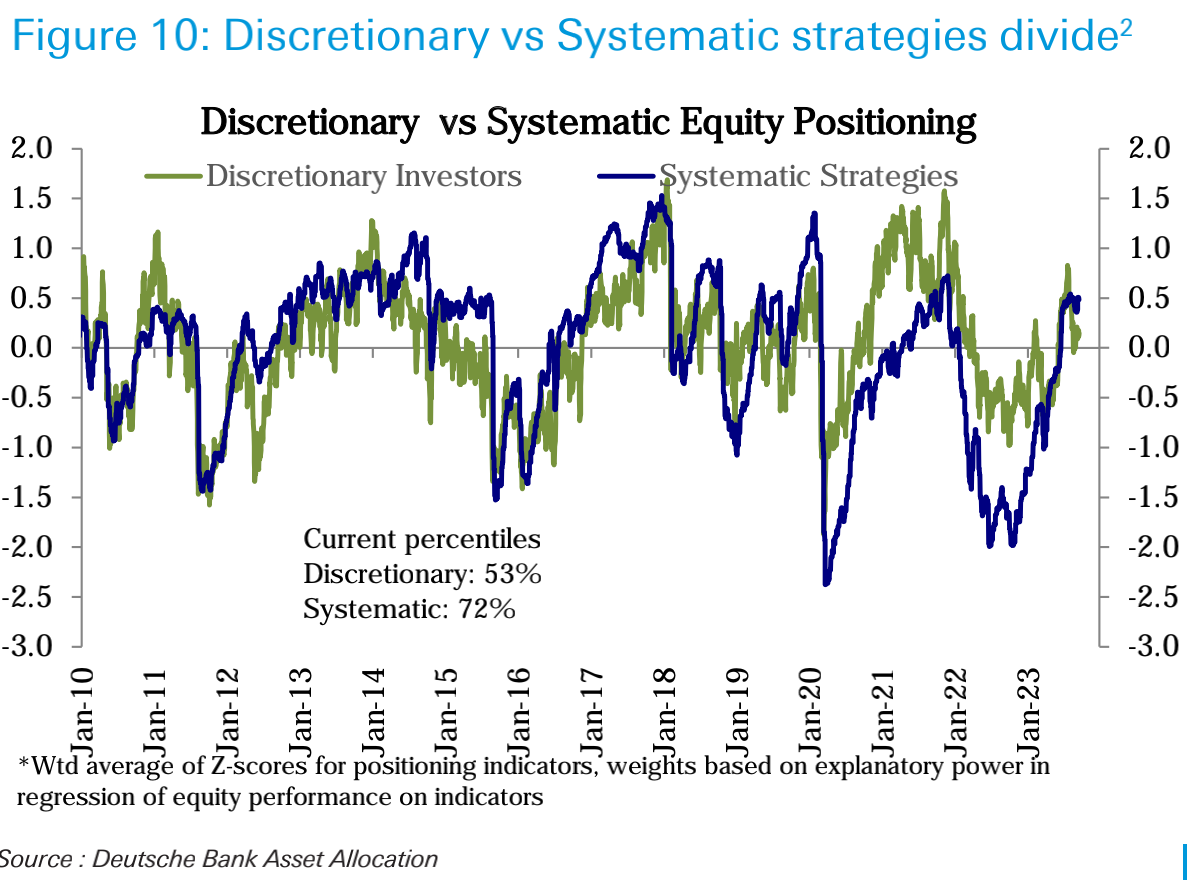
The subjective investor position rose from the historical 49th percentile to the 53rd percentile, while the systematic strategy investors rose from the 71st percentile to the 72nd:
Overall, the rebound driven by extreme bearish positions has basically been completed by August and is no longer the main driving force supporting the stock market. In the current stage, it is necessary to be driven by fundamentals, such as better-than-expected economic data and improved corporate profits, to drive the stock market to establish more long positions.
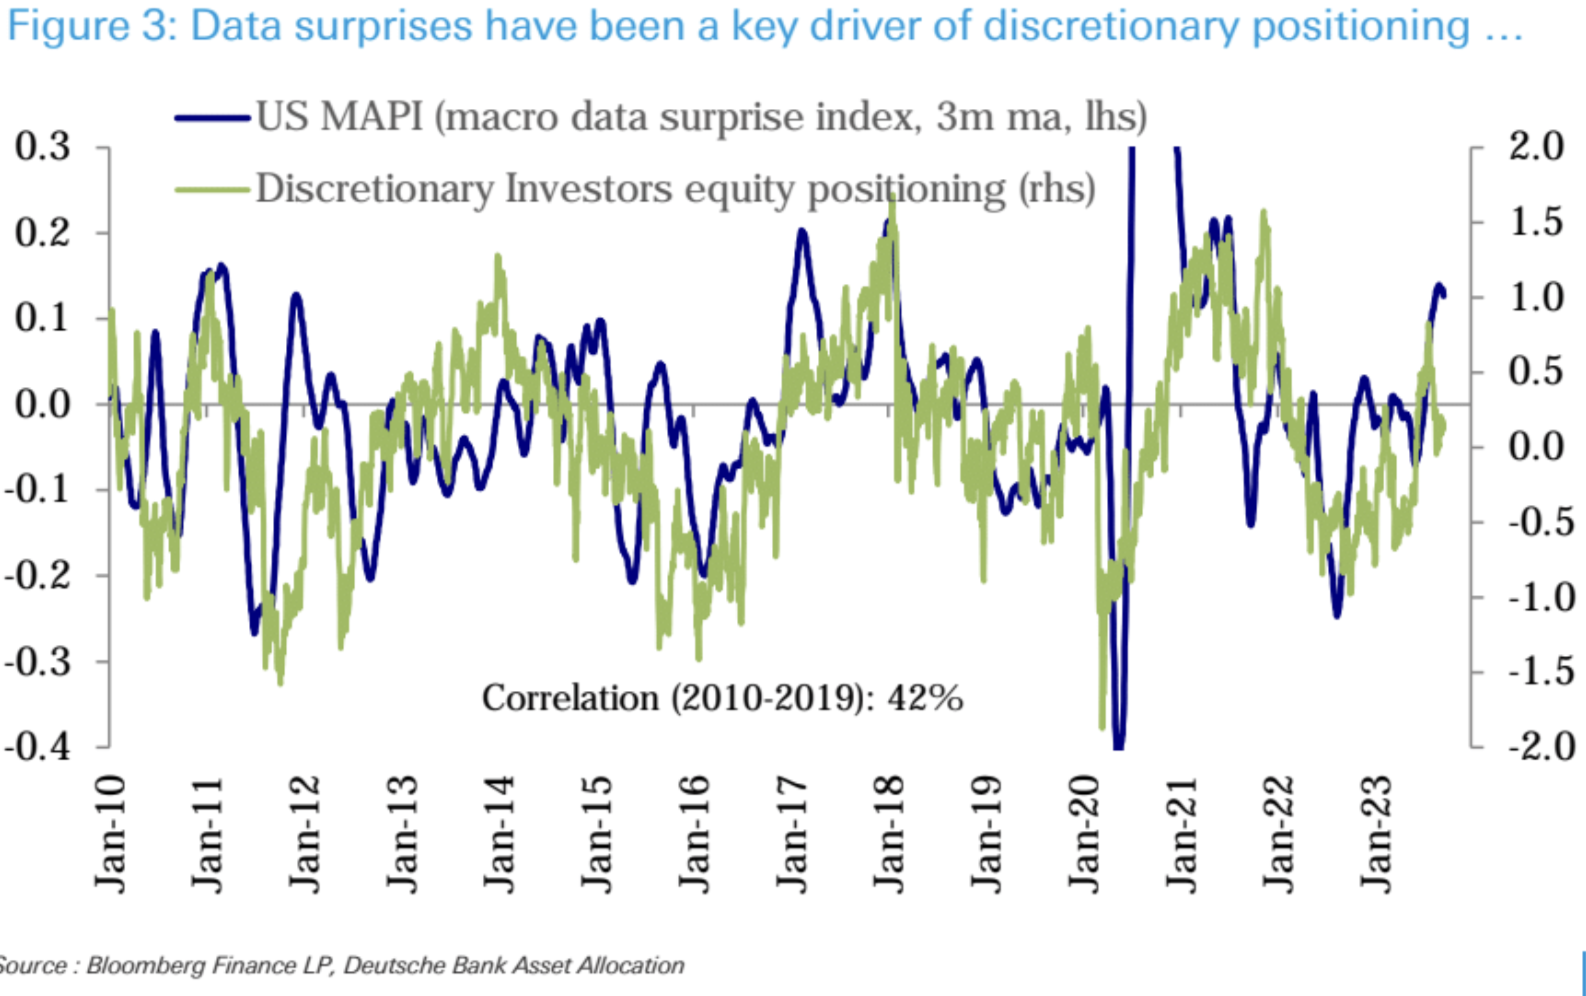
Deutsche Bank’s view is that expectations for surprising economic data are still low. A series of growth data exceeding expectations has continued to strengthen the surprise index of the economy, but the expectation of a slowdown in the future economy is still mainstream, so this may support the next round of surprising data. And the change in subjective investor stock positions has a high correlation with the surprise index of the economy:
In addition, the position of subjective investors has always been highly negatively correlated with interest rate volatility (the correlation coefficient has been -89% since 2021), because they continue to focus on the lagging impact of monetary policy tightening. Currently, interest rate volatility has dropped to an 18-month low: 
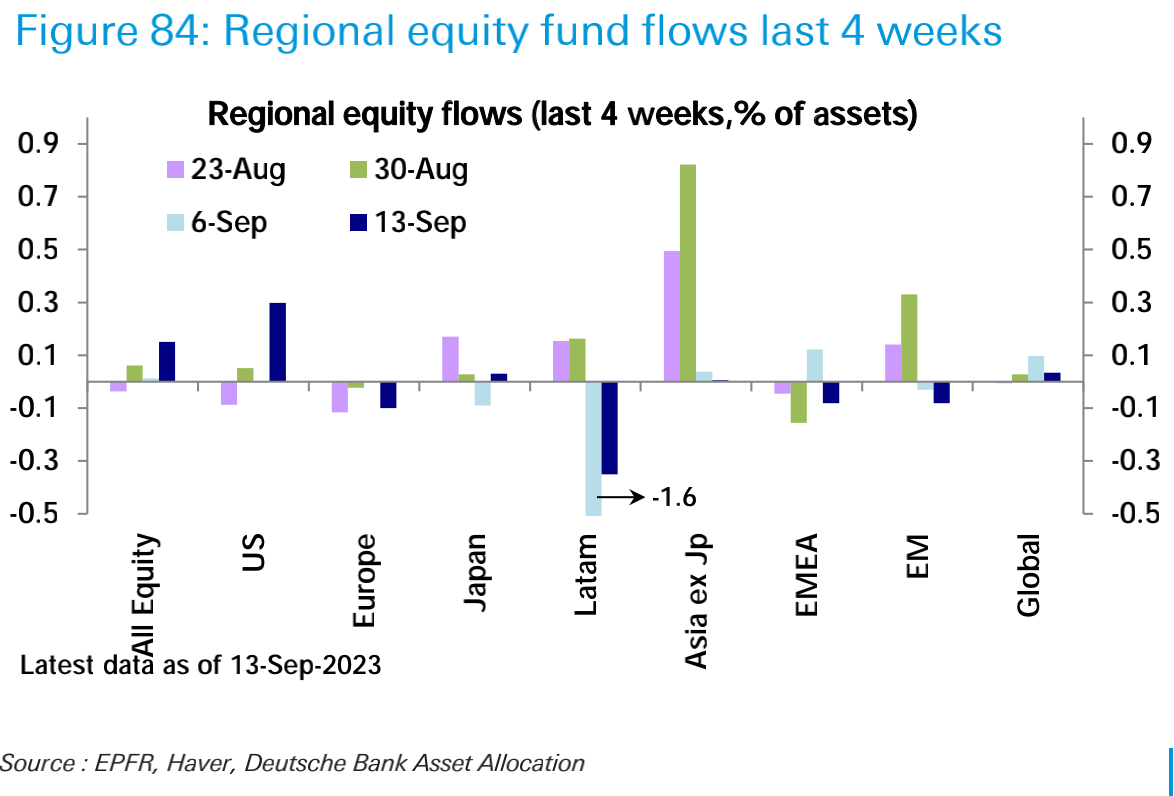
Last week, stock funds (ETFs and mutual funds) recorded the largest weekly net inflow in 18 months ($25.3 billion), mainly from the United States ($26.4 billion). Emerging market funds (-$1.2 billion) recorded a net outflow for two weeks, and European funds (-$1.4 billion) continued their net outflow for 27 weeks: 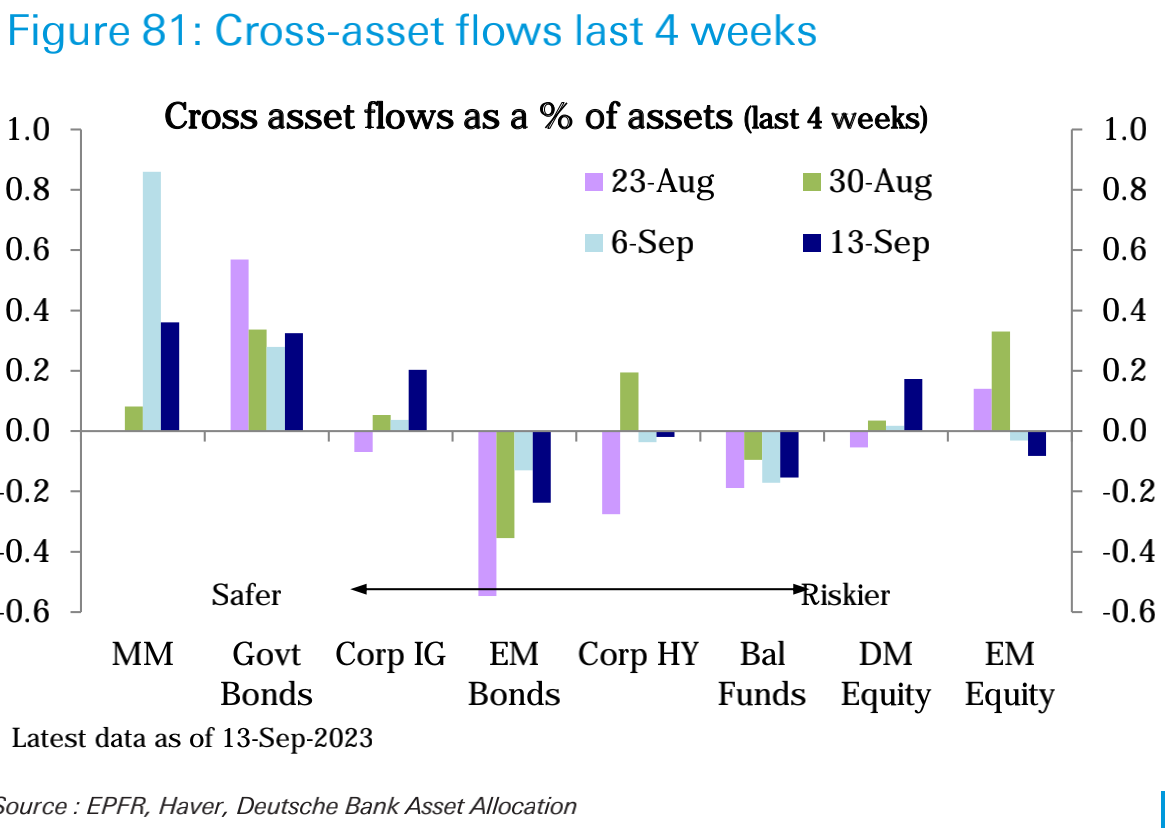
The inflow of bond funds ($4.8 billion) was slightly higher than last week. Investment-grade corporate bonds ($2 billion) accelerated their inflow, but high-yield bonds (-$1 billion) and emerging market bonds (-$1.1 billion) continued to experience net outflows. The inflow of government bonds ($3 billion) continues.
The inflow of money market funds ($28.9 billion) slowed down from last week, but still remained strong, mainly in the United States ($23.2 billion).
In terms of sectors, the technology sector ($1.3 billion) turned into net inflow after a net outflow last week. The energy sector ($200 million) also received moderate inflows. The healthcare (-$800 million), non-essential consumer goods (-$600 million), telecommunications (-$400 million), raw materials (-$300 million), and financial (-$200 million) sectors experienced net outflows, while other sectors had smaller flows.

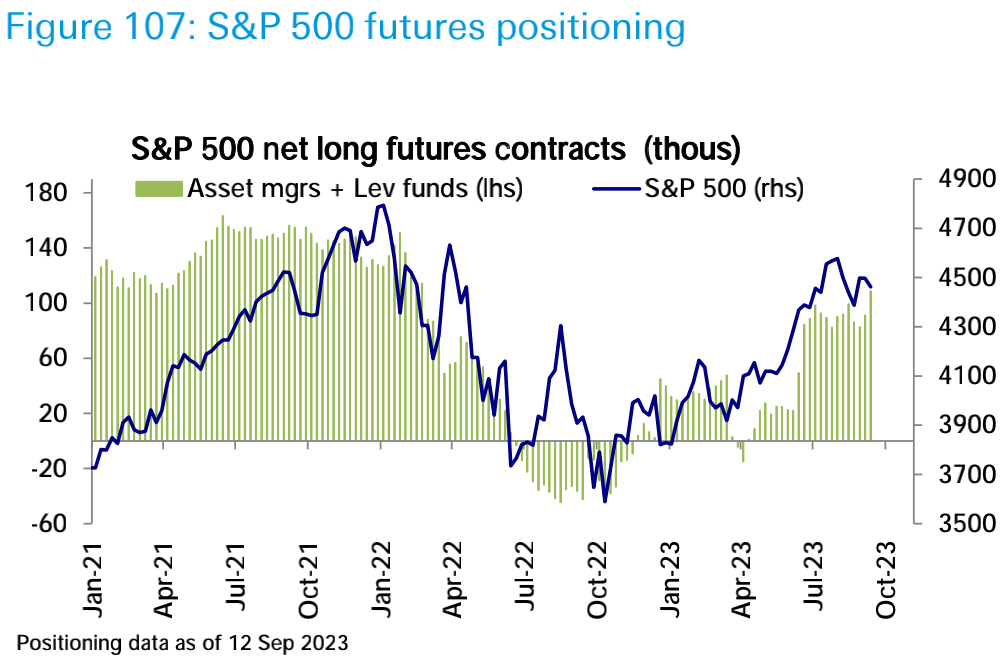
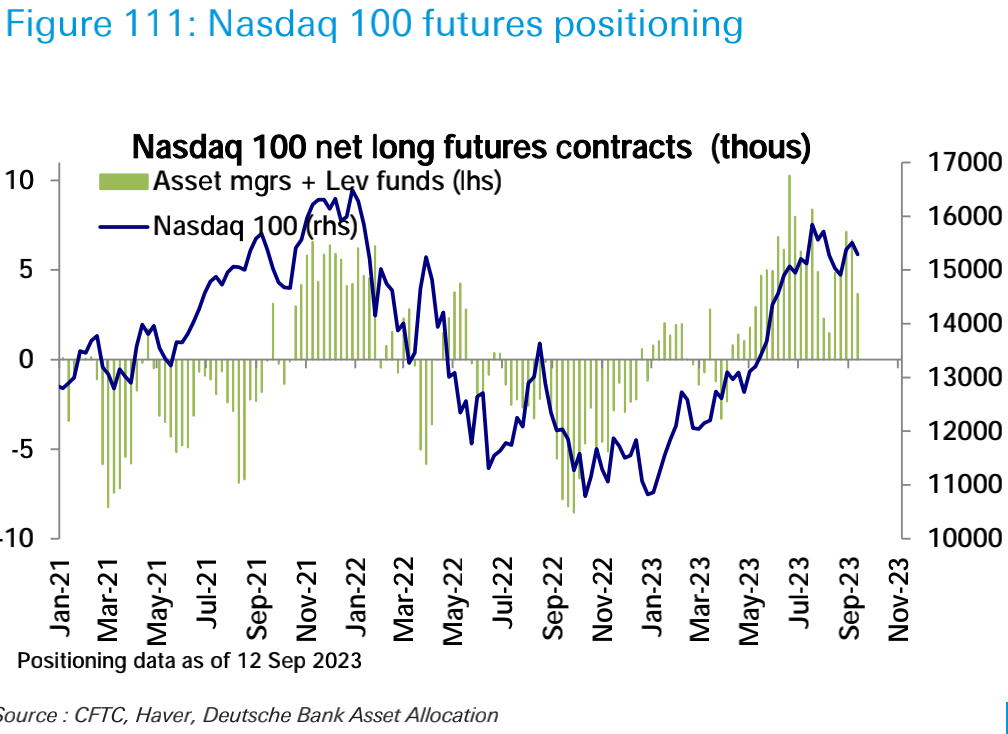
In the futures market, US stock futures remained relatively stable, with net long positions in S&P 500 futures reaching the highest level since February last year, but net long positions in Nasdaq 100 futures decreased: 
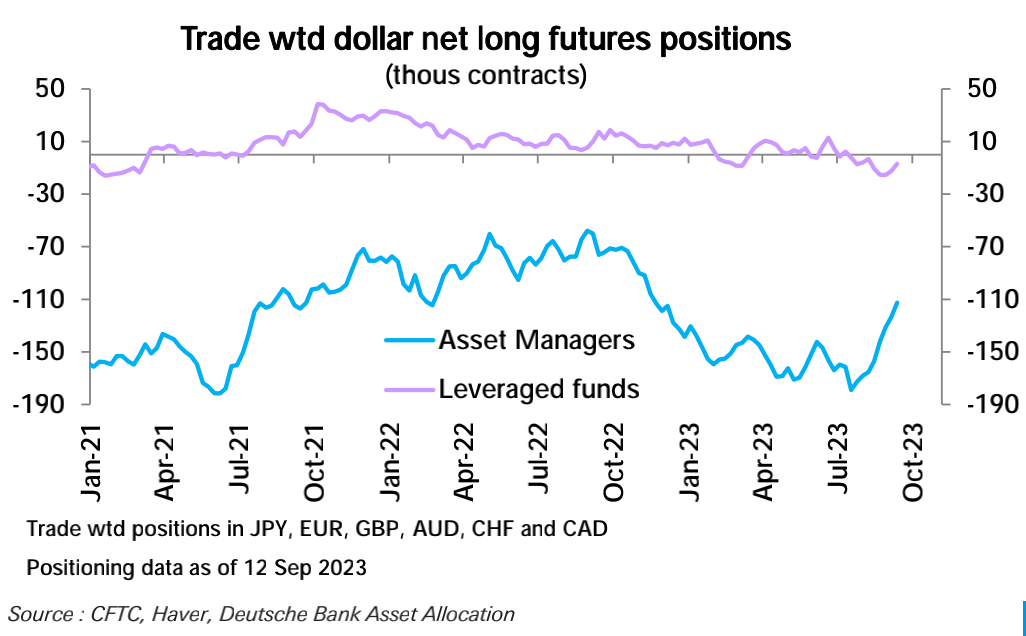
Net short positions in the US dollar have decreased for the fourth consecutive week and have now reached the lowest level since October last year, mainly driven by a decrease in net short positions by large asset managers: 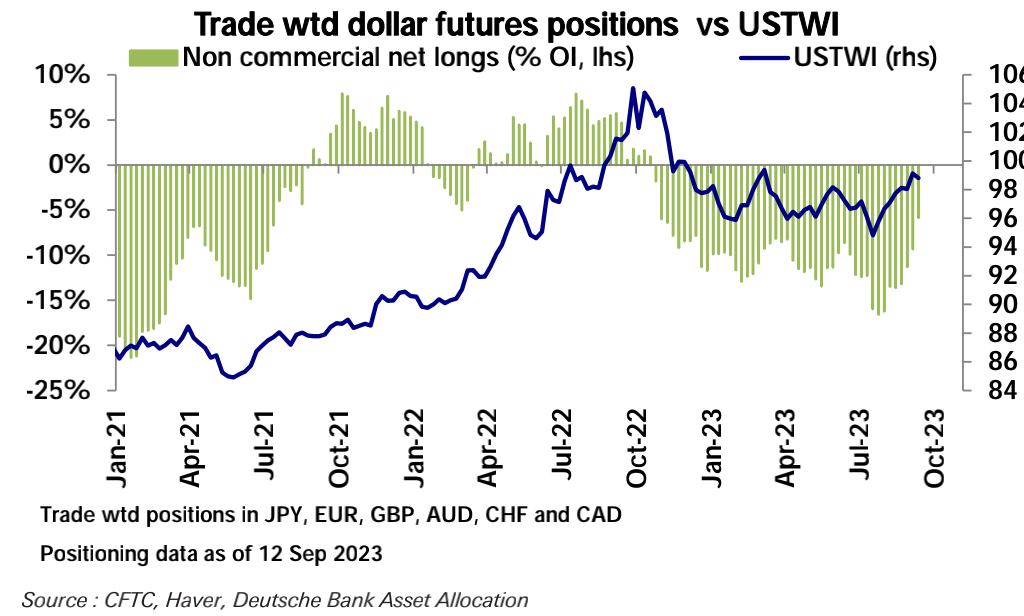
In terms of commodities, net long positions in crude oil have reached the highest level since October last year: 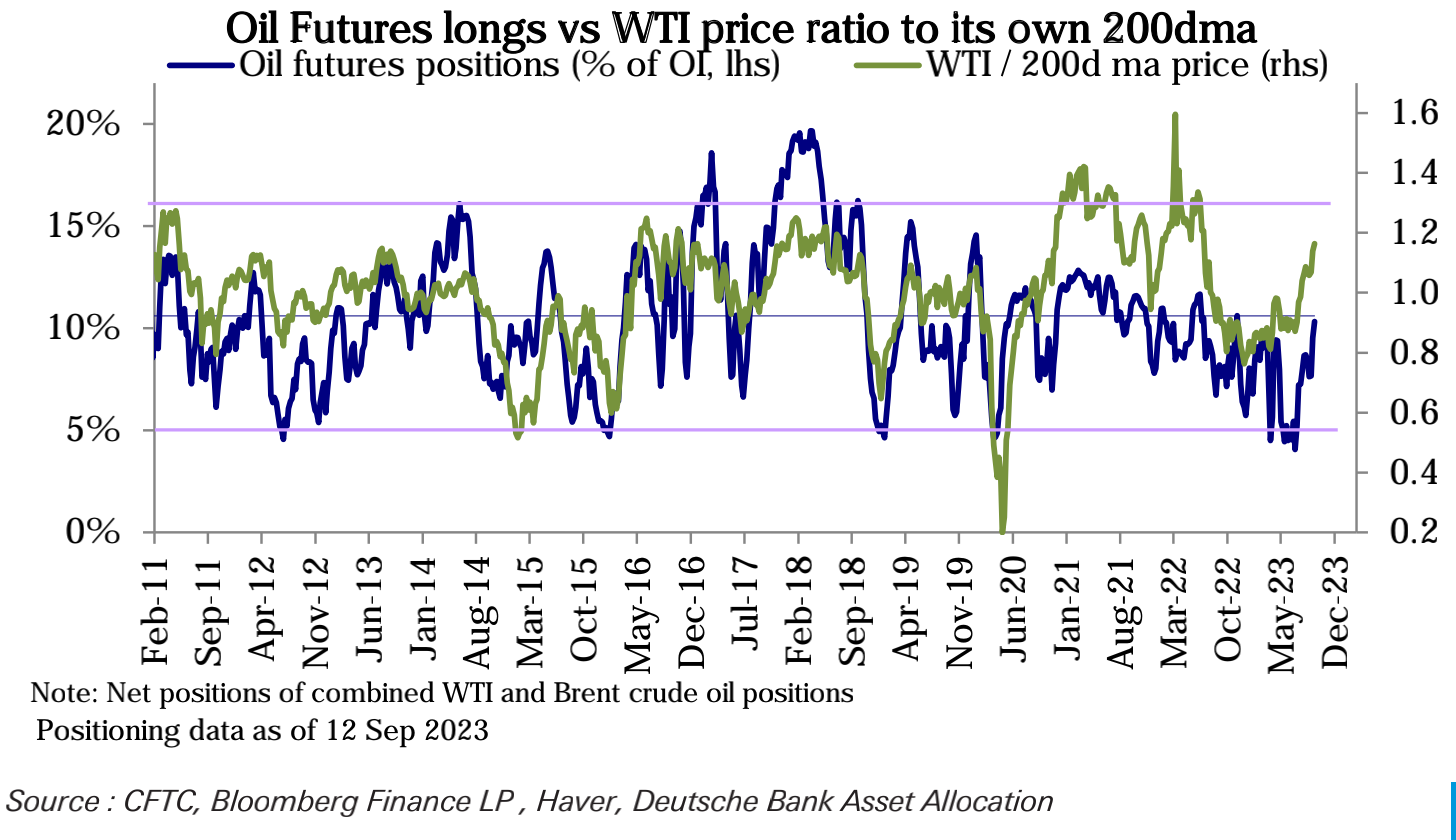
However, net long positions in gold have decreased: 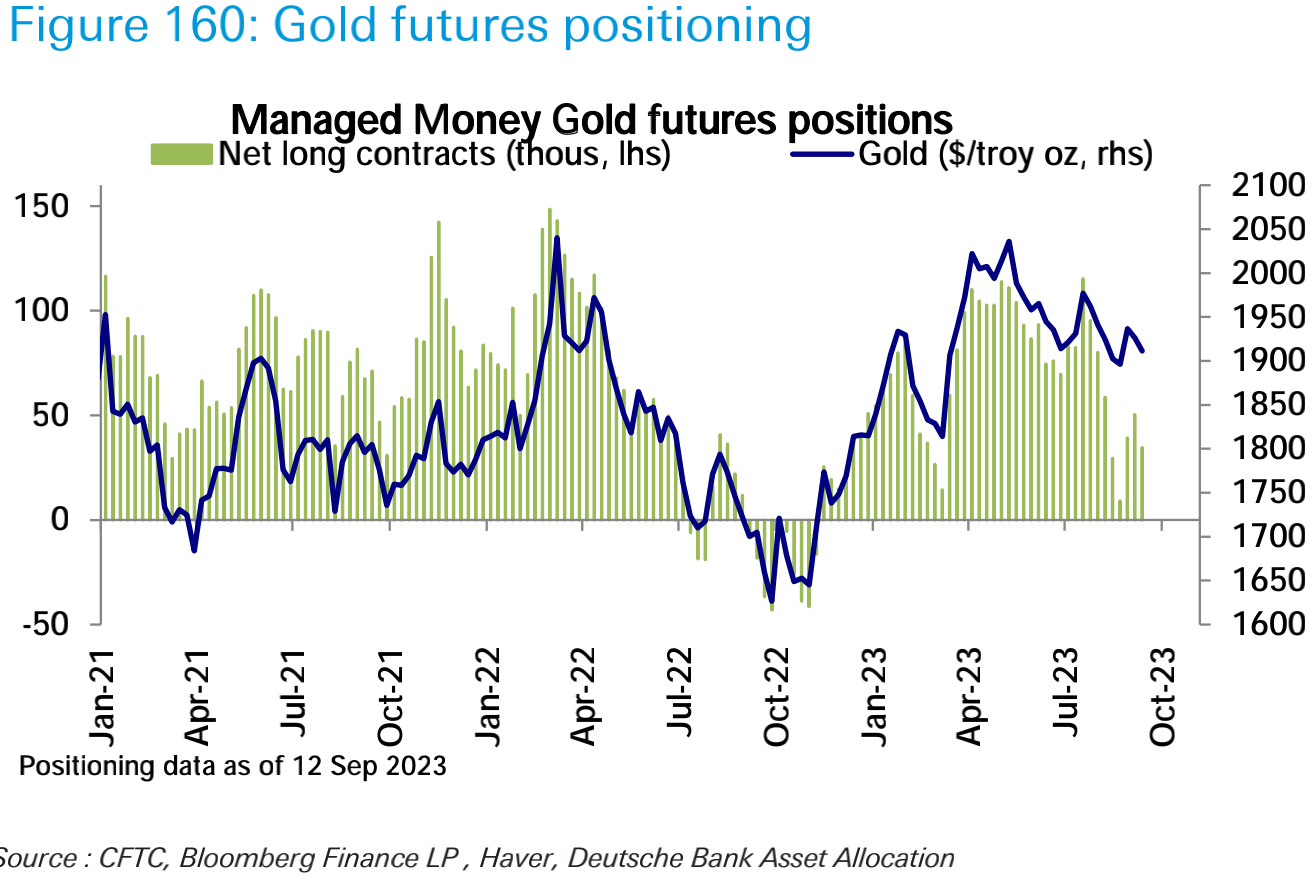
Net positions in copper have flipped from net long to net short: 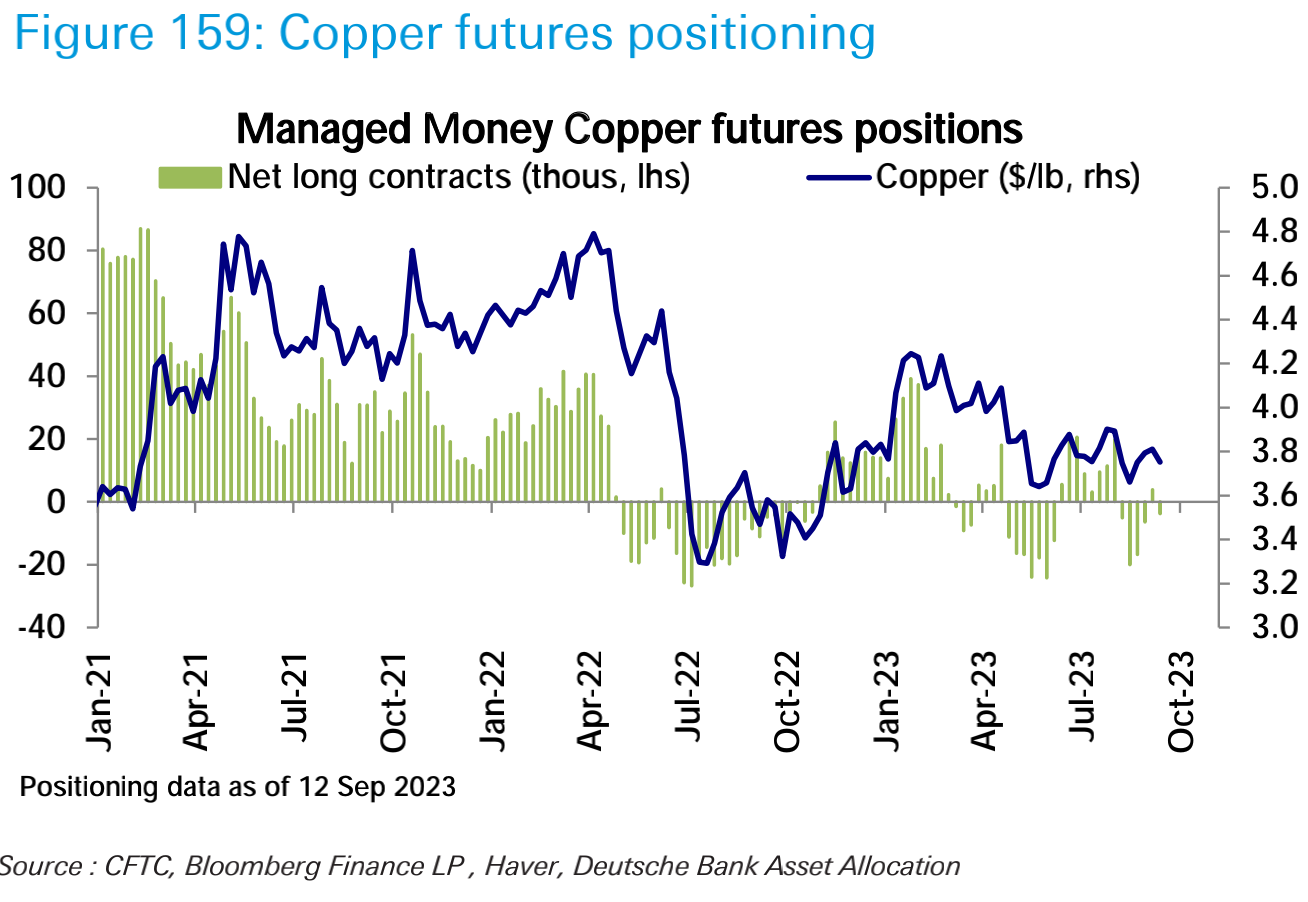
In terms of cryptocurrencies, centralized exchanges have seen a slight net inflow of $57 million in stablecoins over the past 7 days, bringing the total to $13.86 billion: 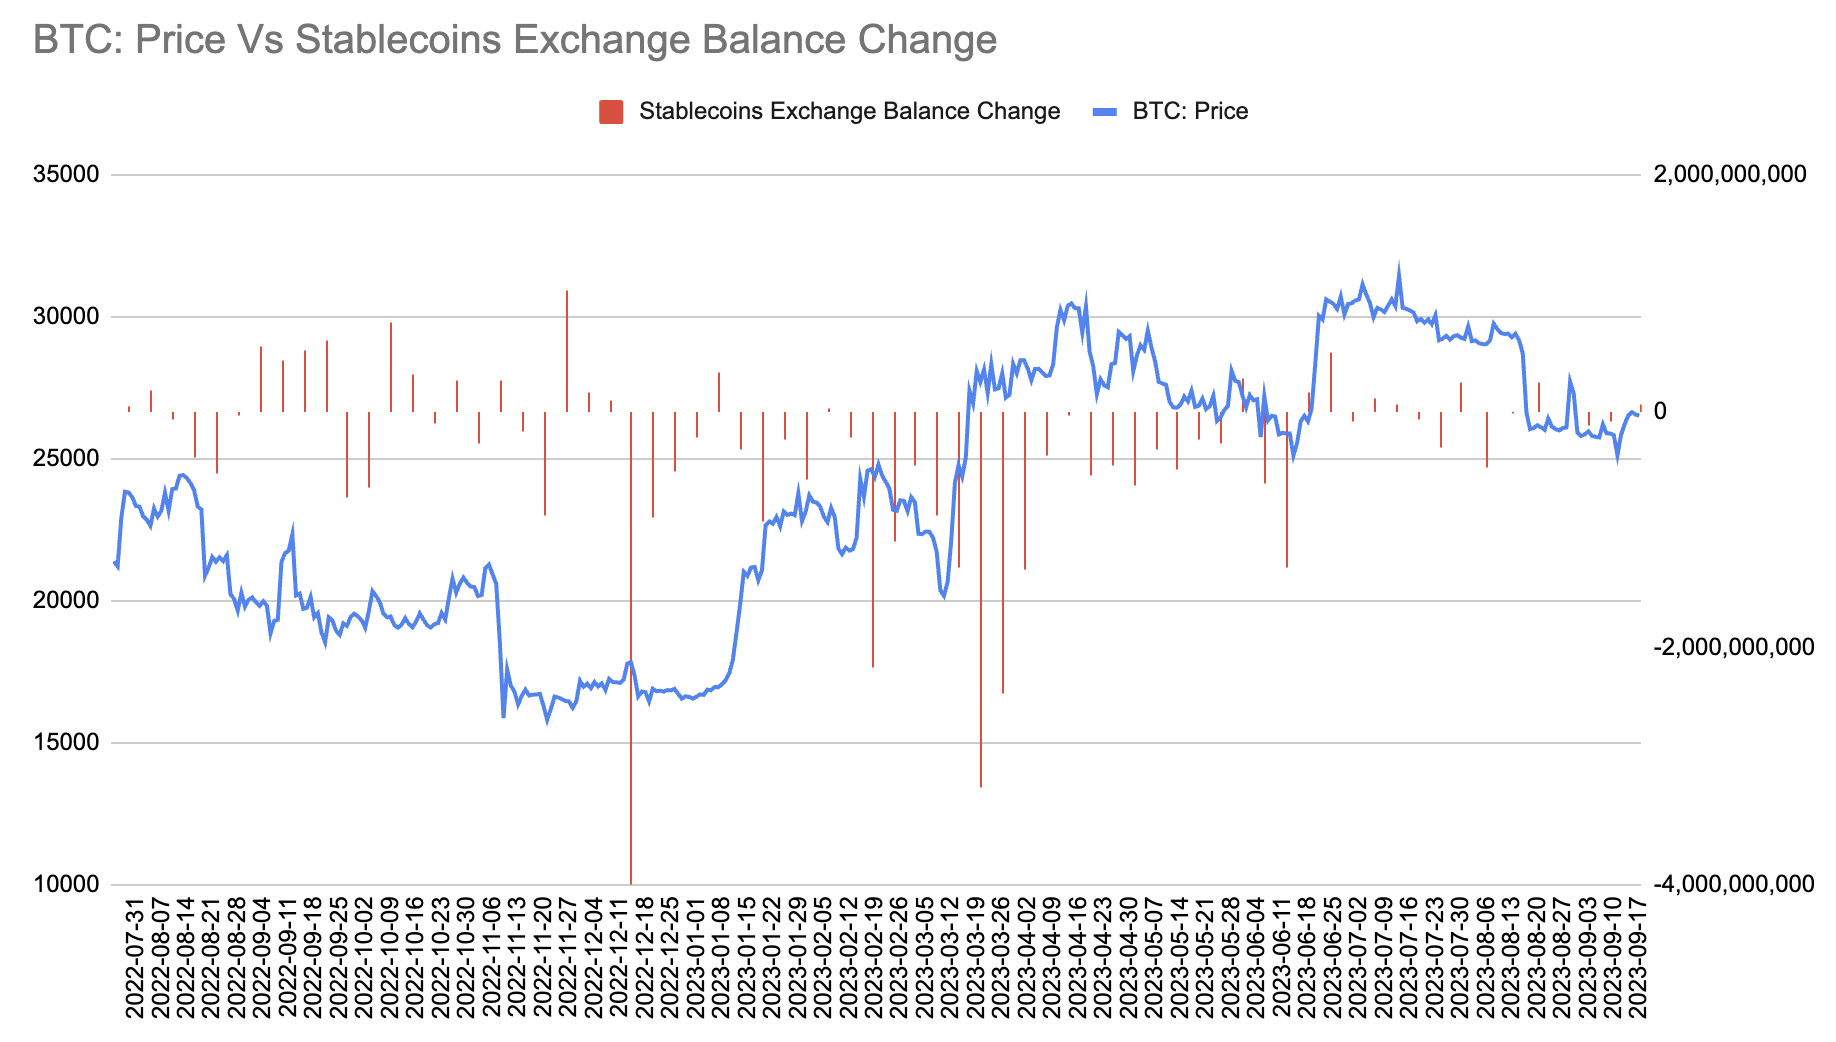
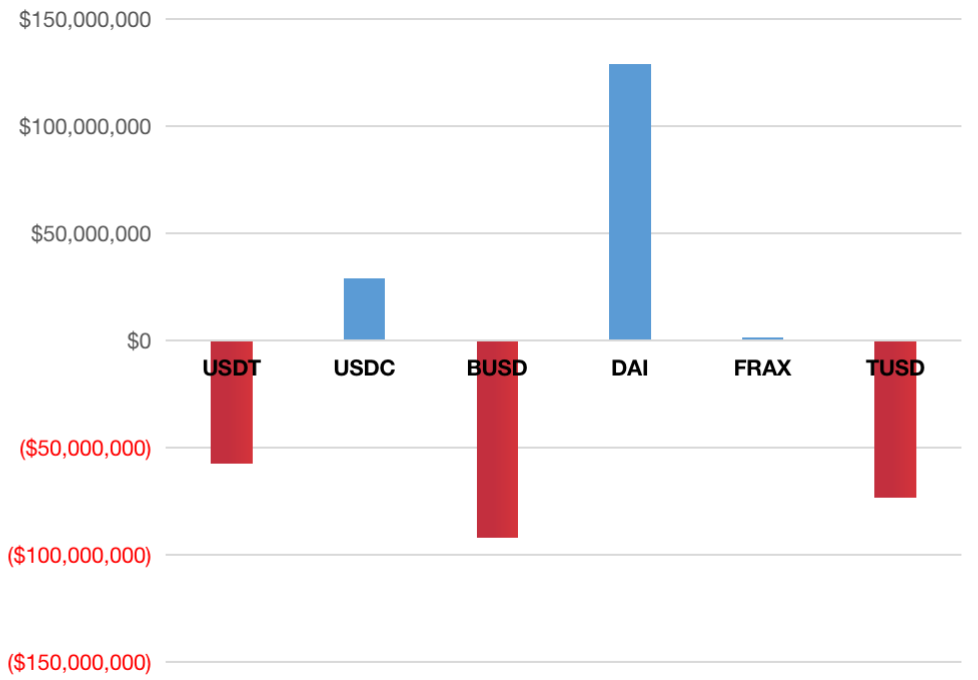
On-chain stablecoins have seen a net outflow of $92 million, bringing the total down to $124.3 billion. The outflow is mainly contributed by BUSD, USDT, and TUSD, while the inflow is mainly contributed by DAI and USDC: 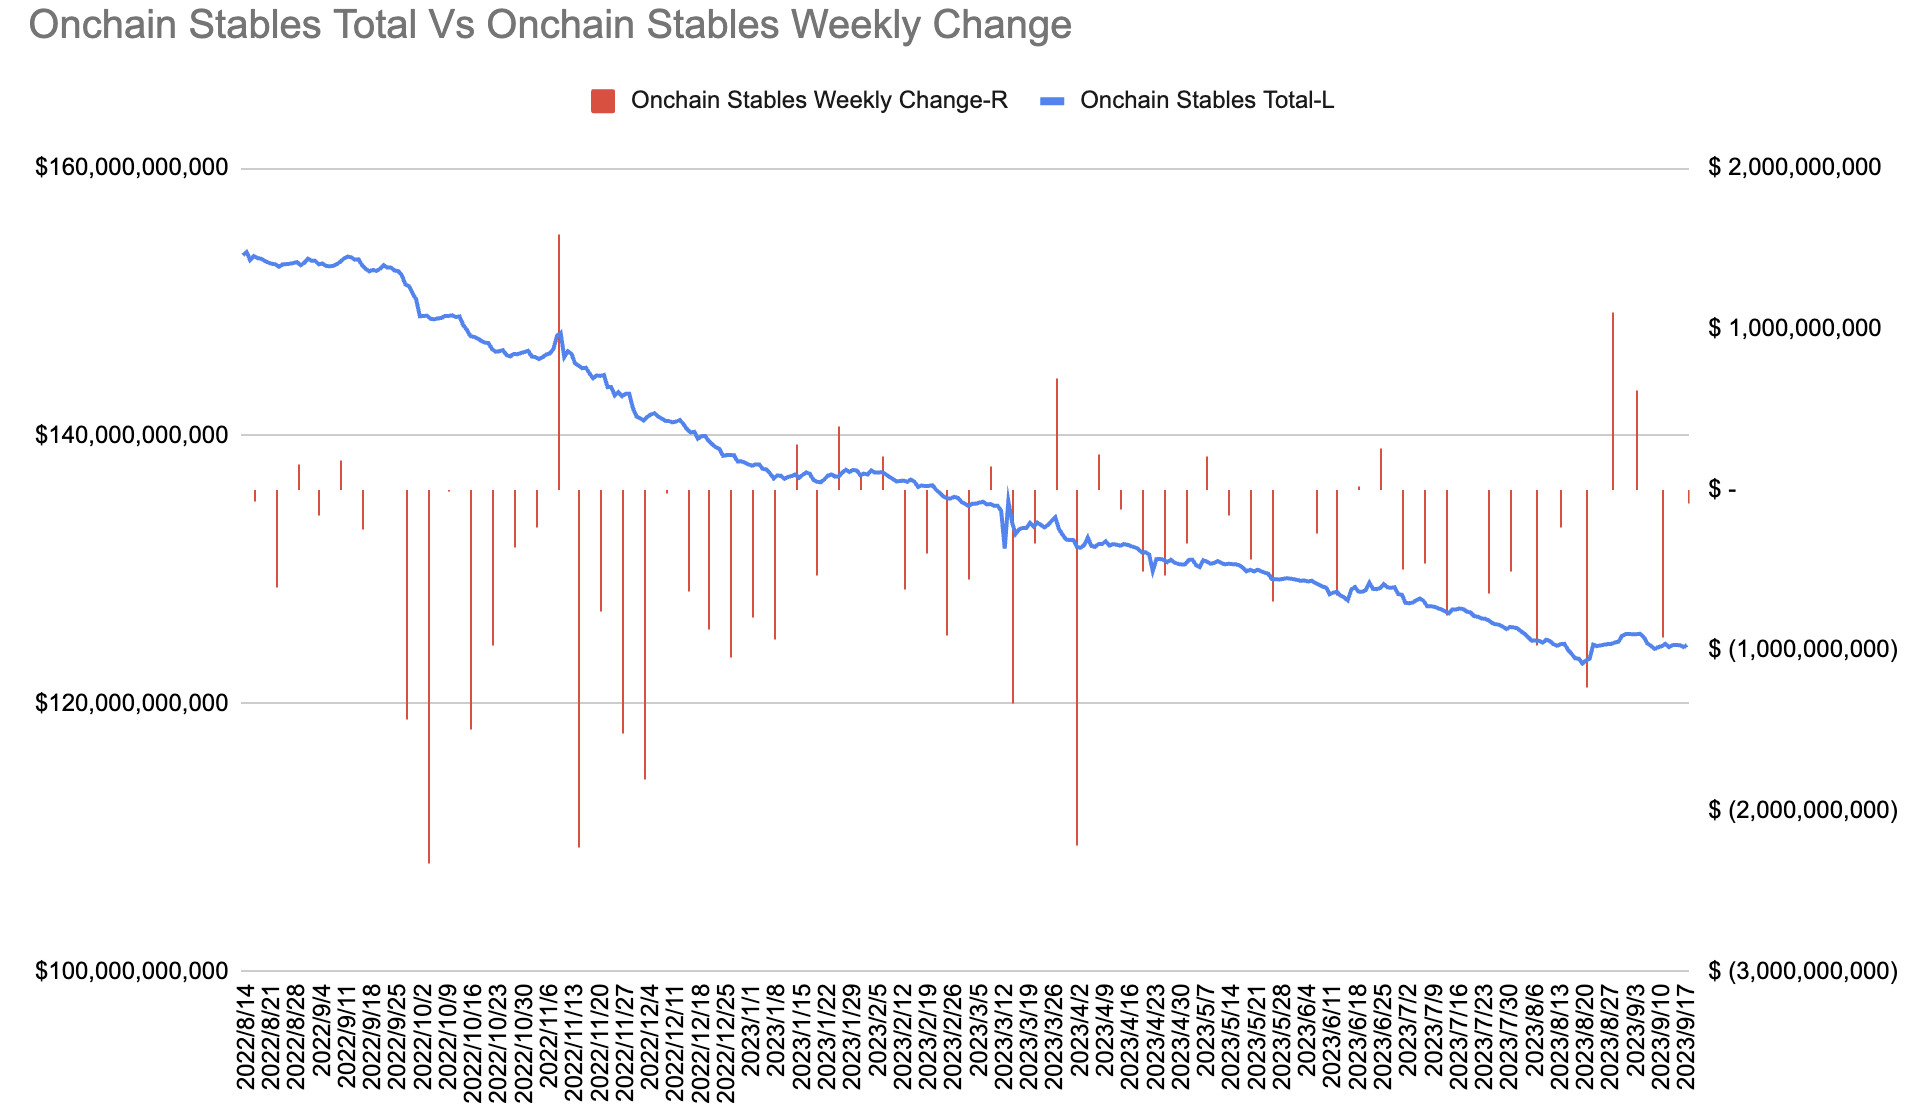
Investor Sentiment
Last week, the proportion of neutral views in the AAII survey rose to 36%, while the proportion of bullish views dropped to 34%, and the proportion of bearish views remained unchanged: 
The CNN Fear & Greed Index has remained relatively unchanged, staying around the neutral level of 51: 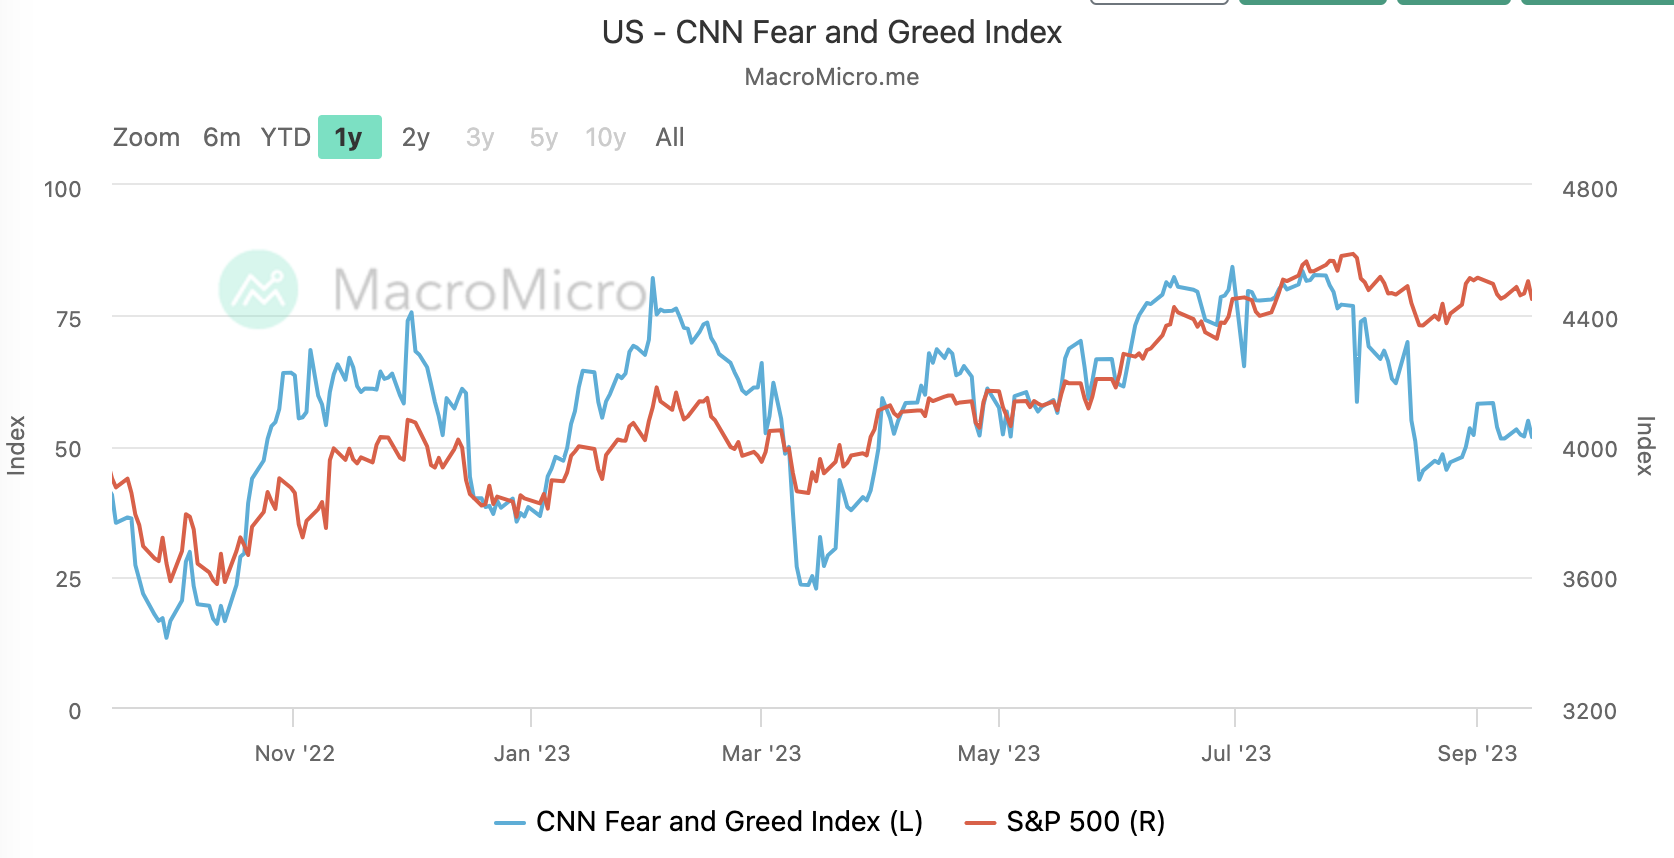
Goldman Sachs’ institutional positioning sentiment index has jumped significantly to 1.2, indicating a stretched range: 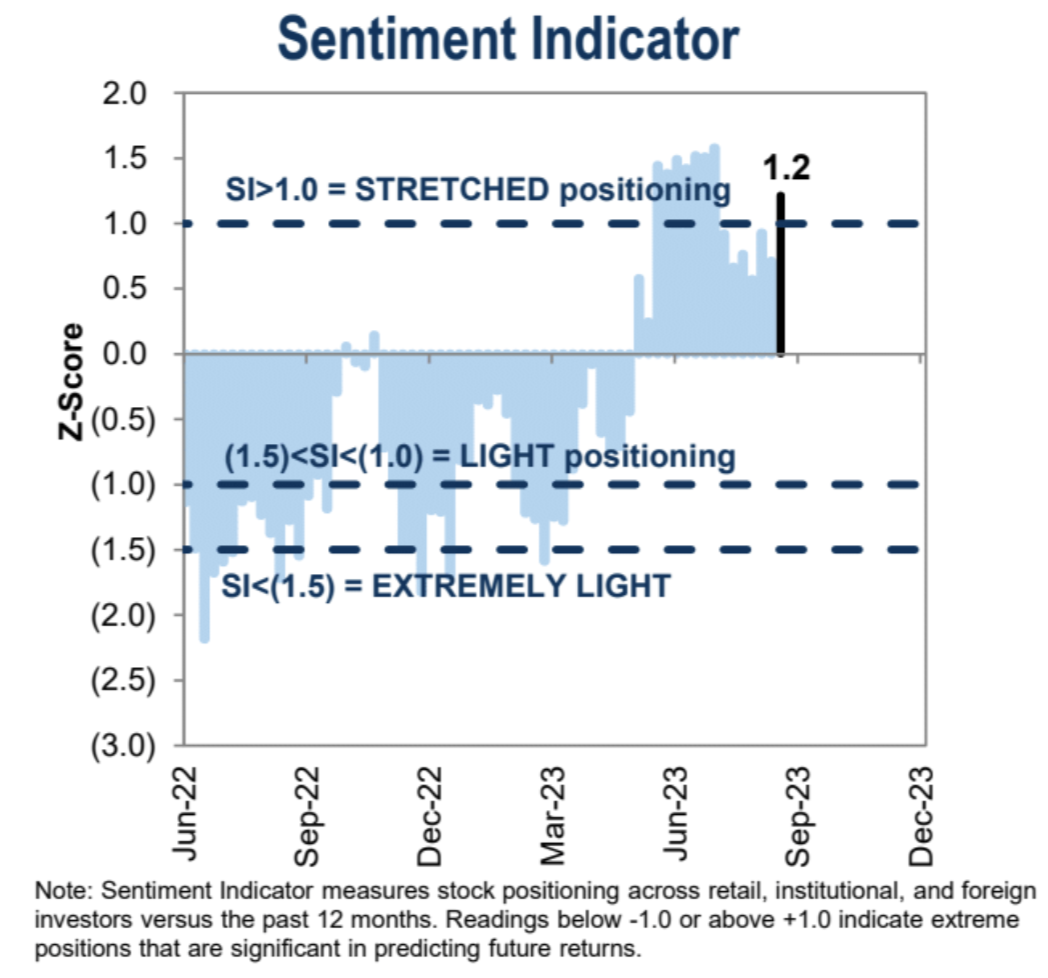
Focus for This Week
This week is a super week for central banks, with the collective appearance of the U.S. (unchanged), UK (expected +25bp), Switzerland (expected +25bp), and Japan (unchanged) central banks. The main focus will be on the Federal Open Market Committee (FOMC) meeting on Wednesday. The market generally expects the Fed to maintain stable interest rates after the rate hike in July, but will emphasize in its forecasts and communications that further tightening is still possible this year. There is little data this week, mainly focused on housing. It is unlikely to have a significant impact on the information from the Fed meeting.
The meeting statement may show mixed progress on the conditions for pausing further rate hikes, including signs of moderate economic growth and some improvement in inflation, but the labor market remains tight.
The economic forecast summary may show upward revisions to growth forecasts, especially for 2023, but a slight downward revision to inflation forecasts, considering that PCE figures have already reached 3.2% in June expectations. In terms of interest rates, the June Fed’s SEP showed that the final peak of the federal funds rate in 2023 was projected to be 5.6%, expected to drop to 4.6% in 2024, and further drop to 3.4% in 2025, with long-term rates at 2.5%. Given the progress of data in the past three months, the forecast of 5.6% for 2023 seems likely to remain unchanged or slightly downward, while the median rates for 2024 and 2025 may remain unchanged or slightly upward.
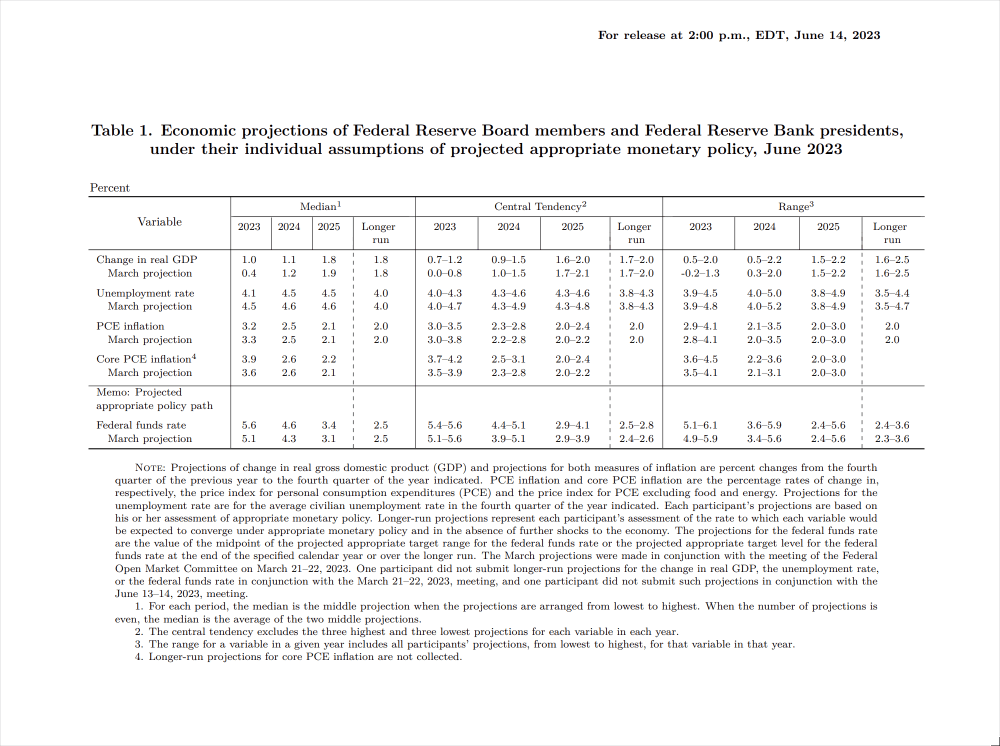
Although the long-term rate remained at 2.5% after the June meeting, the central tendency shifted from the range of 2.4%-2.6% to the range of 2.5%-2.8%. This suggests that the Fed may consider the neutral rate (the rate that neither stimulates nor restricts economic activity) to be higher than before, with a 2% inflation target implying a real interest rate of 0.5%.
Looking at the bond market, the yield of 30-year Treasury bonds is about 4.2%, minus the Fed’s inflation target of 2% to obtain a real interest rate of 2.2%, which is much higher than the Fed’s expectation. Therefore, the bond market is relatively aggressive in pricing, while the stock market’s decline in profit yield and increase in price-earnings ratio indicate that the stock market still does not believe that the Federal Reserve will maintain restrictive interest rates for a period of time.
Looking at the interest rate derivatives market, the short-term path is almost identical to that of the Federal Reserve, with the highest policy rate at 5.45%, and the interest rate expected to decline to around 4.6% by the end of 2024, as predicted by the SEP in June: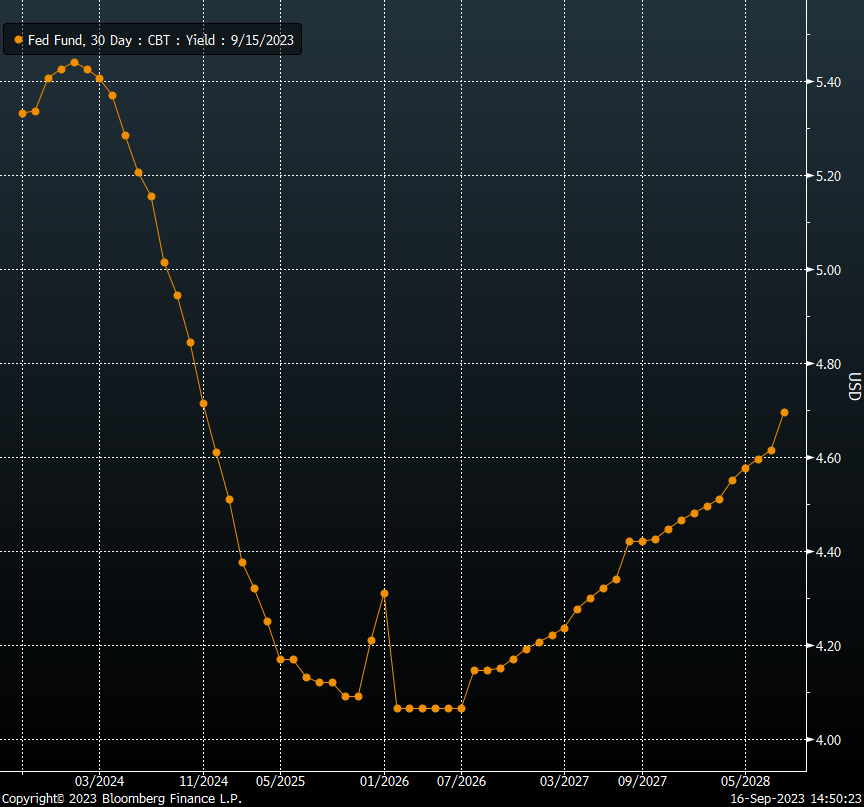
However, the long-term path is quite different. Unlike people’s intuitive impression of an “L” shape, the interest rate path in the futures market is “U” shaped. The futures market expects the nominal interest rate to rebound quickly to 4.7% after reaching a bottom in 2026, and then gradually increase to around 4.1% by 2026. This indicates a huge difference of over 100 basis points between the market’s long-term expectation and the Fed’s expectation of 3.4% for 2025, with the difference in long-term expectations exceeding 200 basis points.
Whom would you believe? People who think the Fed is wrong can take short positions in risk assets, while those who think the interest rate futures traders are wrong can take long positions.
In terms of press conferences, Powell is bound to emphasize the dependence of policy on data and be cautious about declaring victory over inflation, but he may take note of some initial progress in achieving labor market balance. It is unlikely that he will clearly state the timing of further interest rate hikes.
Why have officials been consistently cautious? The second round of inflation rebound has always been a concern for older officials who have experienced the 1970s. Young people who have not experienced this historical background may not be able to fully appreciate it, and this historical background will limit any potential magnitude of interest rate cuts: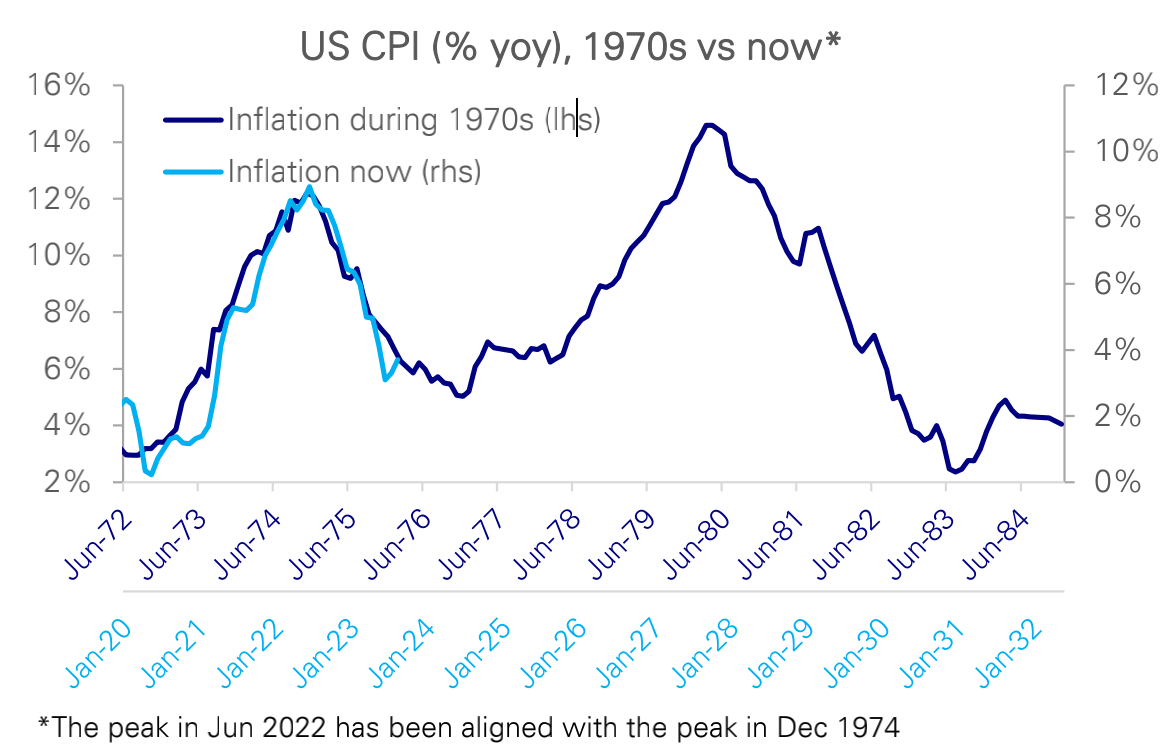
Of course, it is very difficult to try to predict the situation in the next month, let alone two or three years later. But the key point is that there is a discrepancy in the expectations of the stock market and the bond market regarding future interest rate trends. The stock market seems to be betting that the Fed will cut interest rates multiple times in the future, while the bond market has different expectations. As the Fed updates its information next week, whether there will be variables in the expected significant interest rate cuts in the coming years is the most important point to watch. Whether it is the bond market being pulled back or the stock market being pulled back, this is the core game in the market.
Like what you're reading? Subscribe to our top stories.
We will continue to update Gambling Chain; if you have any questions or suggestions, please contact us!
