In 2023, people have been receiving various positive and negative news about the regulation of the cryptocurrency industry, and the performance of altcoins and DeFi has also been influenced by these news. In the past week, MKR and COMP have performed well, and in this article, we will explore how to extract token price expectations from the changes in DEX liquidity.
Summary
-
Some positive developments in the cryptocurrency industry and the growth of DeFi have sparked investor interest in DeFi tokens.
-
The rise in popularity of DeFi tokens has caught the attention of liquidity providers, who have increased liquidity in their respective pools, indicating their optimism about the trading and price prospects of these tokens.
- Halving Narrative and Reflexivity LTC Falls Instead of Rising, Can BTC Halving Welcome a Bull Market?
- Binance Research Cryptocurrency native perpetual futures account for over 90% of DeFi derivative TVL, with dYdX and GMX accounting for 64.9% of perpetual futures market trading volume.
- August Outlook for the Cryptocurrency Market Layer2 and Hot Projects as Catalysts
-
Further analysis of the distribution of trading volume on Uniswap suggests that a large portion of the trades are conducted by MEV bots, which primarily focus on the ETH-stablecoin pairs.
Strong Performance of DeFi Tokens
In the past few months, the altcoin market has been influenced by both positive and negative news:
-
In early June, the US SEC classified 68 cryptocurrencies as unregistered securities, dampening interest in altcoins other than Bitcoin and Ethereum. Even before this announcement, many tokens were already performing poorly.
-
The applications for Bitcoin spot ETFs submitted by financial giants like BlackRock and Fidelity have boosted market sentiment, spreading to the realm of cryptocurrencies beyond Bitcoin.
-
In addition, the judgment in the Ripple Labs v. SEC case in mid-July ruled that the cryptocurrency company’s sale of XRP on public trading platforms did not violate federal securities laws, sending a positive signal to other US cryptocurrency projects and the entire cryptocurrency industry. The victory of XRP has ignited hope among altcoin investors and increased confidence in the cryptocurrency market facing further regulatory actions.
Among them, DeFi tokens have performed the strongest, with the DeFi Price Index rising 56% since its low point on June 11. In comparison, other markets such as GameFi and Staking have performed poorly.
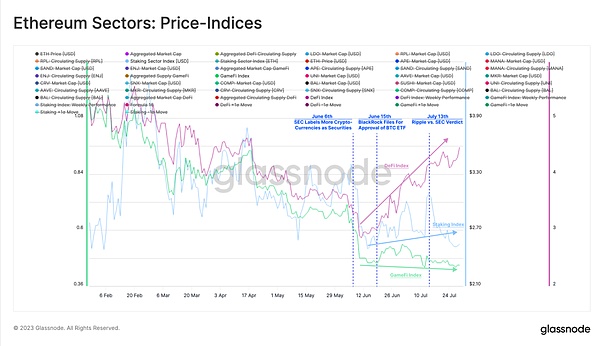
Figure 1: Price Index (Ethereum ecosystem)
The DeFi Index consists of the top 8 DeFi tokens by market capitalization and has maintained an upward trend for nearly two months.
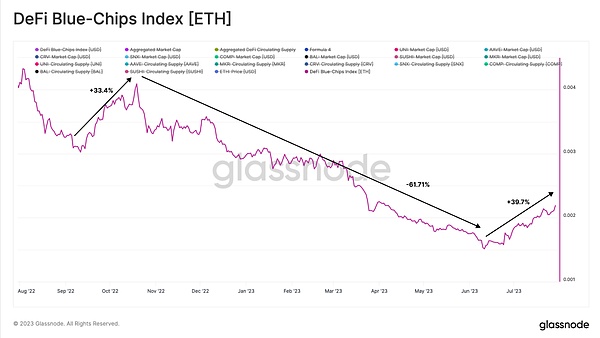
Figure 2: Blue-chip Index of DeFi
When we observe the top eight DeFi tokens separately, we find that two tokens stand out and become the main driving force behind this upward trend: MKR and COMP. Upon closer examination, we can see that their performance is likely closely related to the fundamentals of recently launched projects rather than the overall market development.
On June 28, Compound founder and CEO Robert Leshner announced his departure from the lending protocol and the launch of a new project focused on creating regulated financial products that connect the traditional market with the blockchain ecosystem. After this announcement, COMP surged 83% in a week.
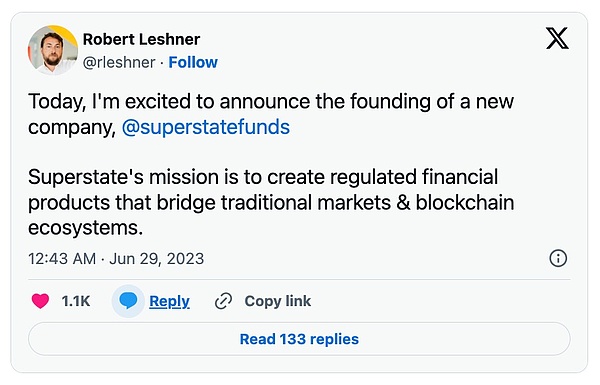
Figure 3: Robert Leshner announces
Shortly thereafter, MakerDAO launched its smart burn engine, which is a buyback plan that uses over $50 million (19.6 million US dollars) of DAI owned by the protocol to repurchase MKR and add it to Uniswap V2 with DAI to form an LP, resulting in a 43% increase in MKR price this week.
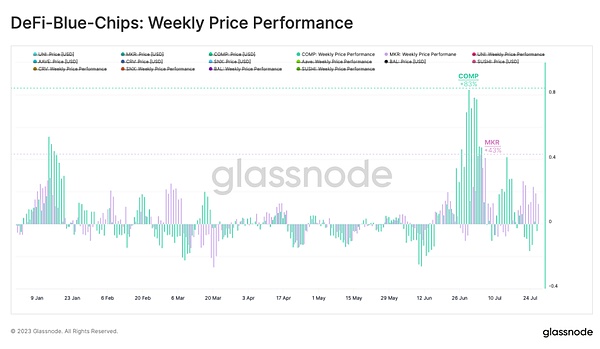
Figure 4: DeFi Blue Chip Index: Weekly Price Performance
We analyzed the DEX and CEX trading volumes of the top eight DeFi tokens and found that people are showing renewed interest in DEX. The proportion of DEX trading volume has increased from 3.75% at the beginning of June to 29.2% today, approaching the peak in the second half of 2022.
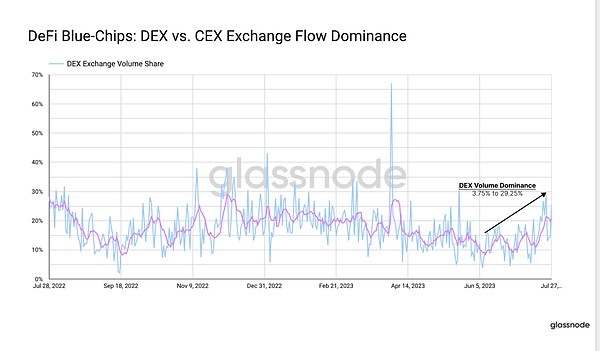
Figure 5: DeFi Blue Chip Index: DEX vs CEX Trading Volume Proportion
Distribution of Uniswap Trading Volume
With the continuous increase in DEX activity, we can investigate how recent events have affected DEX activity and the inherent impact on stakeholders. Our first focus is on one of the leading DEXs: Uniswap, which has been one of the major consumers of gas consumption in the past week.
The current trading volume of Uniswap on the Ethereum mainnet is $5.57 billion per week, significantly lower than previous years. In early 2023, there was a surge in trading volume due to the interest in LST (Liquidity Staking Tokens), and the trading volume of “Memecoins” also briefly increased but then returned to normal.
From this perspective, the recent BTC ETF application and SEC-Ripple cases did not significantly increase Uniswap trading activity.
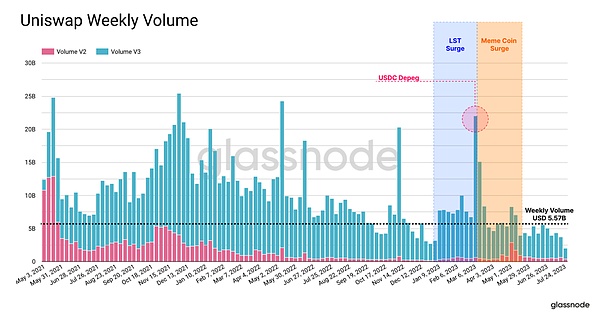
Figure 6: Uniswap Weekly Trading Volume
Next, let’s look at the distribution of Uniswap trading volume on L2. It is clear that a considerable portion of the trading has moved from the Ethereum mainnet to Arbitrum, with Arbitrum accounting for as much as 32% of the trading volume in March and maintaining a high level in June and July. This is also one of the reasons for the lower trading volume of Uniswap on the Ethereum mainnet.
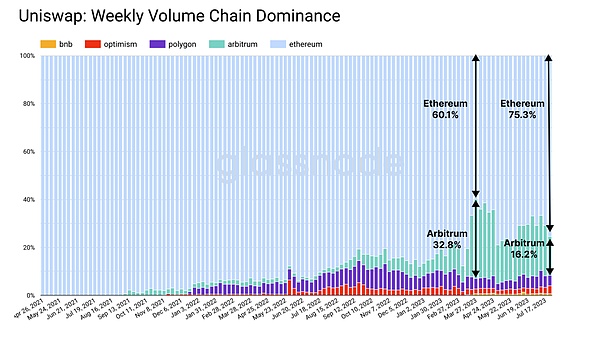
Figure 7: Uniswap: Weekly Trading Volume Proportion on Different Chains
MEV Robots Account for 70% of Trading
Another way to understand the background of Uniswap trading activity is to look at the types of traders executing the trades. Since 2019, we have seen various types of MEV (Miner Extractable Value) robots, which are automated programs that monitor the mempool to identify trades that can gain additional profits. For better analysis, we only focus on two types of MEV robots: arbitrage bots and sandwich bots.
-
The goal of arbitrage bots is to profit from different prices of the same asset across different trading platforms.
-
The sandwich bot works by front-running the target trader’s (assume a buyer) trade before it is executed, causing the price of the asset to rise. The sandwich bot then sells the asset again to narrow the price difference, maximizing the value for both parties.
The following figure shows the proportion of robot trading volume and manual trading volume on Uniswap (on Ethereum).
We observed that in the total trading volume, Sandwich Bots generally account for more than 60% of the daily trading volume. Since the beginning of this year, the proportion of arbitrage robot trading volume has decreased from about 20% to 10%. At the same time, since early July, the proportion of trading volume created by manual traders has increased by 30%, consistent with the DeFi Token frenzy period.
Please note: Different types of robots will generate different trading volume and transaction volume. For example, Sandwich Bots execute at least two transactions, and the trading volume created in one transaction is twice that of manual traders.
Figure 8: Proportion of trading volume for different types of transactions
Due to the possibility of different types of robot attacks causing different degrees of inflation of trading volume, the daily number of transactions divided by trader type provides another comparative perspective.
We can see that manual traders are very active during major events such as USDC decoupling or Memecoin frenzy. With the increase in price fluctuations and the influx of “target traders”, arbitrage robots and Sandwich Bots have also become active, and their activity has tripled during the period of increasing manual trading volume.
Figure 9: Uniswap: Proportion of trading volume for different types of transactions
The following figure shows the preferred tokens and fund pools for each type of trader. It can be seen that all three types of traders prefer the largest and most liquid trading pairs ETH-USDC and ETH-USDT.
Figure 10: Uniswap: Different types of traders and their proportions
Liquidity Pool performance reflects price expectations
After the launch of Uniswap V3, liquidity providers can allocate liquidity within a specified price range in the pool. Instead of dispersing liquidity over an infinite price range, it is better to concentrate liquidity more effectively within the price range with the highest expected trading volume (to collect fees).
Figure 11: Uniswap V3 price range
Since the announcement of the MakerDAO buyback plan, the most successful liquidity pool for Maker on Uniswap V3 is the MKR/WETH pool, and its liquidity has increased significantly.
Although MKR accounts for the majority in this pool, the liquidity depth of WETH has increased by more than 700%. This indicates that liquidity providers are signaling that the trading volume of the MKR-WETH trading pair will increase.
Figure 12: MKR-WETH depth
After studying the composition of this liquidity pool, we can clearly see that the proportion of WETH has increased and currently accounts for 21.2% of the total. This indicates that more and more traders are buying MKR with WETH, which means that the market demand for MKR has increased significantly since early June.
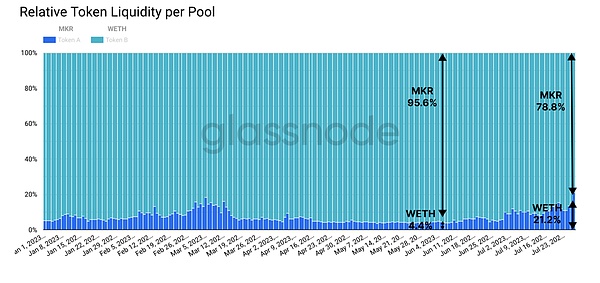
Figure 13: Liquidity Depth of Two Tokens
Can the liquidity pool of Uniswap indicate the price development of tokens? By analyzing the liquidity of MKR-WETH, we found that liquidity increases when the price ratio of MKR/ETH is much higher.
As liquidity providers add their liquidity to a higher price range, they can be seen as a kind of out-of-the-money option on gas fees at higher price points to some extent. If we assume that liquidity providers are rational profit-seekers, the changes in their liquidity may provide price signals similar to those provided by options markets, obtaining predictions of the volatility and price range of the relevant tokens.
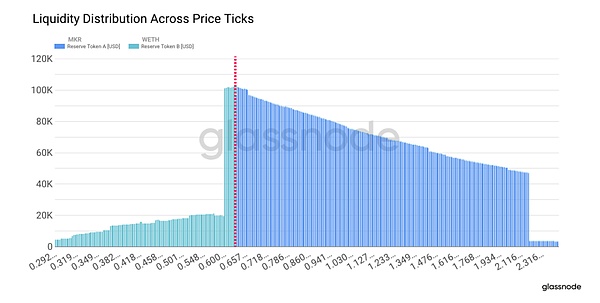
Figure 14: Liquidity Distribution in Price Fluctuations
Summary
In 2023, positive and negative news about digital asset regulation has been appearing repeatedly. In recent weeks, DeFi tokens, led by MKR and COMP, have performed particularly well. However, after analyzing the trading activities on Uniswap, the increase in DEX trading activities does not seem to have affected the price movements of these tokens.
One possible explanation is that the proportion of trading volume on Layer 2 solutions such as Arbitrum is continuously increasing, and the number of human traders has also decreased. Due to fewer manual trades, arbitrage and sandwich bot activities are also less frequent.
As for MKR, there has been a significant increase in liquidity providers for the Uniswap pool, which indicates a certain expectation for increased trading volume. Therefore, we propose a concept that the distribution of liquidity can provide expected signals for the price range of relevant tokens.
Article source: https://insights.glassnode.com
Original author: Glassnode, Alice Kohn
Original article link: https://insights.glassnode.com/the-week-onchain-week-31-2023/
Like what you're reading? Subscribe to our top stories.
We will continue to update Gambling Chain; if you have any questions or suggestions, please contact us!
