Author | Matt Hu, Blofin CEO
Griffin Ardern, Blofin Macro Trader
Wu said the blockchain authorization release
“Institutional Darling”: Why BTC?
- DeFi tokens show signs of a turnaround, is there an opportunity for $SNX?
- Opinion Meme coins like PEPE and DOGE are no joke.
- In-depth Explanation of 6 Profit Strategies for NFTs and 19 Noteworthy Trader Addresses
In the contemporary financial system, central banks are the source of liquidity in the financial market. When central banks start to release/contract liquidity, changes in liquidity are reflected in real-time in the price changes of bonds, commodities, foreign exchange, and financial derivatives, as well as in the changes in stock indices. Bitcoin, as a new member of the “macro club,” has not been around for a long time. However, the US government holds the most Bitcoin, and the inclusion of Bitcoin in investment portfolios is gradually increasing, with top asset management institutions such as Fidelity among the issuers of these ETFs.

Bitcoin ETF list and holdings, as of July 17, 2023. Source: Bitcoin Treasuries
Compared to other cryptocurrencies, BTC is truly decentralized. The deeds of Satoshi Nakamoto are well known, but no one knows “who he really is.” However, “who he is” may no longer be important; the Bitcoin network has matured, and anyone’s influence on the Bitcoin network can be negligible – this “true decentralization” is also one of the characteristics of a qualified macro investment target. Gold and minerals are created by the universe; agricultural products are produced by nature; Bitcoin comes from the cyber universe composed of algorithms and information.
Because BTC is a product of the cyber universe, the central bank’s liquidity control magic is ineffective. The USD price of BTC may change, but 1 BTC is always 1 BTC. Native crypto investors use BTC as an investment and store of value to counter inflation in fiat currencies.
For fund managers from traditional markets, they value the role BTC plays in diversifying risk. The price performance of BTC and gold has never reached a “strong correlation” level, and its correlation with US stock indices also fell to around 0 in 2023. At the same time, since BTC belongs to a completely different asset class, this means that BTC can to some extent diversify the overall risk of an investment portfolio. The compliance of BTC is also widely recognized, greatly reducing the legal risks of investing in BTC.

Correlation between BTC and gold in the past 90 days from July 2020 to present. Source: CoinMetrics

Correlation between BTC price and US stock indices from January 2021 to present. Source: Block Scholes
Macro hedge fund managers are more concerned with liquidity. Their strategies typically invest in bonds, foreign exchange, commodities, stock indices, and prefer to trade through derivatives rather than spot-based. “Liquidity” is the core reason – macro trading requires accurate timing of liquidity changes and the ability to enter and exit at the fastest speed and lowest cost. As an emerging asset, with the global liquidity of the Bitcoin network and the support of abundant derivatives, the liquidity of BTC can rival that of foreign exchange.
More importantly, due to the high speed and low transaction costs brought about by the Bitcoin network and the cryptographic infrastructure, traders can deploy and withdraw liquidity in seconds without constantly negotiating with numerous third-party institutions over the phone or waiting for bids to be accepted in illiquid over-the-counter trading systems. These advantages make BTC more sensitive to market sentiment and macroeconomic events, reflected in its price fluctuations and volatility changes.

Bitcoin price changes from January to July 2023. Source: blofin.com
Note the purple sections in the graph, corresponding to the March banking crisis, May Fed rate hike, and the submission of BTC spot ETF around July.

BTC DVOL volatility index compared to realized volatility levels from May 2021 to present. Source: Amberdata Derivatives
It is not difficult to see that BTC’s volatility index is more sensitive to macroeconomic changes.

BTC DVOL volatility index compared to the level of “volatility of volatility” in August 2022. Source: Amberdata Derivatives
Compared to volatility, BTC’s volatility changes are faster and more sensitive.
In conclusion, whether it’s crypto believers, traditional market fund managers, or traders from macro hedge funds, BTC satisfies the requirements of different types of investors in terms of functionality, compliance, risk management, liquidity, and trading. It is difficult to find a macro target that can meet all these needs at once; in other words, BTC is a natural macro trading target.
ETH: A “software company” with a P/E ratio of 312.58
Crypto market investors like to compare BTC and ETH; in terms of market capitalization, BTC and ETH are ranked first and second on the cryptocurrency market cap rankings, and every crypto trader will deal with these two cryptocurrencies. However, investors from traditional markets are more cautious about ETH. Regardless of the potential compliance risks of ETH, considering the influence of Ethereum’s founder and developers on the development of the Ethereum blockchain, as well as Ethereum’s “smart contract as a service” model, it is more like a “software company” similar to IT giants like Amazon and Microsoft, rather than a “pure liquidity container” like the Bitcoin network.
In fact, some researchers and traders are already interpreting ETH using a framework based on corporate finance:

Ethereum income statement. Source: artemis.xyz
Therefore, it seems reasonable to analyze ETH using a framework based on fundamental analysis of stocks. Fortunately, due to the transparency of the blockchain itself, obtaining real-time supply and price of ETH is not difficult. Similarly, with the efforts of researchers such as Sam Andrew, we have also obtained the financial situation of the Ethereum network in a feasible manner. Let’s estimate the current P/E ratio of Ethereum together:
Since the introduction of PoS to ETH, the total profit of the Ethereum network (in USD) from the fourth quarter of 2022 to the second quarter of 2023 is: (3,959*1,301) + (79,210*1,589) + (227,147*1,861) = 553,735,916 USD, equivalent to an annualized return of approximately 738,314,555 USD;
The spot price of ETH (as of July 17th) is approximately $1,920;
The real-time supply of ETH (as of July 17th) is approximately 120,201,013;
Therefore, the P/E ratio of ETH = 1,920 / (738,314,555 / 120,201,013) = 312.58.
312.58! This is an amazing P/E ratio. We have attached the P/E ratios of the Magnificent 7 (the seven largest tech stocks by market capitalization) in the U.S. stock market for comparison*:
AAPL: 32.38
AMZN: 164.24
ETH: 312.58
GOOGL: 27.93
META: 38.32
MSFT: 36.92
NVDA: 207.62
TSLA: 82.76
*: All P/E ratios are based on the closing prices on July 14th. The P/E ratio of ETH is based on the average price on July 17th.
Undoubtedly, Ethereum, as a “software company,” has significantly exceeded our original expectations. Considering its non-dividend nature and its high-speed growth after transitioning to PoS, its high P/E ratio is similar to NVDA with AI support. And compared to the P/E ratio of AMZN, as a core infrastructure provider in the crypto industry, the high P/E ratio of ETH is not difficult to understand. Overall, investors have given a higher valuation to ETH, expecting the unlimited possibilities of ETH’s future development.
However, when Ethereum can be fully consistent under the company’s logic, BTC and ETH have officially taken different paths.
Parting Ways
Under the narrative of “Crypto 3.0”, where will BTC and ETH go?
BTC: Crypto Is Macro
Undoubtedly, the price of BTC will depend on the macroeconomic conditions and the macro situation within the crypto market. Therefore, for BTC, interest rates and market share will be important influencing factors. Interest rates affect profit expectations, while market share affects market size.
• From the interest rate market perspective, the Federal Reserve will not cut interest rates in the next six months; the European Central Bank will not weaken under the threat of high inflation. The above situation means that high interest rates will continue to suppress the performance of BTC. However, there are also some potential positive factors supporting the price of BTC, such as the possible listing of BTC spot ETF.

Latest possible interest rate path of the Federal Reserve, as of July 17, 2023. Source: CME Group
• In addition, the internal allocation of liquidity in the crypto market will also affect the price and market value of BTC. From early 2021 to the end of 2022, influenced by the bull market and the “altcoin season”, the market share of BTC gradually declined from over 60% to between 40% and 45%. Subsequently, benefiting from institutional buying frenzy and liquidity regression, the market share of BTC rebounded from January 2023. As of July 2023, the market share of BTC is approximately 50%.

Changes in the market share of mainstream cryptocurrencies as of July 17, 2023. Source: Coinmarketcap
• When the interest rate is 0%, the total market value of the crypto market is about $30 trillion. When the interest rate is 5.25%, the total market value of the crypto market is about $12 trillion, which is approximately 40% of the peak. From November 2021 to March 2022, due to the expected management by the Federal Reserve, the crypto market lost about $1 trillion in market value. In March, when the Federal Reserve raised interest rates by 25 basis points, the total market value of the crypto market was about $20 trillion, which is 67% of the peak.
• Considering that the Federal Reserve is not expected to adopt the unlimited quantitative easing policy of 2020-2021 in the coming years, the maximum change in the total market value of the crypto market due to expected changes will not exceed $1 trillion.

Changes in the total market value of the crypto market as of July 17, 2023. Source: Coinmarketcap
Let’s expand based on the above logic:
• Considering that the crypto market currently lacks external liquidity inflows, we assume that the future price of BTC will depend entirely on changes in interest rates and market expectations, reflected in changes in market share.
• Under the circumstances of a high interest rate of 5.25% and a lack of external liquidity inflows, it is difficult for the total market value of the crypto market to rise significantly before January 2024. Even with “expectations leading the way,” the most optimistic scenario would result in an internal market value growth of no more than $500 billion.
• The total supply of BTC is about 19.43 million coins, and there will be no significant change in the total supply within a year.
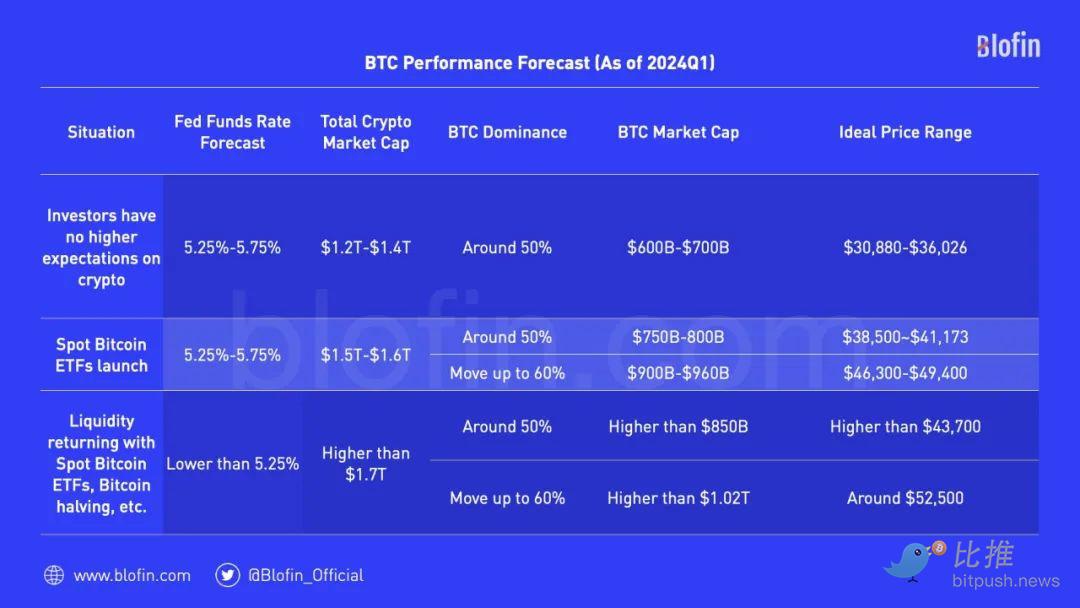
Consider the following three scenarios:
1. Investors have no further expectations, and the internal market value growth of the crypto market is limited. The total market value of the crypto market will stabilize between $1.2 trillion and $1.4 trillion, and the market share of BTC will not change significantly, remaining at around 50%. This means that the market value of BTC will fluctuate between $600 billion and $700 billion, and the price will fluctuate between $30,880 and $36,026;
2. BTC spot ETF is approved, bringing good expectations for investors. The market value of the crypto market rebounds to around $1.5 trillion to $1.6 trillion.
– If the market share of BTC does not increase, the market value of BTC will stabilize at around $750 billion to $800 billion, and the price may reach a maximum of $41,173; even if the rebound is not intense enough, the price of BTC will still be higher than $38,500;
– If the spot ETF approval leads to an increase in the market share of BTC to 60%. In the best case, the market value of BTC will reach $960 billion, with a unit price exceeding $49,400; even if the overall rebound of the crypto market is not intense enough, the market value of BTC will rise to $900 billion, with a unit price of $46,300.
3. The expectation of interest rate cuts, combined with positive expectations such as spot ETFs and Bitcoin halving, has pushed liquidity back into the cryptocurrency market, and the market capitalization of the cryptocurrency market has rebounded to over $1.7 trillion.
– If BTC’s market dominance does not increase, its market capitalization will reach over $850 billion, and the price will rebound to over $43,700;
– If BTC’s market dominance rises to 60%, its market capitalization will reach over $1.02 trillion, and the price will reach around $52,500.
In summary, macro factors are relatively favorable for BTC, and the ultimate level that BTC’s price can reach depends on interest rates and market expectations.
ETH: “How to Build a More Profitable Company”
Considering that BTC has become the protagonist of the macro narrative, it may be wiser for ETH to focus on applications. Therefore, for ETH, the factors that affect its price mainly come from its own new narratives and whether it can gain further widespread adoption in the future. Since these factors will be reflected in the net income of the Ethereum network, we can infer the possible price changes of ETH based on changes in the price-earnings ratio.
Similarly, let’s consider three scenarios:

1. The Cancun upgrade significantly improves the Layer2 speed of Ethereum and reduces transaction costs, promoting the outbreak of the Ethereum Layer2 ecosystem. The profitability of the Ethereum network continues to grow, with quarterly revenue increasing by 50% before the Cancun upgrade and doubling after the upgrade.
– Assuming that the price-earnings ratio of ETH does not change significantly and investors have strong expectations, pushing the price-earnings ratio to remain around 300. The net income for Q2 2023 is $423 million, Q3 net income is $635 million, and Q4 net income is $953 million. In this scenario, the total revenue of the Ethereum network in 2023 will reach $2.137 billion. Considering that ETH deflation will reduce the total supply of ETH to 120 million, the average price of ETH in early 2024 may exceed $5,300 and exceed $9,700 in the first quarter after the Cancun upgrade.
– Assuming that investors have neutral expectations, causing the price-earnings ratio of ETH to fall to around 150 (similar to comparable companies such as AMZN), in this scenario, the average price of ETH will reach around $2,670 in early 2024 and approach $4,900 in the first quarter after the Cancun upgrade.
2. The profitability of the Ethereum network is relatively stable, with quarterly revenue increasing by 25%, and the first quarter revenue after the Cancun upgrade increasing by 50% compared to Q4 2023.
– Assuming that the price-earnings ratio of ETH does not change significantly and investors have strong expectations, pushing the price-earnings ratio to remain around 300. The net income for Q2 2023 is $423 million, Q3 net income is $529 million, and Q4 net income is $661 million. In this scenario, the total revenue of the Ethereum network in 2023 will reach $1.739 billion, and the average price of ETH in early 2024 may exceed $4,300 and exceed $6,500 in the first quarter of 2024. If the price-earnings ratio falls to around 150, the average price of ETH in early 2024 may be around $2,150 and exceed $3,200 in the first quarter of 2024.
3. The Ethereum network’s profitability is experiencing diminishing marginal returns, with Q3 and Q4 revenues increasing by 20% and 15% respectively. The positive impact of the Cancun upgrade only managed to curb the trend of diminishing profitability in the first quarter.
– Assuming that the ETH price-to-earnings ratio remains relatively stable, investors’ strong expectations will maintain the ratio at around 300. Net income for Q2 2023 is projected to be $423 million, Q3 net income is projected to be $508 million, and Q4 net income is projected to be $584 million. In this scenario, the total revenue for the Ethereum network in 2023 will reach $1.641 billion, and the average price of ETH in early 2024 may surpass $4,100, with a potential breakthrough of $5,400 in the first quarter of 2024. If the price-to-earnings ratio falls to around 150, the average price of ETH in early 2024 may be around $2,050, with a potential breakthrough of $2,700 in the first quarter of 2024.
In conclusion, the development of ETH is highly correlated with its own profitability. The combination of narrative support and sustainable and continuously growing profitability is the key driver for the rise in ETH price – a difference from BTC.

Junction
In fact, the “divergence” in the cryptocurrency market not only exists in theory, but also extends beyond BTC and ETH. According to statistics, in 2023, not only did the correlation between BTC and ETH significantly decrease, but the correlation between BTC and mainstream altcoins also decreased significantly. BTC seems to be charting its own course, while the correlation between ETH and other types of coins such as XRP, LTC, and BNB has also weakened. However, ETH still maintains a strong correlation with public chain coins like ADA and project tokens deeply rooted in the Ethereum public chain, such as CRV.
As the correlation between cryptocurrencies continues to weaken, previously fully or partially reusable analytical logic and trading strategies are no longer effective. Pair trading no longer exhibits ideal correlation regression, and a general investment framework based on market capitalization and sectors is also somewhat inadequate – indicating that further analysis based on project fundamentals becomes more important.

Correlation changes between BTC and major cryptocurrencies excluding ETH, as of June 2023. Source: Kaiko

Correlation changes between ETH and major cryptocurrencies excluding BTC, as of July 2023. Source: CoinMetrics
It is now time to adopt completely different logics to view the cryptocurrency market. Cryptocurrency 3.0 has arrived; the era is advancing. Bitcoin will become more closely integrated with macroeconomics and traditional markets, while Ethereum needs to become a “great company”; other cryptocurrencies also need to chart their own path. In the rapidly changing cryptocurrency market, we need to keep up with the times.
Like what you're reading? Subscribe to our top stories.
We will continue to update Gambling Chain; if you have any questions or suggestions, please contact us!
