Author: LongStory Research
Recently, Vyper suffered a reentrancy attack, which had a significant impact on Curve, a platform based on Vyper. This incident has stirred up waves in the once calm DEX ecosystem. We can observe that emerging DEX platforms such as TraderJoe, Maverick, and Izumi have achieved impressive trading volumes on various public chains through their unique solutions. This article explores the evolving trends and potential directions of the DEX industry, starting from several mainstream DEX platforms and focusing on stablecoin and yield-bearing asset trading.
Main Trend 1: Evolution of liquidity overflow to real trading demand
Since the attack on Curve due to the Vyper vulnerability, the total value locked (TVL) has dropped from 3.8 billion to 2 billion, almost halved. After FRAX reintroduced liquidity to Curve, the TVL has rebounded to 2.8 billion. Interestingly, during this incident, the panic over Curve’s lending collapse far exceeded the panic over stablecoin depegging. Curve has always been closely associated with stablecoins and is undeniably a leader in the stablecoin market. But why didn’t concerns about stablecoin pegging erupt during this hacking attack?
- Popular Science How to prevent account attacks and maintain security. What should I do if my account is attacked?
- What is the future development potential of perpetual contracts, options, and volatility trading products based on AMM?
- Friend.tech’s trend is receding, while Tip Coin’s momentum is rising.
First, let’s explore the question of how to define the “leader in the stablecoin market.”
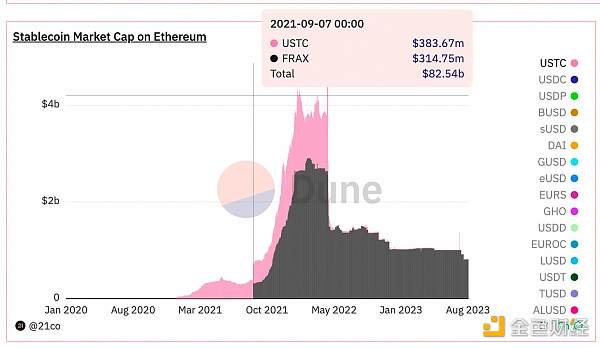
The following chart reflects the overall market capitalization of stablecoins within the ecosystem. It is clear that from January 2020 to February 2022, the market capitalization of stablecoins has been consistently growing. The main contributors to this growth are USDC, USDT, DAI, and algorithmic stablecoins such as FRAX and UST.
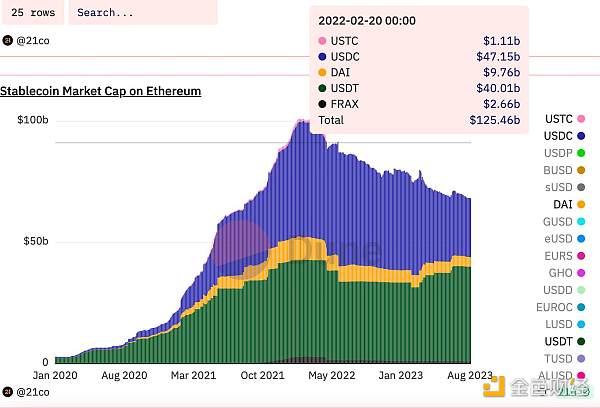
The timeline in the following chart can be summarized as follows:
-
January 2021: Rapid growth in on-chain USDC market capitalization.
-
May 2021: Uniswap V3 launched, and people started trading stablecoins on Uniswap. However, during this period, the trading volume on Uniswap V3 still lagged behind Curve.
-
September 2021 to April 2022: Intense competition among Curve, FRAX, UST, MIM, and other algorithmic stablecoins, leading to an increase in TVL and trading volume.
-
May 2022: UST lending collapse, significantly reducing the demand for stablecoins in the Curve War.
-
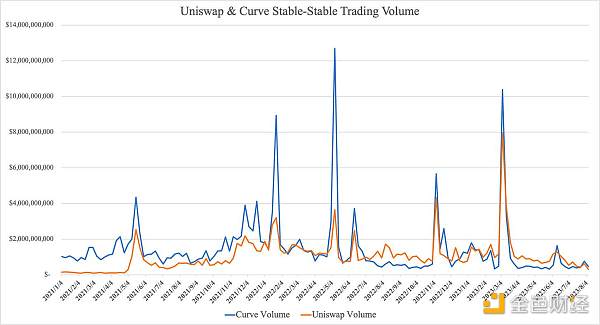
July 2022: Uniswap Stable-Stable (S-S) trading volume consistently surpasses Curve.
-
April 2023: After the upgrade in Shanghai, stETH can be redeemed 1:1 on Lido Buffer, resulting in reduced demand for Curve as a liquidity venue.
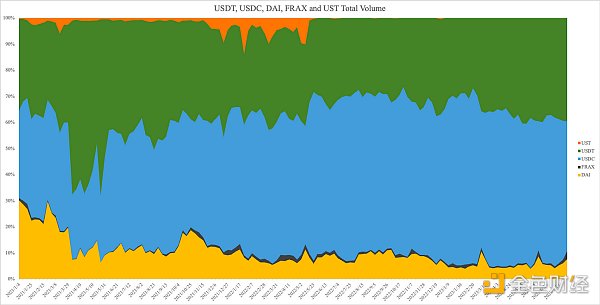
In order to provide readers with a clearer and more intuitive understanding of the development of stablecoin swaps, we will analyze traditional stablecoin swaps (USDT, USDC, and DAI) and emerging stablecoin swaps (FRAX and UST) in the following sections.
Traditional Stablecoins: Stable with Slight Decline
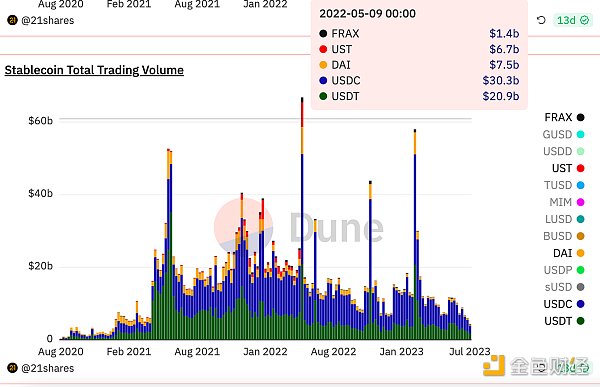
As can be seen, the trading volume of traditional stablecoins experienced a significant growth in April 2021, mainly due to the substantial increase in the market value of USDC. The trading volume of mainstream stablecoin swaps remained relatively stable until the UST scandal in May 2022, after which the overall trading volume of stablecoin swaps began to gradually decline.
Emerging Stablecoins: Brief Success, Competing with Curve
By observing the following data chart, we can clearly see the trend of the total market value changes of FRAX and UST before the crash. It is obvious that starting from March 2021, the market value of UST gradually increased, and by September of that year, its market value experienced explosive growth together with FRAX.
As shown in the following graph, the trading volume of UST exploded in November 2021. During this period, its highest trading volume accounted for 10% of the total stablecoin trading. For algorithmic stablecoins like UST, building reliable credit support is the primary task to achieve anchoring. It is worth noting that this additional trading volume was mainly captured by Curve. This means that Curve played an important role in algorithmic stablecoins at that time.
From the Liquidity Overflow of the Showcase Effect to the Real Trading Demand of Stock Game
Before delving into the reasons why Curve occupies a large amount of the trading volume of algorithmic stablecoins, let us first introduce an important concept: Showcase Effect.
Showcase Effect is a commonly used term in the traditional financial field, which refers to fund managers using various means to present a healthier, more successful, or compliant image of their company or investment portfolio to the public.
During that period, we could clearly perceive that Curve showed a clear showcase effect to the entire stablecoin market.
Former US Treasury Secretary Timothy Geithner once made a famous statement:
“I want to have a showcase full of money, enough to match any potential debt.”
Generally speaking, the showcase effect has a certain negative connotation. However, in the context of Curve, this effect can be seen as a neutral or even positive phenomenon, and its existence has certain necessity and rationality. Unlike the minimalist Uniswap frontend, Curve chooses to openly display TVL to users, thereby achieving the credit overflow of traditional stablecoins to new stablecoins, which Uniswap does not possess. In this context, users tend to believe that regardless of whether they hold mainstream stablecoins or smaller algorithmic stablecoins, they have billions of TVL as common support. For stablecoin projects, they need to rely more on a huge TVL to maintain the network effect of their stablecoins. As defined, appearing “more successful” and “healthier” will motivate project teams to actively participate in Curve. As for the later consideration of the bribery cost of veCRV, it is a question to be considered after the bull market wave recedes.
The core goal of Curve is to help emerging stablecoins build “showcase” credit. However, in the current context where UST has failed and the narrative of algorithmic stablecoins has been almost debunked, the market’s demand for building credit has weakened, and the dominant factor is genuine trading demand.
Currently, major DEXs have further vertically developed the AMM mechanism, shifting the focus of competition from TVL scale to improving capital efficiency, namely by providing deeper liquidity and more advantageous prices to compete for larger trading volume shares. This also explains the fundamental reason mentioned at the beginning of this chapter that Uniswap’s S-S trading volume surpasses Curve.
From the perspective of the showcase effect, Crypto indeed needs a display platform, where Curve can not only highlight the strong capital support behind stablecoins but also provide users with a “guarantee” for secure use.
However, in a stage where industry and DeFi attention gradually decrease, the demand from both users and project parties for this display platform is significantly decreasing, and people are starting to pay more attention to the real trading demand in the existing market. In such an environment, it seems somewhat difficult to assert that Curve is still the leading stablecoin trading platform in the current market. With changes in market dynamics and user demands, new leaders or more decentralized market structures may emerge.
Equal footing among giants, new forces emerging
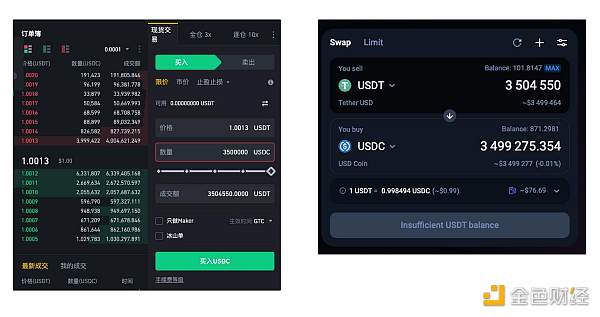
In this chapter, we will analyze the mechanisms and trends of the current stablecoin DEX competition, focusing on mainstream stablecoin trading pairs (such as USDT, USDC, and DAI) as a starting point.
As mentioned in the previous chapter, we have analyzed the trend of trading volume between stablecoins on Uniswap and Curve. Curve has gained a certain market share based on its first-mover advantage, while Uniswap has gradually caught up with it through the high capital efficiency brought by V3. In the current widespread use of 1inch, the competition in the stablecoin swap market has become very flat and intense. Since the vast majority of trading volume between stablecoins is concentrated in the three mainstream stablecoins, USDC, USDT, and DAI, the competition between DEXs mainly focuses on lower slippage and lower fees. The winner can attract more trading volume and create higher APY for LPs.
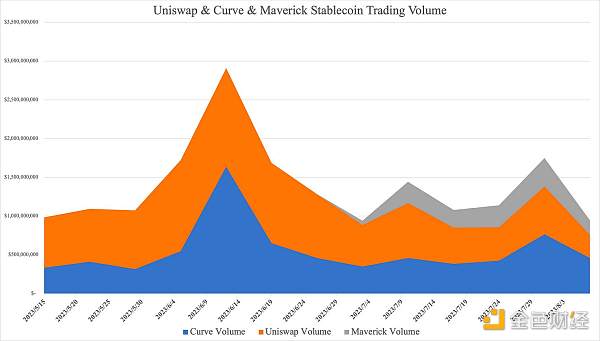
The chart below shows the recent changes in trading volume between stablecoin pairs. From the chart, we can observe that the competition between Uniswap and Curve has stabilized. However, it is worth noting that since July, Maverick’s market share has significantly increased, successfully capturing a portion of the existing market, thereby reducing the market share of Uniswap and Curve.
Let’s first understand Maverick. Maverick is a unique decentralized exchange (DEX) that adjusts the LP range based on Time-Weighted Average Price (TWAP) to aggregate LPs around the market price and provide the best trading depth. Maverick offers four modes (Left, Right, Both, and Static) to give LPs directional choices (predicting price rise or fall), which helps in dealing with the market’s unilateral upward, downward, or sideways trends. For liquidity providers, Maverick not only greatly reduces management costs but also creates more profits in the case of correctly predicting market trends. From the results, this automated liquidity-following mechanism greatly improves Maverick’s capital efficiency.
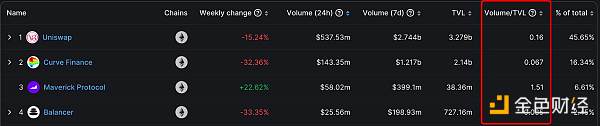
Capital efficiency can be calculated by “Trading Volume / TVL”. That is, the proportion of TVL that is actually utilized in the daily trading volume of a DEX.
The figure below shows the capital efficiency of major DEXs on the ETH mainnet. According to the data in the graph, Uniswap’s Volume/TVL ratio is approximately 0.16, which means that 16% of the TVL is actually involved in trading. In comparison, Curve has lower capital efficiency, with only 6.7% of the capital being used for trading, which further confirms Curve’s strong storefront effect. Maverick is the only DEX platform where the trading volume exceeds TVL, with a capital efficiency of 151%, far exceeding other competitors.
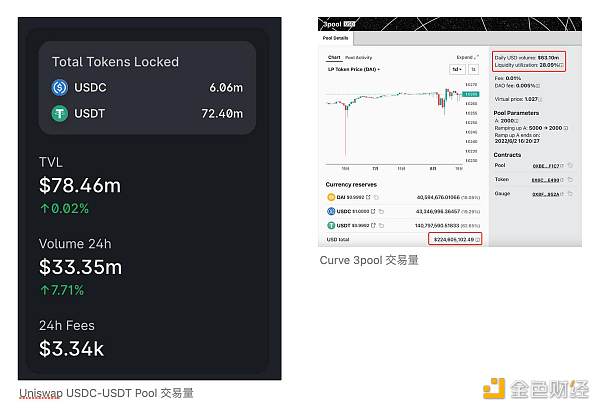
When further analyzing Maverick’s TVL, we can notice that 90% of Maverick’s trading volume (66M USD) is supported by the USDC-USDT trading pair, which accounts for less than 7% of the TVL (3M USD). In other words, Maverick has a capital efficiency of 2000% in stablecoin trading pairs, which is much higher than the corresponding indicators of Uniswap V3 and Curve 3pool.
 Maverick Daily Trading Volume
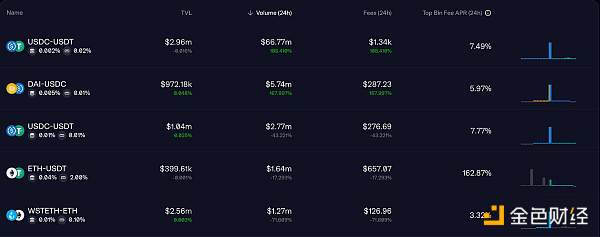
Next, let’s explore the situation of major DEXs in terms of transaction fees and liquidity distribution. From the data, we can clearly see that Uniswap and Curve charge the same transaction fees, but they are higher than Maverick, which is an advantage for Maverick in attracting traders.
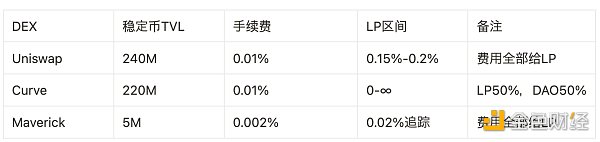
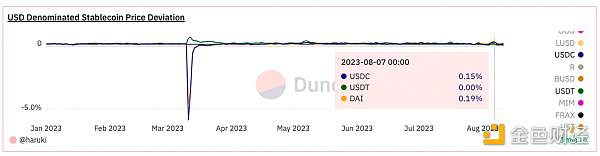
We can further analyze the historical price fluctuations of USDC, USDT, and DAI with reference to the figure below. From the graph, we can see that a price fluctuation difference of 0.2% is roughly the maximum fluctuation range under normal circumstances, which is consistent with the trading range set by Uniswap, indicating that Uniswap has made a relatively reasonable setting for stablecoin trading pairs. Maverick, on the other hand, captures more trading volume and provides users with higher APY by dividing the LP range of Uniswap V3 into 10 parts and following the market price of stablecoins.
From this, we can draw a conclusion that Maverick demonstrates significant advantages in terms of capital efficiency and transaction fees, which may be an important reason for its rapid rise in the market and its acquisition of a portion of the stock of Uniswap and Curve.
Main Theme 2: Aggregators Catalyze Price Wars

Currently, the most advanced player in the aggregator field is undoubtedly 1inch. The following data will be used to demonstrate the importance of aggregators in DEX trading volume:
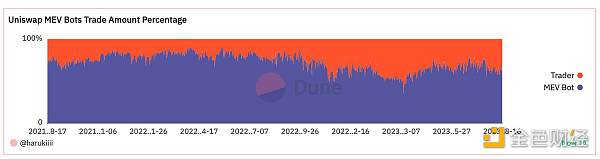
First, we can notice that more than half (about 60%) of the trading volume on Uniswap comes from various forms of MEV. Secondly, on the Ethereum mainnet, Uniswap accounts for about 50% of the overall DEX trading volume. Based on these two data points, we can infer that 20% of the overall DEX trading volume comes from Uniswap traders, 20% comes from other DEXs, and 60% comes from MEV bots.
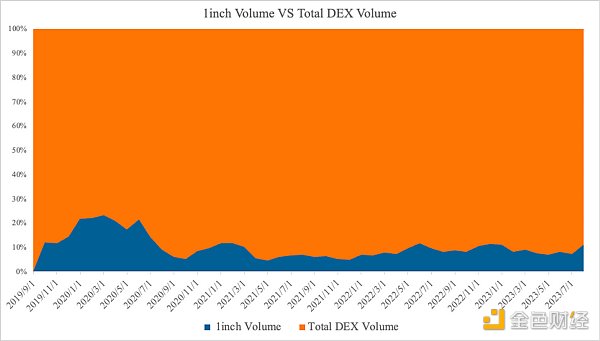
Currently, 1inch accounts for approximately 10% of the total DEX trading volume. Combining its market share of approximately 50% in the aggregator market, we can infer that aggregators contribute about 20% of the total DEX trading volume. Since MEV robots do not utilize aggregators for trading, we can assume that the trading volume of aggregators comes almost entirely from real traders. Therefore, we can roughly estimate that 40%-50% of the real user trading volume in DEX comes from aggregators.
In the next section, we will simulate and analyze the depth and price advantages of major DEXs in handling different trading volumes.
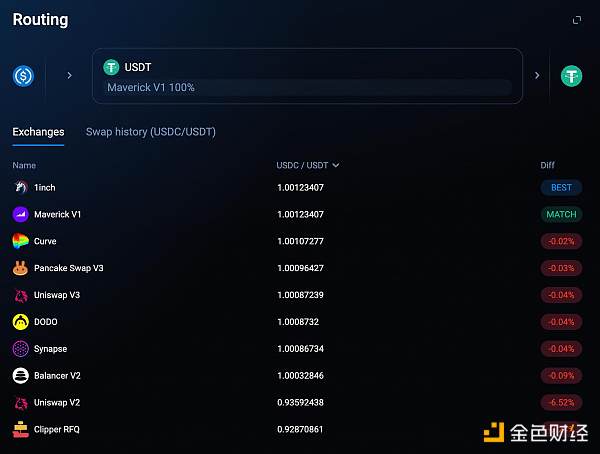
At the time of writing this article, Maverick has a more significant price advantage compared to other DEXs when handling transactions of less than 1M USD.
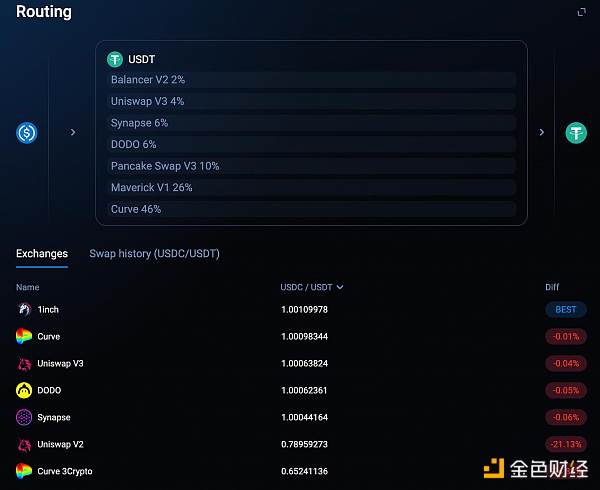
When the transaction amount reaches 4M USD, we noticed that Curve and Maverick together account for over 70% of the trading volume. Obviously, Curve has a significant advantage in handling large transactions due to its high Total Value Locked (TVL). Currently, Maverick’s maximum transaction processing capacity is about 1M USD, limited by its 3M USD TVL.
In conclusion, Uniswap and Curve still have a solid position in stablecoin exchanges. Their main advantages lie in the ability to handle large orders provided by high TVL and the ability to handle imbalanced pool weights. Maverick provides the same depth as Uniswap and Curve in medium-sized stablecoin exchange orders through high capital efficiency. However, due to its small TVL (a stablecoin pool of 3M accommodating 59M daily trading volume), extreme slippage can easily occur in the pool. In a biased market, it needs some reverse trading to correct the pool’s slippage in order to continue capturing trading volume.
Overall, Uniswap and Curve still have a strong position in the stablecoin exchange market. Their main advantages come from the ability to handle large transactions provided by high TVL and the ability to handle imbalanced pool weights. Although Maverick has a smaller TVL (a stablecoin liquidity pool of 3M accommodating 66M USD of 24h trading volume), it can still provide comparable depth to Uniswap and Curve in medium-sized stablecoin trades through high capital efficiency. However, Maverick’s limited TVL can easily lead to extreme slippage in handling large orders. In a biased market environment, it needs some reverse trading to correct the pool’s slippage and attract continuous trading volume.
With the existence of aggregators, DEXs of all sizes are brought to a level playing field for competition. There is no distinction between good or bad or big or small in aggregators. It purely competes in terms of trading depth and fees, and many DEXs even have no protocol income, distributing all fees to LPs. This competition is dominated by the AMM mechanism of DEXs and is driven by users (traders). For a considerable period of time, the DEX that can consistently provide better depth and more advantageous prices will be able to compete for a larger share of trading volume from aggregators.
Due to the existence of aggregators, various DEXs are placed on a common starting line to compete. Within the aggregator, the competition between DEXs mainly revolves around trading depth and transaction fees, without involving the merits of their respective brands. Many DEXs have given up protocol revenue and distributed all transaction fees to liquidity providers. This competition pattern, which is optimized by DEX mechanisms and dominated by user-side costs, means that in the long run, DEXs that can stably provide better depth and prices will win more transaction volume allocation from the aggregator.
Uniswap X
Currently, the aggregator market has added a heavyweight player – UniswapX. UniswapX is expected to further consolidate Uniswap’s leading position in the stablecoin exchange field.
In an interview, Anton Bukov, the founder of 1inch, mentioned that Uniswap has always had a lot of “unfair” trading volume. This indicates that many people did not use aggregators to seek better prices, but directly traded through Uniswap’s front end.
Uniswap also realizes its unique advantage and has launched Uniswap X and Uniswap V4 as a powerful combination strategy. Uniswap X, as a product that integrates aggregators, cross-chain, and RFQ, has the following significance:
-
Attract more front-end traffic through aggregation functions, provide users with better trading experience, and prepare for V4’s Hook.
-
Cross-chain swaps can integrate Uniswap’s liquidity in a multi-chain environment during the L2 outbreak and liquidity contraction stage.
-
The permissionless nature of UniswapX can prevent malicious behavior by relayers.
-
RFQ helps bridge the liquidity gap between CEX and DEX by introducing some liquidity from CEX to DEX.
For stablecoin trading, even if operations are conducted through 1inch, there is still a significant difference in trading depth between DEXs and Binance. UniswapX is expected to further narrow this gap, and with the widespread deployment of Uniswap X, Uniswap’s market share in the stablecoin trading field is expected to increase further.
Possible future increments: LST and interest-bearing stablecoins
After the upgrade in Shanghai, LSD is trying to become the benchmark interest rate of DeFi. With Maker’s EDSR climbing to 5%, various stablecoins have also been caught in a battle for interest.
For stablecoin projects, there are two main ways to make their stablecoins generate income:
-
Protocols with large scale and certain capital accumulation will try RWA schemes, with DAI and FRAX being typical examples.
-
New protocols tend to combine with LSD, such as Lybra’s eUSD and Gravita’s GRAI.
These two methods are not mutually exclusive, but they have significant differences in implementation difficulty. The following analysis will focus on discussing from the perspective of project parties and LPs: Under the rapid development of interest-bearing assets, how will DEXs allocate this incremental part in the future?
From the perspective of stablecoins or LST projects: Uniswap/Maverick first, then Curve.
Similar to FRAX and UST, if emerging stablecoins or LST focus on credit building, they will be motivated to establish liquidity pools on Curve. On the other hand, if stablecoins or LST prioritize smooth trading and higher capital efficiency, project parties are more inclined to build liquidity pools on Uniswap or Maverick.
Therefore, we can infer that in the early stages of competition among stablecoins or LST, due to the relatively small scale of everyone, they will tend to first meet the trading needs of users on Uniswap V3 and Maverick, and compete while ensuring smooth transactions. As competition enters the middle and later stages, when the leading players gradually establish their positions, project parties will be motivated to pay additional costs and go to Curve to build stronger credit.
From the perspective of stablecoin/LST LPs: Maverick first, then Uniswap/Curve.
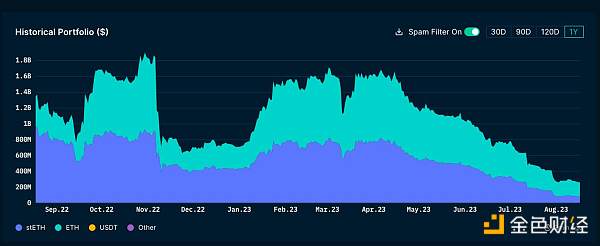
Obviously, users holding stETH are more sensitive to interest rates compared to those holding ETH. We can refer to the data of stETH to give a simple profile of interest-bearing asset users.
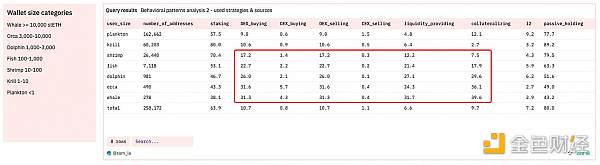
As shown in the above figure, we can observe that users with more stETH tend to trade stETH more frequently and seek some derivative protocols related to stETH; in contrast, users holding less than 10 stETH seem less sensitive to additional interest rates. Based on this finding, we can predict the DEX market pattern of interest-bearing stablecoins as follows: the interest-bearing stablecoin market is mainly dominated by large holders who are highly sensitive to interest rates. In other words, unlike traditional stablecoins and algorithmic stablecoins, interest-bearing stablecoins are mainly driven by LP yields.
In the interest-bearing stablecoin sector, since there are currently no sufficiently large interest-bearing stablecoins as analysis targets, here we compare the 24h APY of USDC-USDT on Uniswap, Curve, and Maverick on August 15th (Curve uses 3pool).
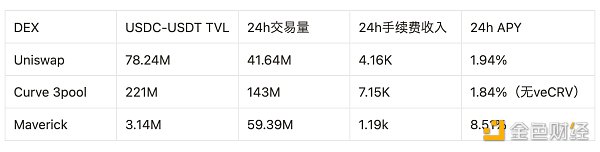
It can be observed that the current APY of Uniswap and Curve is very similar, and both are significantly lower than Maverick. Essentially, the LP position of Maverick is equivalent to a Uni V3 LP that can automatically adjust based on the current price, with each bin interval being 0.02%, about one-tenth of Uniswap V3. Under Maverick’s automated LP management, the LP APY in small intervals will obviously be higher than in large intervals.
It is also worth noting that Maverick’s capital efficiency can be seen as a cost advantage. This is very attractive to some early-stage interest-bearing stablecoin projects because they require less USDC to build liquidity pools of the same depth on Maverick compared to Uniswap or Curve.
As for LST, currently only stETH has shown growth in adoption in the overall DeFi protocols, while others remain stable.
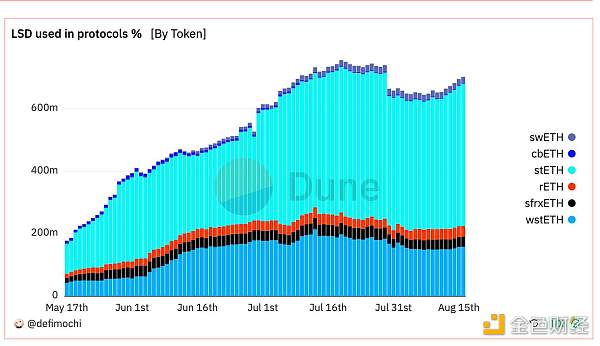
stETH is a Rebase Token, and due to its uniqueness, DEXs like Uniswap V3, Maverick, and Balancer do not support it. Therefore, the main trading venue for stETH is the liquidity pool specially designed by Curve, which is also the biggest advantage of Curve in the LST field. However, after the Shanghai upgrade, stETH can also be withdrawn in the short term through Lido for the stETH-ETH trade, weakening Curve’s core competitive barrier. In addition, due to the cessation of incentives for Lido and Curve’s low capital efficiency, as shown in the following figure, Curve’s stETH supply has been decreasing since the Shanghai upgrade in April 2023.
While the remaining LST, such as wstETH and rETH, their staking rewards are reflected by the increase in exchange rate compared to ETH. Curve does not have a clear advantage in this type of LST trading area. The main trading venues for wstETH are concentrated in Maverick and Uniswap, where LPs set up a very narrow liquidity range to provide excess returns. Although this type of LST has some characteristics of stablecoins, its price is not stable but continuously rises at a relatively fixed rate.
Therefore, for this type of LST, there will be significant differences in management costs between Uniswap V3 LPs and Maverick LPs. As shown in the figure below, the wstETH range of Uniswap V3 is only 0.03%, and based on Lido’s 4.5% staking APY, users need to adjust the liquidity range at least every 3 days. Each entry or exit of liquidity in V3 requires a gas fee of $30. In order to offset this gas fee, users need to have approximately $45,000 in capital, and in order to generate additional returns, the capital should be at least $150,000. Such thresholds are unaffordable for most users on the chain. Maverick, on the other hand, saves users’ management costs and gas fees through its automatic follow feature, moving bins by checking the relationship between price and range for each swap made by traders, while providing an annualized yield equivalent to Uniswap, thus lowering the participation threshold to a minimum.
Summary: How to Define a Good DEX?
DEX is undoubtedly the cornerstone of the DeFi ecosystem. Without DEX, all DeFi protocols would be impossible.
How to define an excellent DEX? Different roles in the blockchain have different focuses, and the answers will also vary.
-
Users (traders) expect better trading depth (reduced slippage) and lower gas fees.
This requires a DEX to have higher TVL or more advanced mechanisms to ensure depth. In addition, deeper contract code optimization is needed to reduce gas fees.
-
Project parties seek better trading depth, lower liquidity costs (achieving greater depth with less funds), and stronger showcase effects.
This requires a DEX to have more advanced AMM mechanisms to reduce costs, as well as excellent brand building and front-end display.
-
Liquidity providers (LPs) hope to obtain higher APR while reducing impermanent loss.
This requires a DEX to capture as much trading volume as possible per unit TVL or provide higher incentives to LPs to hedge against impermanent loss.
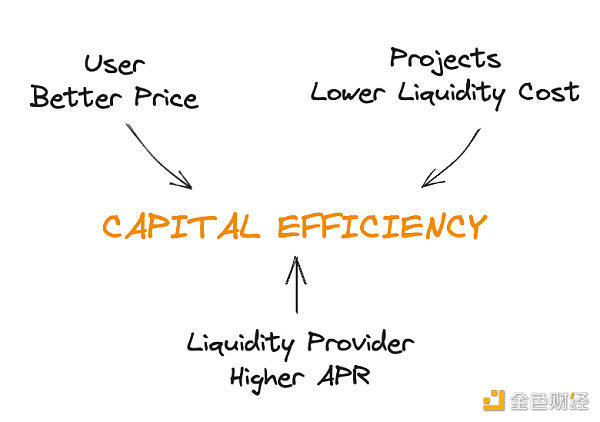
We can see that there is a common long-term solution for traders’ demand for depth, project parties’ demand for liquidity costs, and LPs’ demand for APR, which is to improve the capital efficiency of DEX.
Looking back at the two main themes, we can see that in the catalysis of aggregator in the stock market, capital efficiency has become the core of DEX innovation. Whether it is CoWSwap, 1inch, UniswapX’s RFQ solution, or Maverick’s follow liquidity, they are valuable attempts. As these innovations continue to deepen and improve, future DEX will undoubtedly become more efficient, flexible, and transparent, thereby laying a solid foundation for innovation, development, and prosperity throughout the chain.
Like what you're reading? Subscribe to our top stories.
We will continue to update Gambling Chain; if you have any questions or suggestions, please contact us!
