Written by: UkuriaOC, Glassnode
Translation: Deep Tide TechFlow
The liquidity in the digital asset market continues to be depleted, with both on-chain and off-chain transaction volumes reaching historic lows. Although HODLing is still the preferred strategy in the market, a significant proportion of the supply is on the verge of massive losses.
Summary
- The liquidity, volatility, and trading volume in the digital asset market continue to compress, with many indicators falling to pre-2020 bull market levels.
- The supply of stablecoins continues to decline, with all major stablecoin assets except USDT being redeemed.
- Long-term holders are steadfastly holding their assets and rarely conducting trades.
- On the other hand, short-term holders are on the verge of losses, as most of their supply was acquired at prices higher than the current range.
The digital asset market has returned to a very narrow trading range, and we are experiencing a period of volatility compression and extremely low trading volume. In this issue, we will further explore the depletion of liquidity and how to better describe this market structure using on-chain data.
- Full Text of Arthur Hayes’ Token2049 Speech in Singapore The Next Bull Market Will Start in Early 2024
- Development Status and List of Innovative Projects in the Decentralized Options Field
- Frax Finance In-Depth Research Report A New Chapter in the Stablecoin Track
Declining Supply
We will study the inflow of funds into the industry from a macro perspective. Here, we consider the total invested capital held in the three main assets: Bitcoin, Ethereum, and stablecoins.
- 🟢 Since April 2022, the supply of stablecoins has been steadily decreasing, starting with the redemption after the LUNA-UST crash.
- 🟠 Bitcoin (BTC) and 🔵 Ethereum (ETH) have experienced net capital inflows since the beginning of this year, with their realized market capitalization increasing by as much as $6.8 billion (BTC) and $4.8 billion per month, respectively.
- However, since late August, all three assets have experienced a return to neutral or negative inflows, indicating a certain degree of stagnation and uncertainty.
If we analyze stablecoins separately, we can see that a total of $43 billion has been redeemed, which is a 26% decline since the peak in March 2022. This can be explained as both funds leaving due to bearish market conditions and a reflection of the opportunity cost of higher interest rates that have not been passed on to non-yielding stablecoins.

When we break down the three largest stablecoins, we can see that these dynamics are not evenly distributed:
- 🟢 The supply of USDT has actually increased by $13.3 billion since the cycle low in November 2022.
- 🔵 The supply of USDC has almost equally decreased by $16.7 billion, which may partially reflect US institutions moving funds to higher-interest-rate markets.
- 🟡 The supply of BUSD has decreased significantly by $20.4 billion (89%), mainly due to the issuer LianGuaixos entering a redemption-only mode after the SEC enforcement.
If we look at it from the perspective of relative dominance, we can see how important it is for Tether’s market share to expand. Tether now accounts for 69% of the stablecoin market, a sharp contrast to the low point of 44% in June 2022.
The dominance of BUSD has dropped to 2.1%, and the dominance of USDC is only 21.7%, significantly lower compared to the peak of 38% over a year ago.
In the short term, we can observe the relative situation of buyers and sellers of three main assets flowing into exchanges. Here, we make a set of simple assumptions:
- We assume that the USD value of Bitcoin and Ethereum flowing into exchanges represents “seller” pressure.
- We assume that the USD value of stablecoins flowing into exchanges represents “buyer” pressure.
The chart below calculates the net USD difference between stablecoin inflows (+ value) and Bitcoin and Ethereum inflows. We are not concerned with the absolute value (as these assumptions may have a margin of error), but rather any significant shifts.
- 🟢 Positive values indicate a net buyer regime, where buyers of stablecoins exceed sellers of Bitcoin and Ethereum.
- 🔴 Negative values indicate a net seller regime, where buyers of stablecoins are less than sellers of Bitcoin and Ethereum.
The bull market cycle in 2021 was clearly dominated by net seller pressure as investors took profits in the frenzy of the upward trend. The collapse of LUNA-UST and 3AC in mid-2022 marked a return to net accumulation in the market as investors sought to establish a market bottom.
However, since April of this year, the market has returned to a relatively neutral level, consistent with the slowing inflows of Bitcoin and Ethereum funds and the market becoming increasingly indifferent and uncertain.
The blockchain is very quiet…
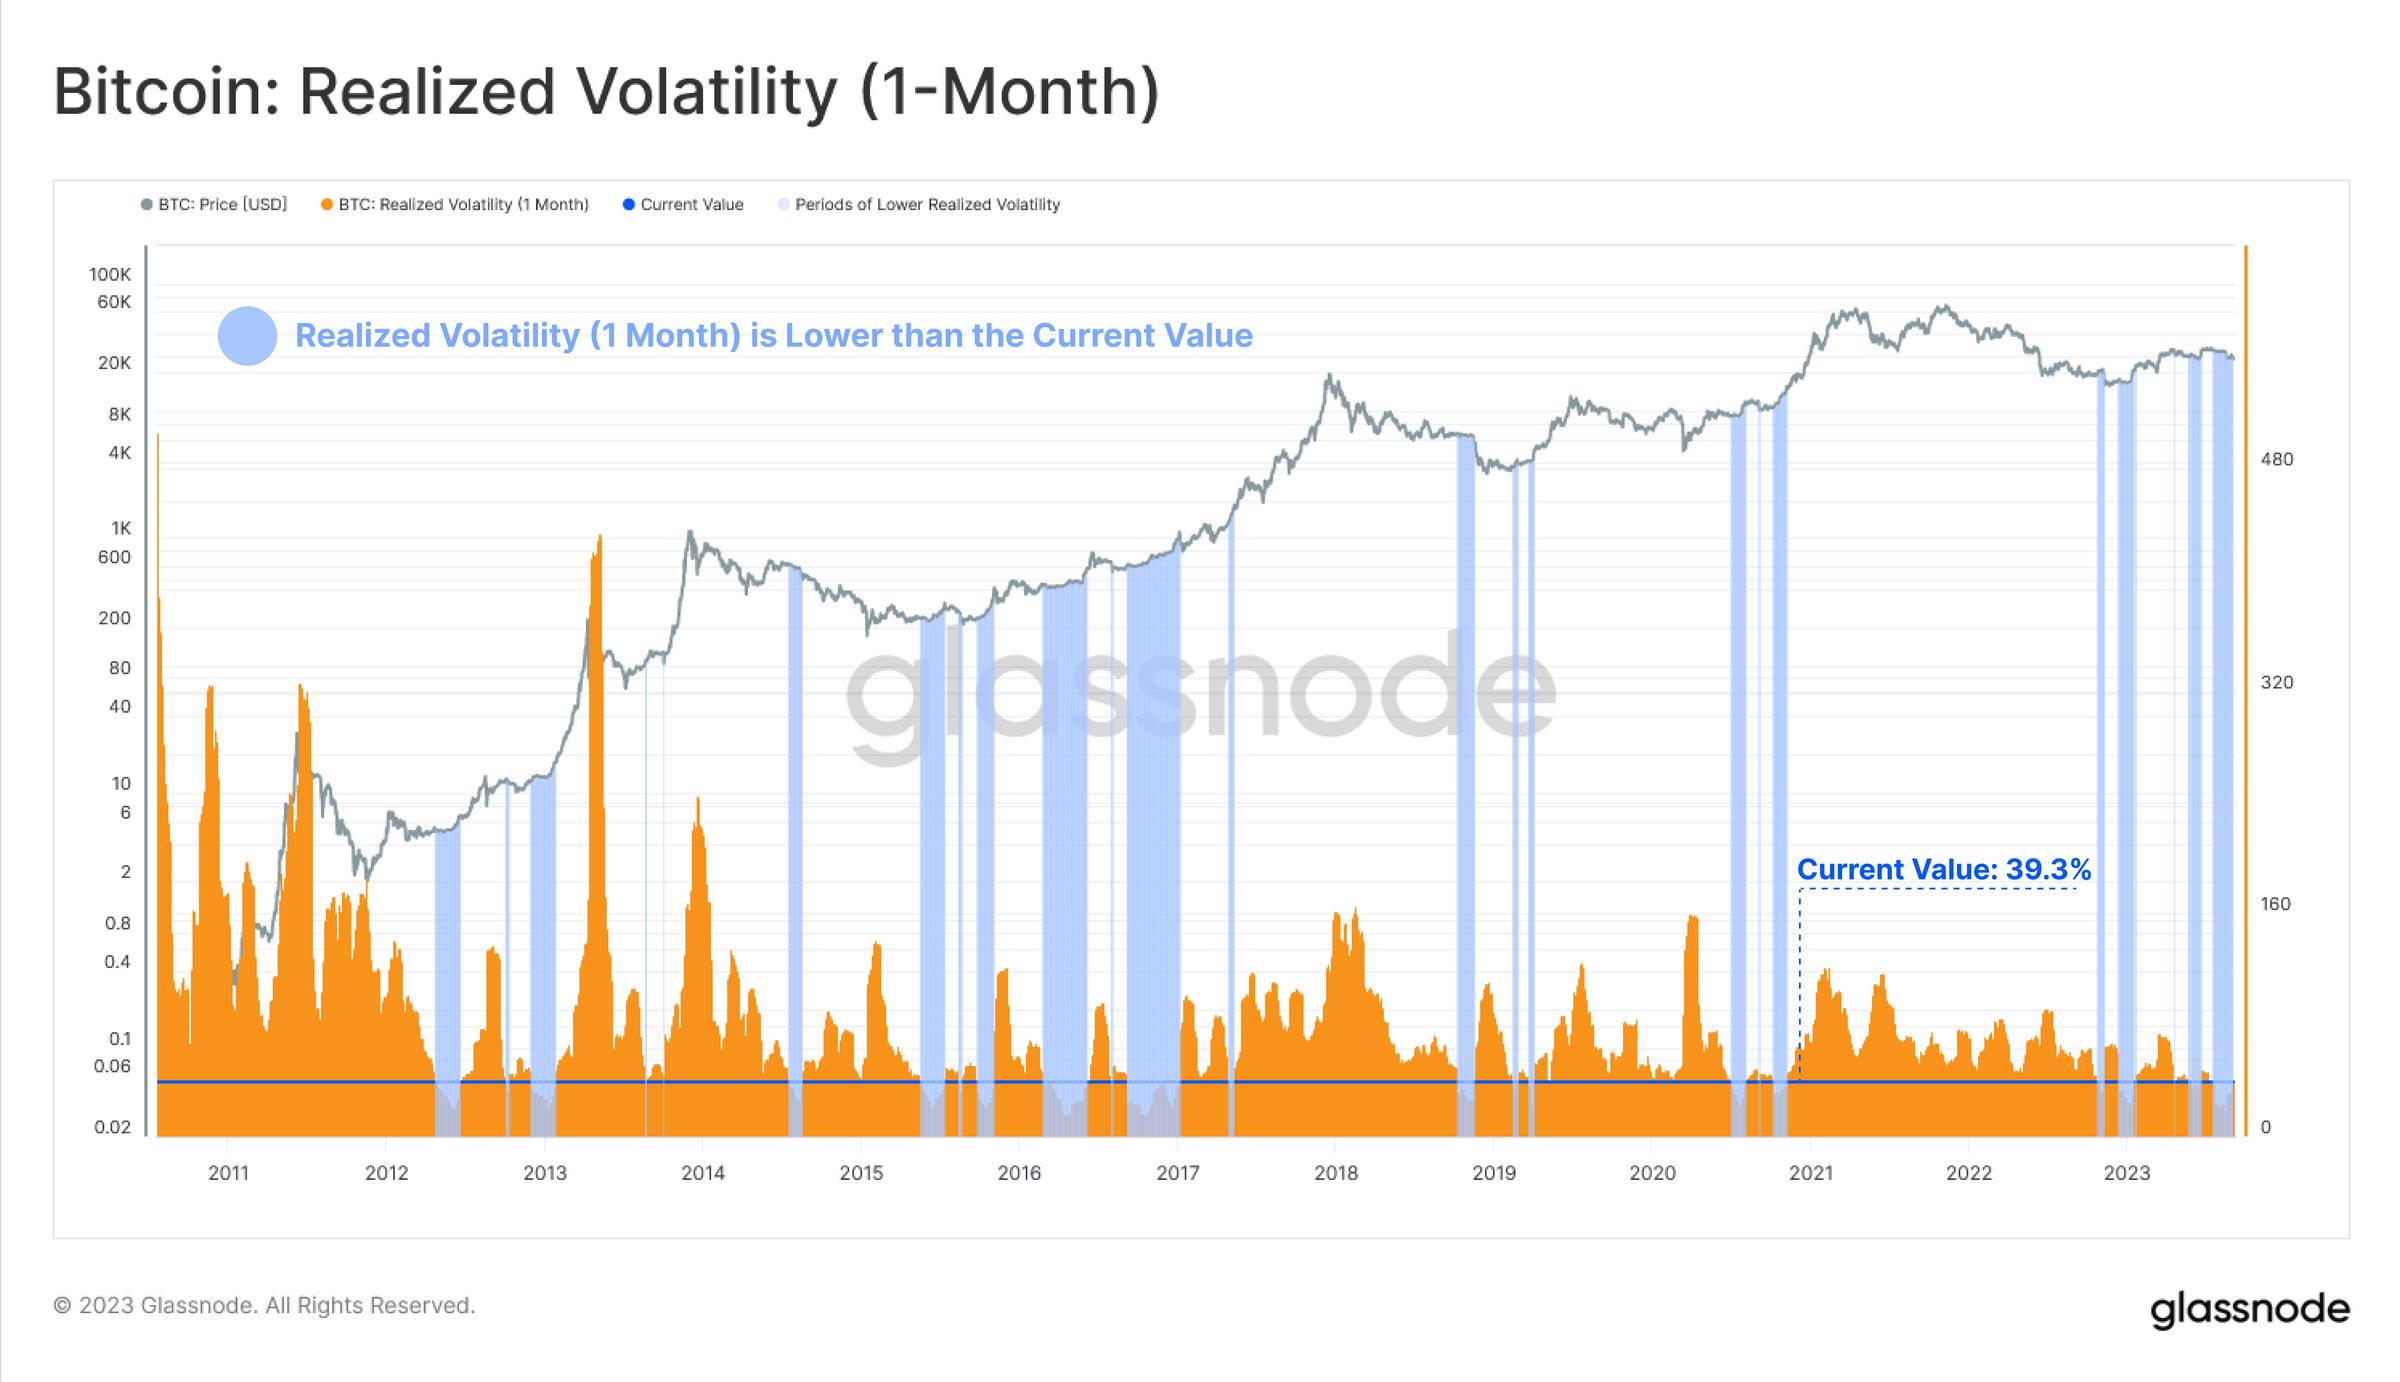
Despite falling to $26,000 in recent sell-offs and experiencing volatility again after Grayscale successfully challenged the SEC, the actual volatility remains very low. The market is still in an environment of historically low volatility, which is usually a precursor to increased volatility in the future.
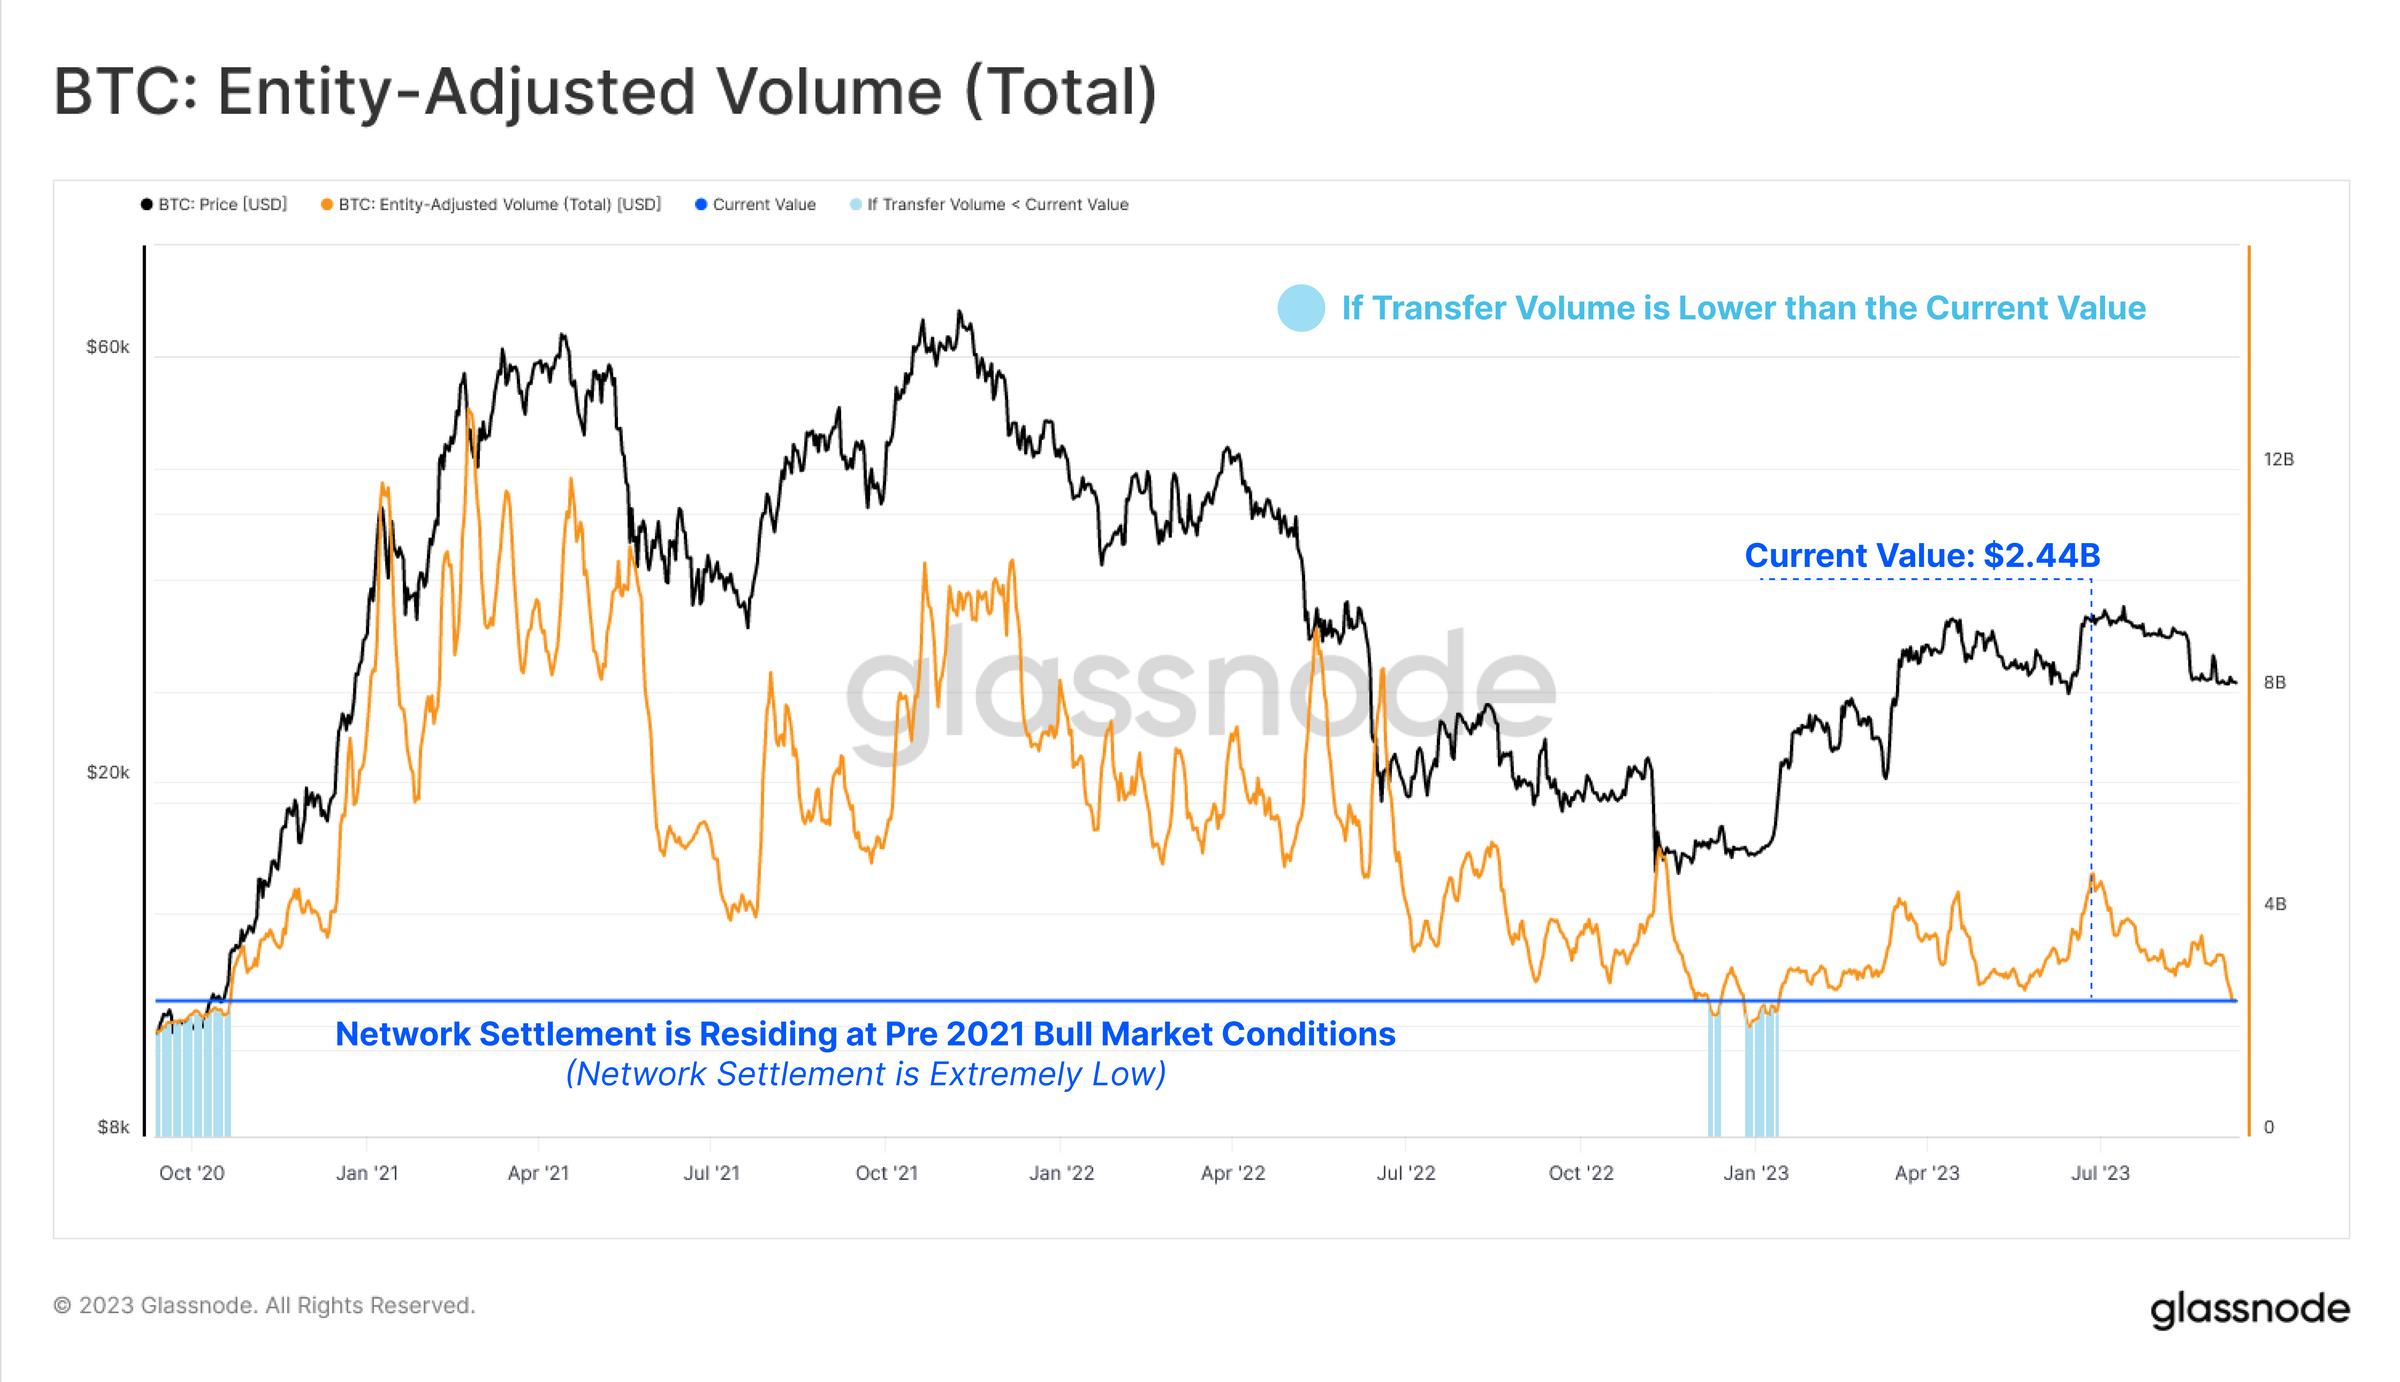
This low liquidity and low volatility environment is also reflected in the settlement transaction volume on the Bitcoin network. The USD-denominated Bitcoin trading volume is stagnant at a daily low of $2.44 billion and has returned to the level of October 2020.
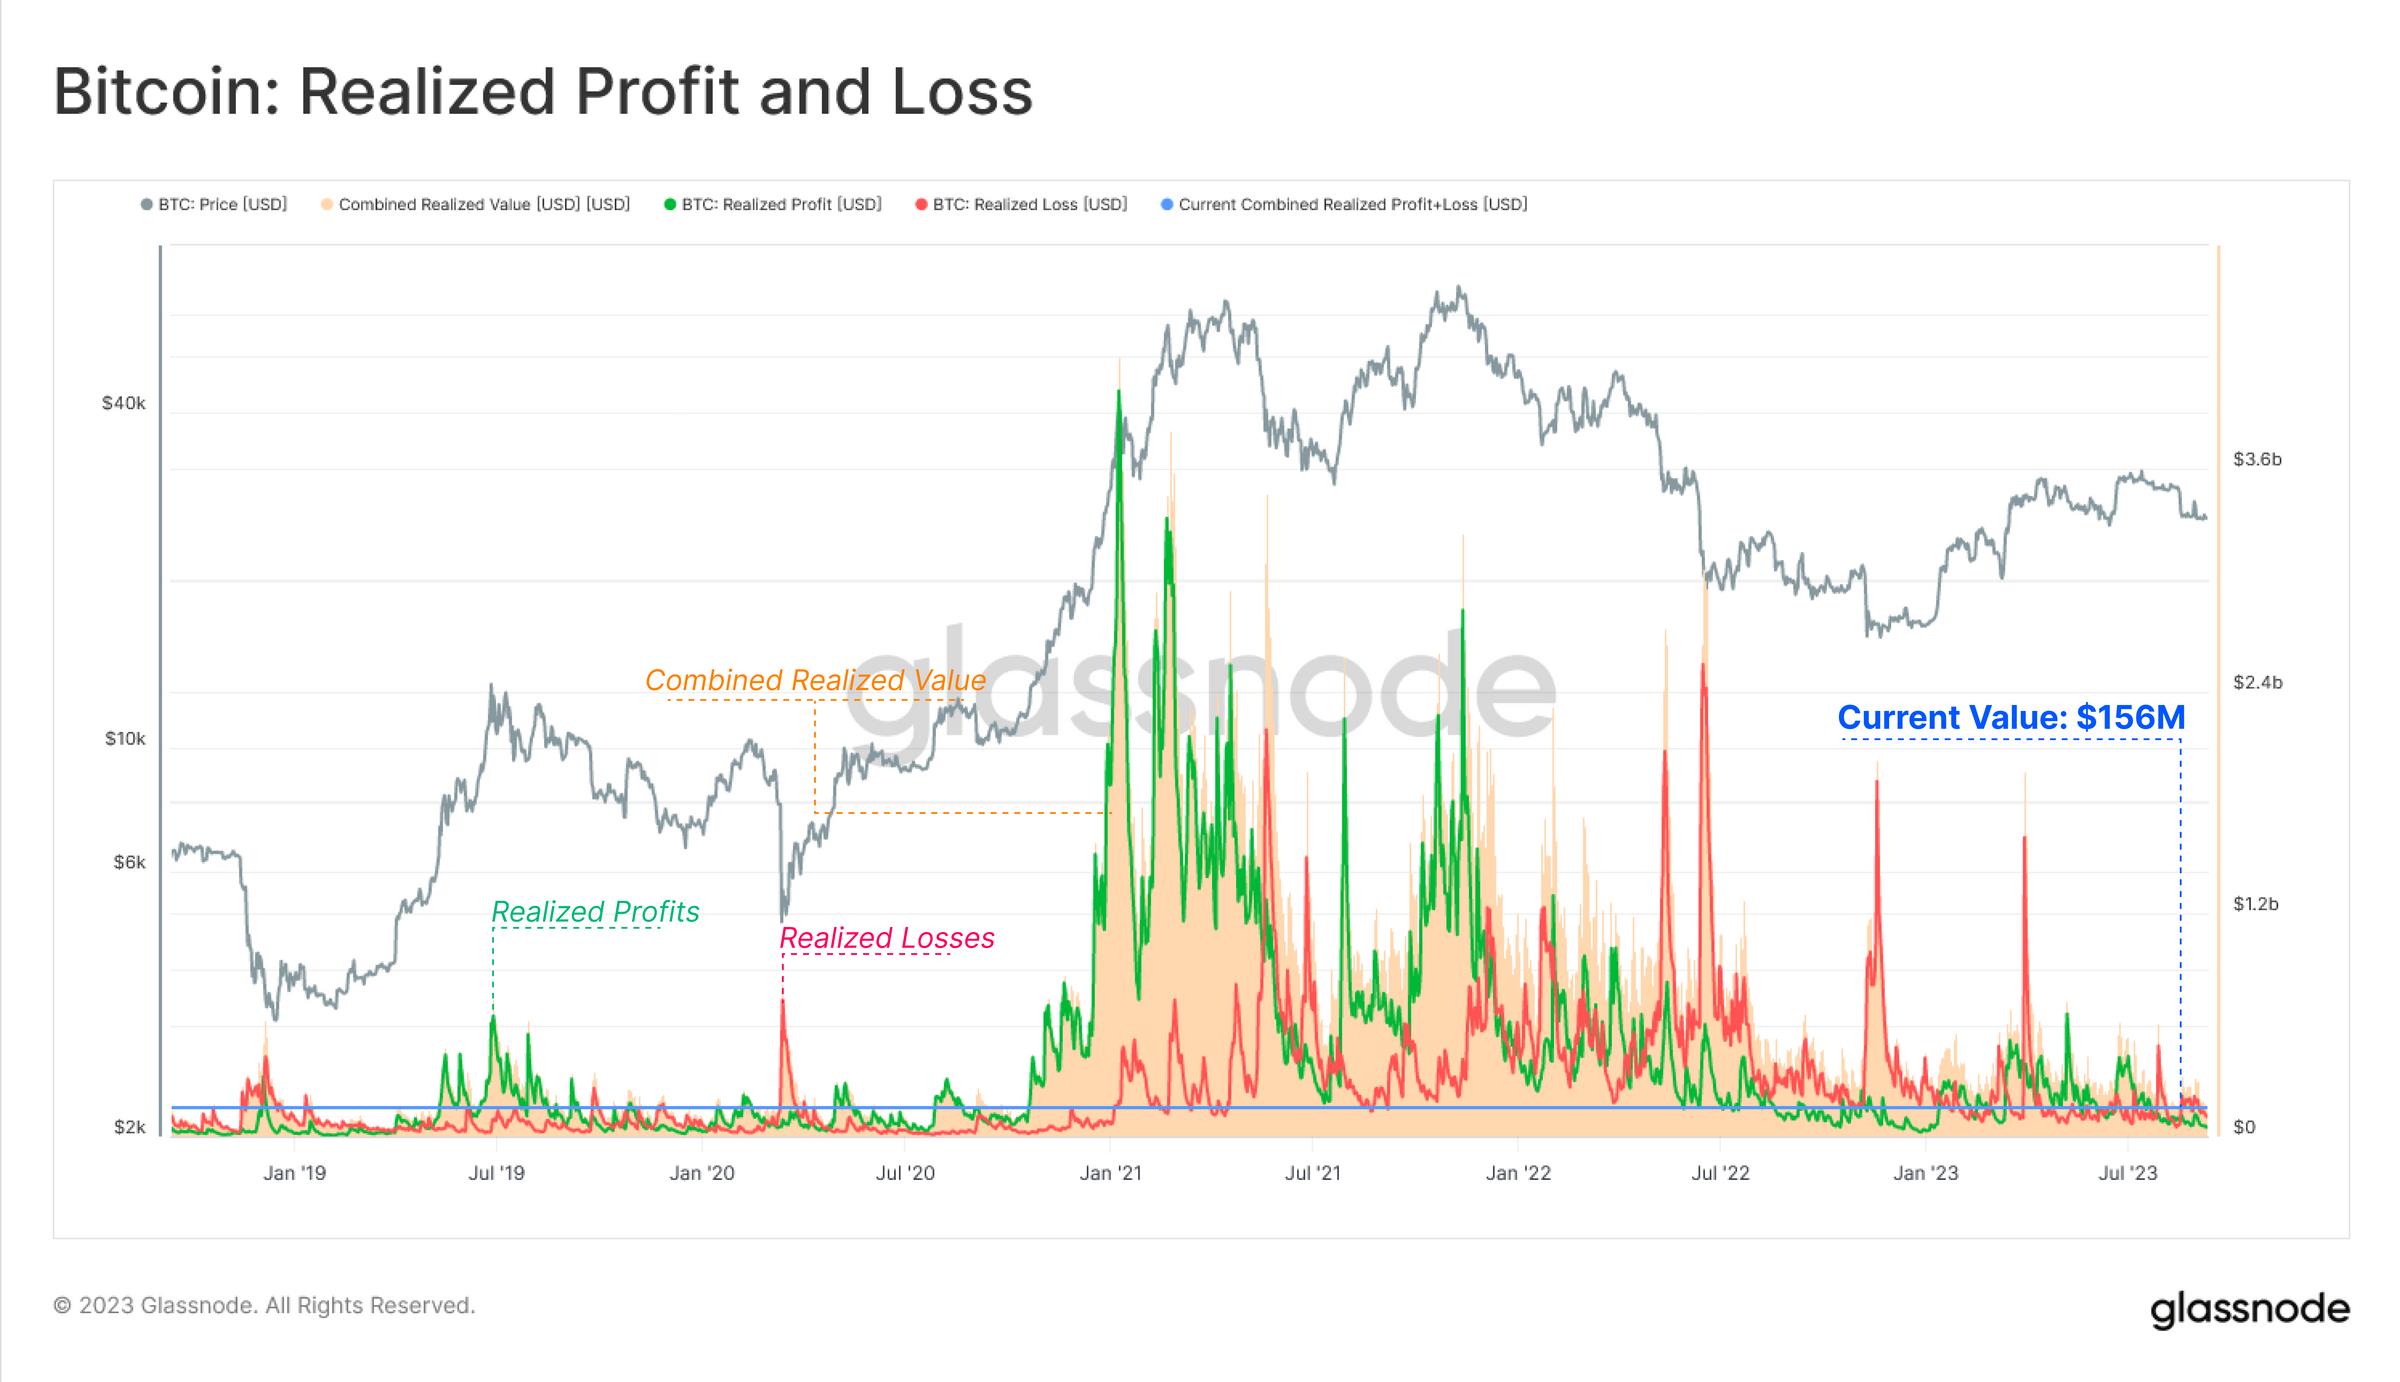
If we look at the realized value on the chain (the difference between the purchase and sale prices of the currency), we will find that it is still very calm. The overall locked profit or loss in the market is very small, which indicates that most of the traded currencies are close to their original purchase prices.
The realized profit and loss are comparable to the 2020 market level, highlighting that the prosperity of the bull market in 2021 may have completely disappeared.
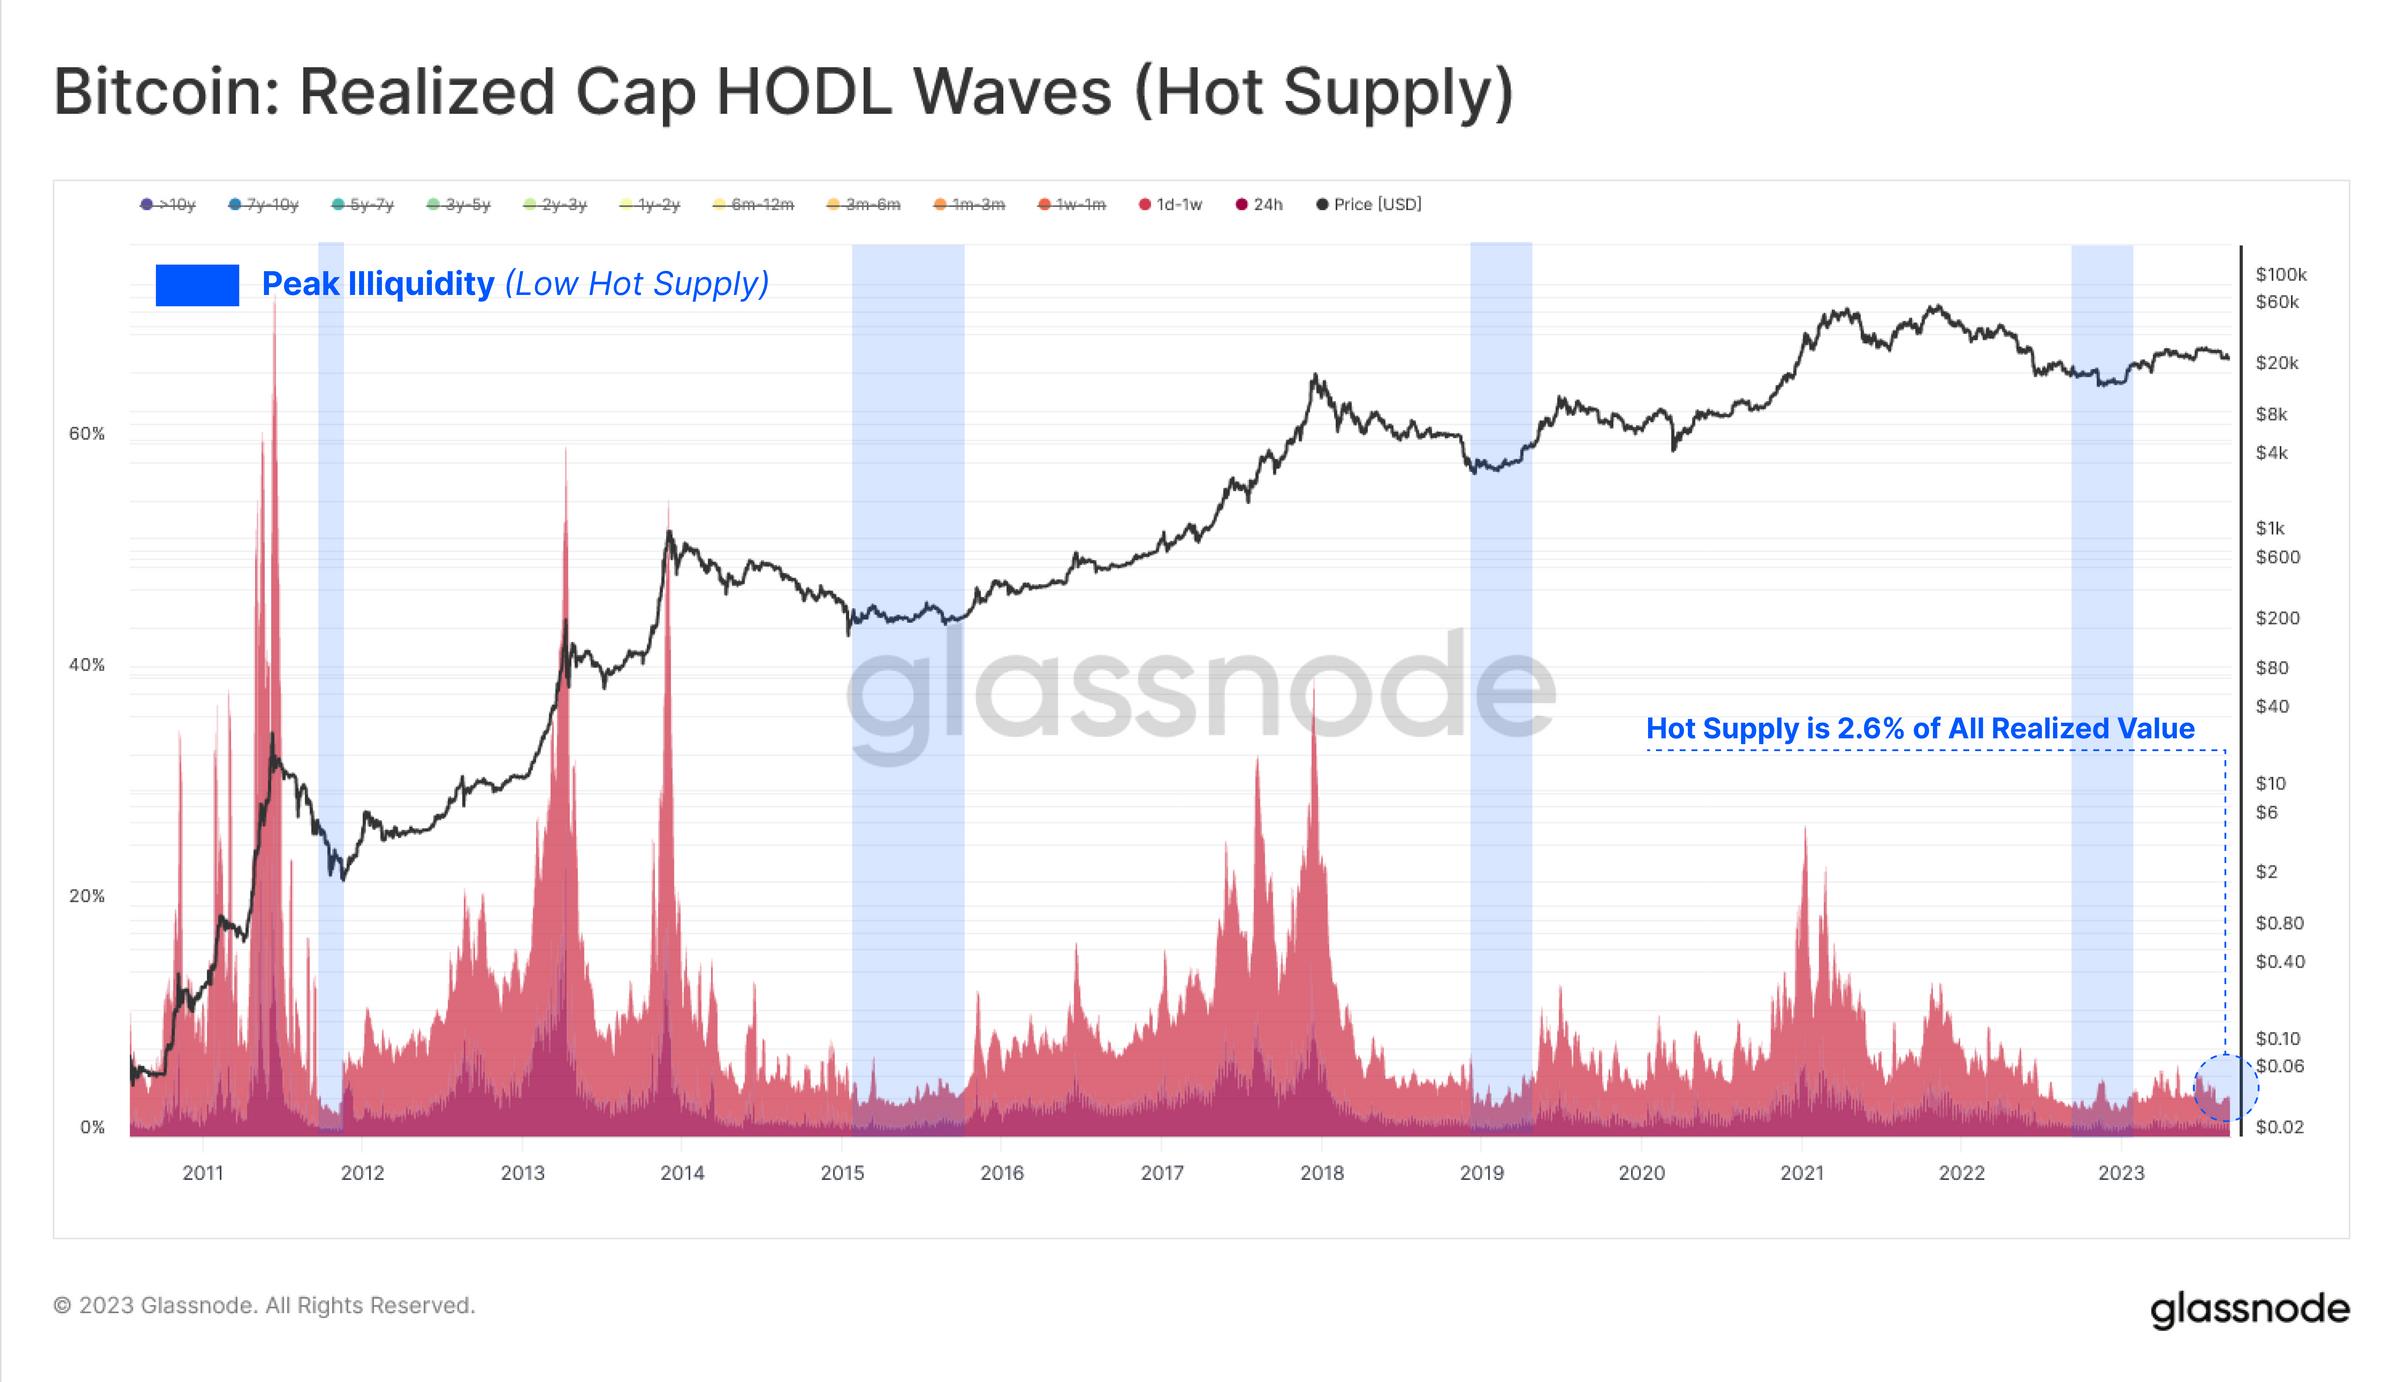
We can also track the low liquidity and indifferent sentiment on the chain by observing the proportion of wealth held by the “popular supply” group (currencies transferred in the past week) in the market.
Currently, the realized value held by the “popular supply” group is at a historically low level, indicating that there are currently very few currencies traded for more than a week.
Off-chain is also quiet…
In the off-chain derivatives market, we can also see that futures trading volume has suffered a similar fate, reaching a historical low of $12 billion per day. The only period with lower trading volume was the calm period at the end of 2022, when the price of Bitcoin fluctuated within a range of $557 for over two weeks.
However, we have noticed an interesting divergence in the options market, with trading volume experiencing significant growth in 2023, currently reaching $437 million per day. This may reflect the market’s tendency to use leverage and capital efficiency through options during periods of overall tight liquidity to express their views.
It should be noted that although the options market now has a comparable position size to the futures market, options trading volume is still an order of magnitude smaller.
Similarly, despite a few days of violent fluctuations last month, the implied volatility in the options market is still relatively low. The initial rise in volatility premium was short-lived, and the 1-month implied volatility has returned to a historical low of 33.9%.
Long-term holders
Due to the abnormal calmness in both on-chain and off-chain areas, the supply of Bitcoin held by long-term holders has reached a new all-time high, reaching 14.74 million BTC. In contrast, the supply held by short-term holders, representing the more active part of the market, has dropped to the lowest level since 2011.
Holding remains the main trend in the market, which indicates the strong belief of existing holders and highlights the possibility that these investors may be the only ones left.
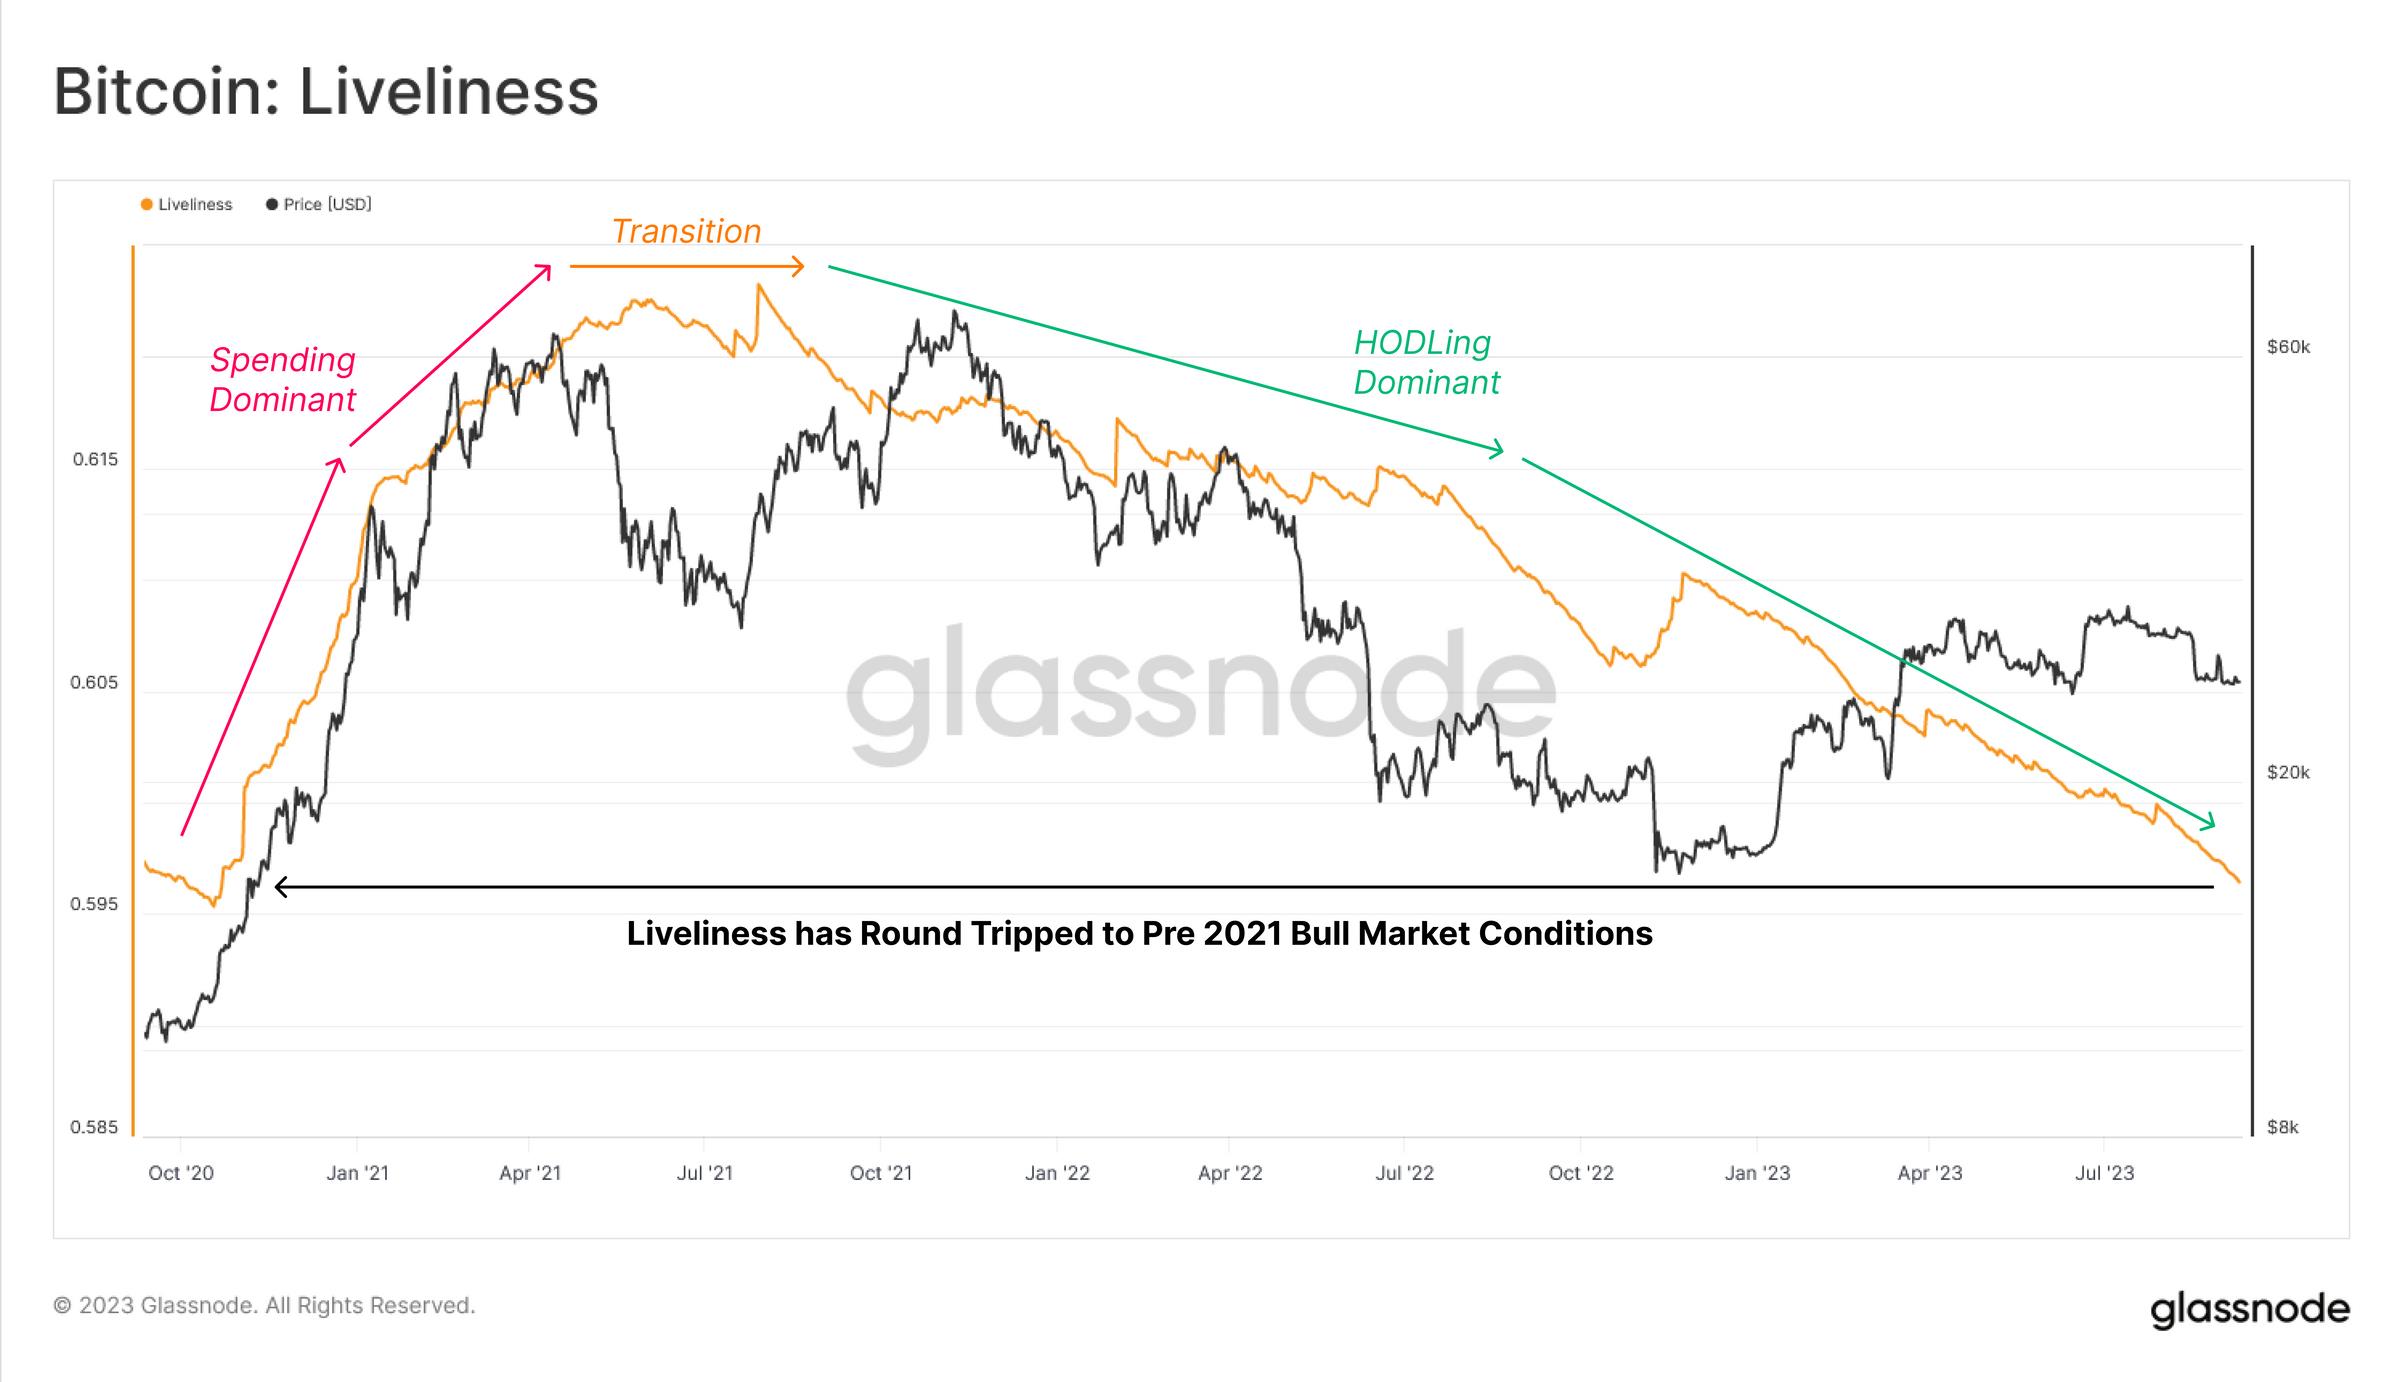
We can find consistency in the “activity” indicator, which elegantly compares the balance between overall coin-day destruction and coin-day generation. In other words, “activity” represents the relative balance of “investor holding time” in the market.
Consistent with the net seller market mentioned above, the “activity” experienced significant growth in 2021 as older coins were spent and profited from. With the bear market from May to December 2022, there was a strong downward trend. This marked the turning point from a trader’s market to a holder’s market.
The “activity” has now returned to the end of 2020 level and shows a gradually intensifying downward trend. This indicates an increase in overall “investor holding time,” with investors becoming less willing to spend and give up the coins they hold.
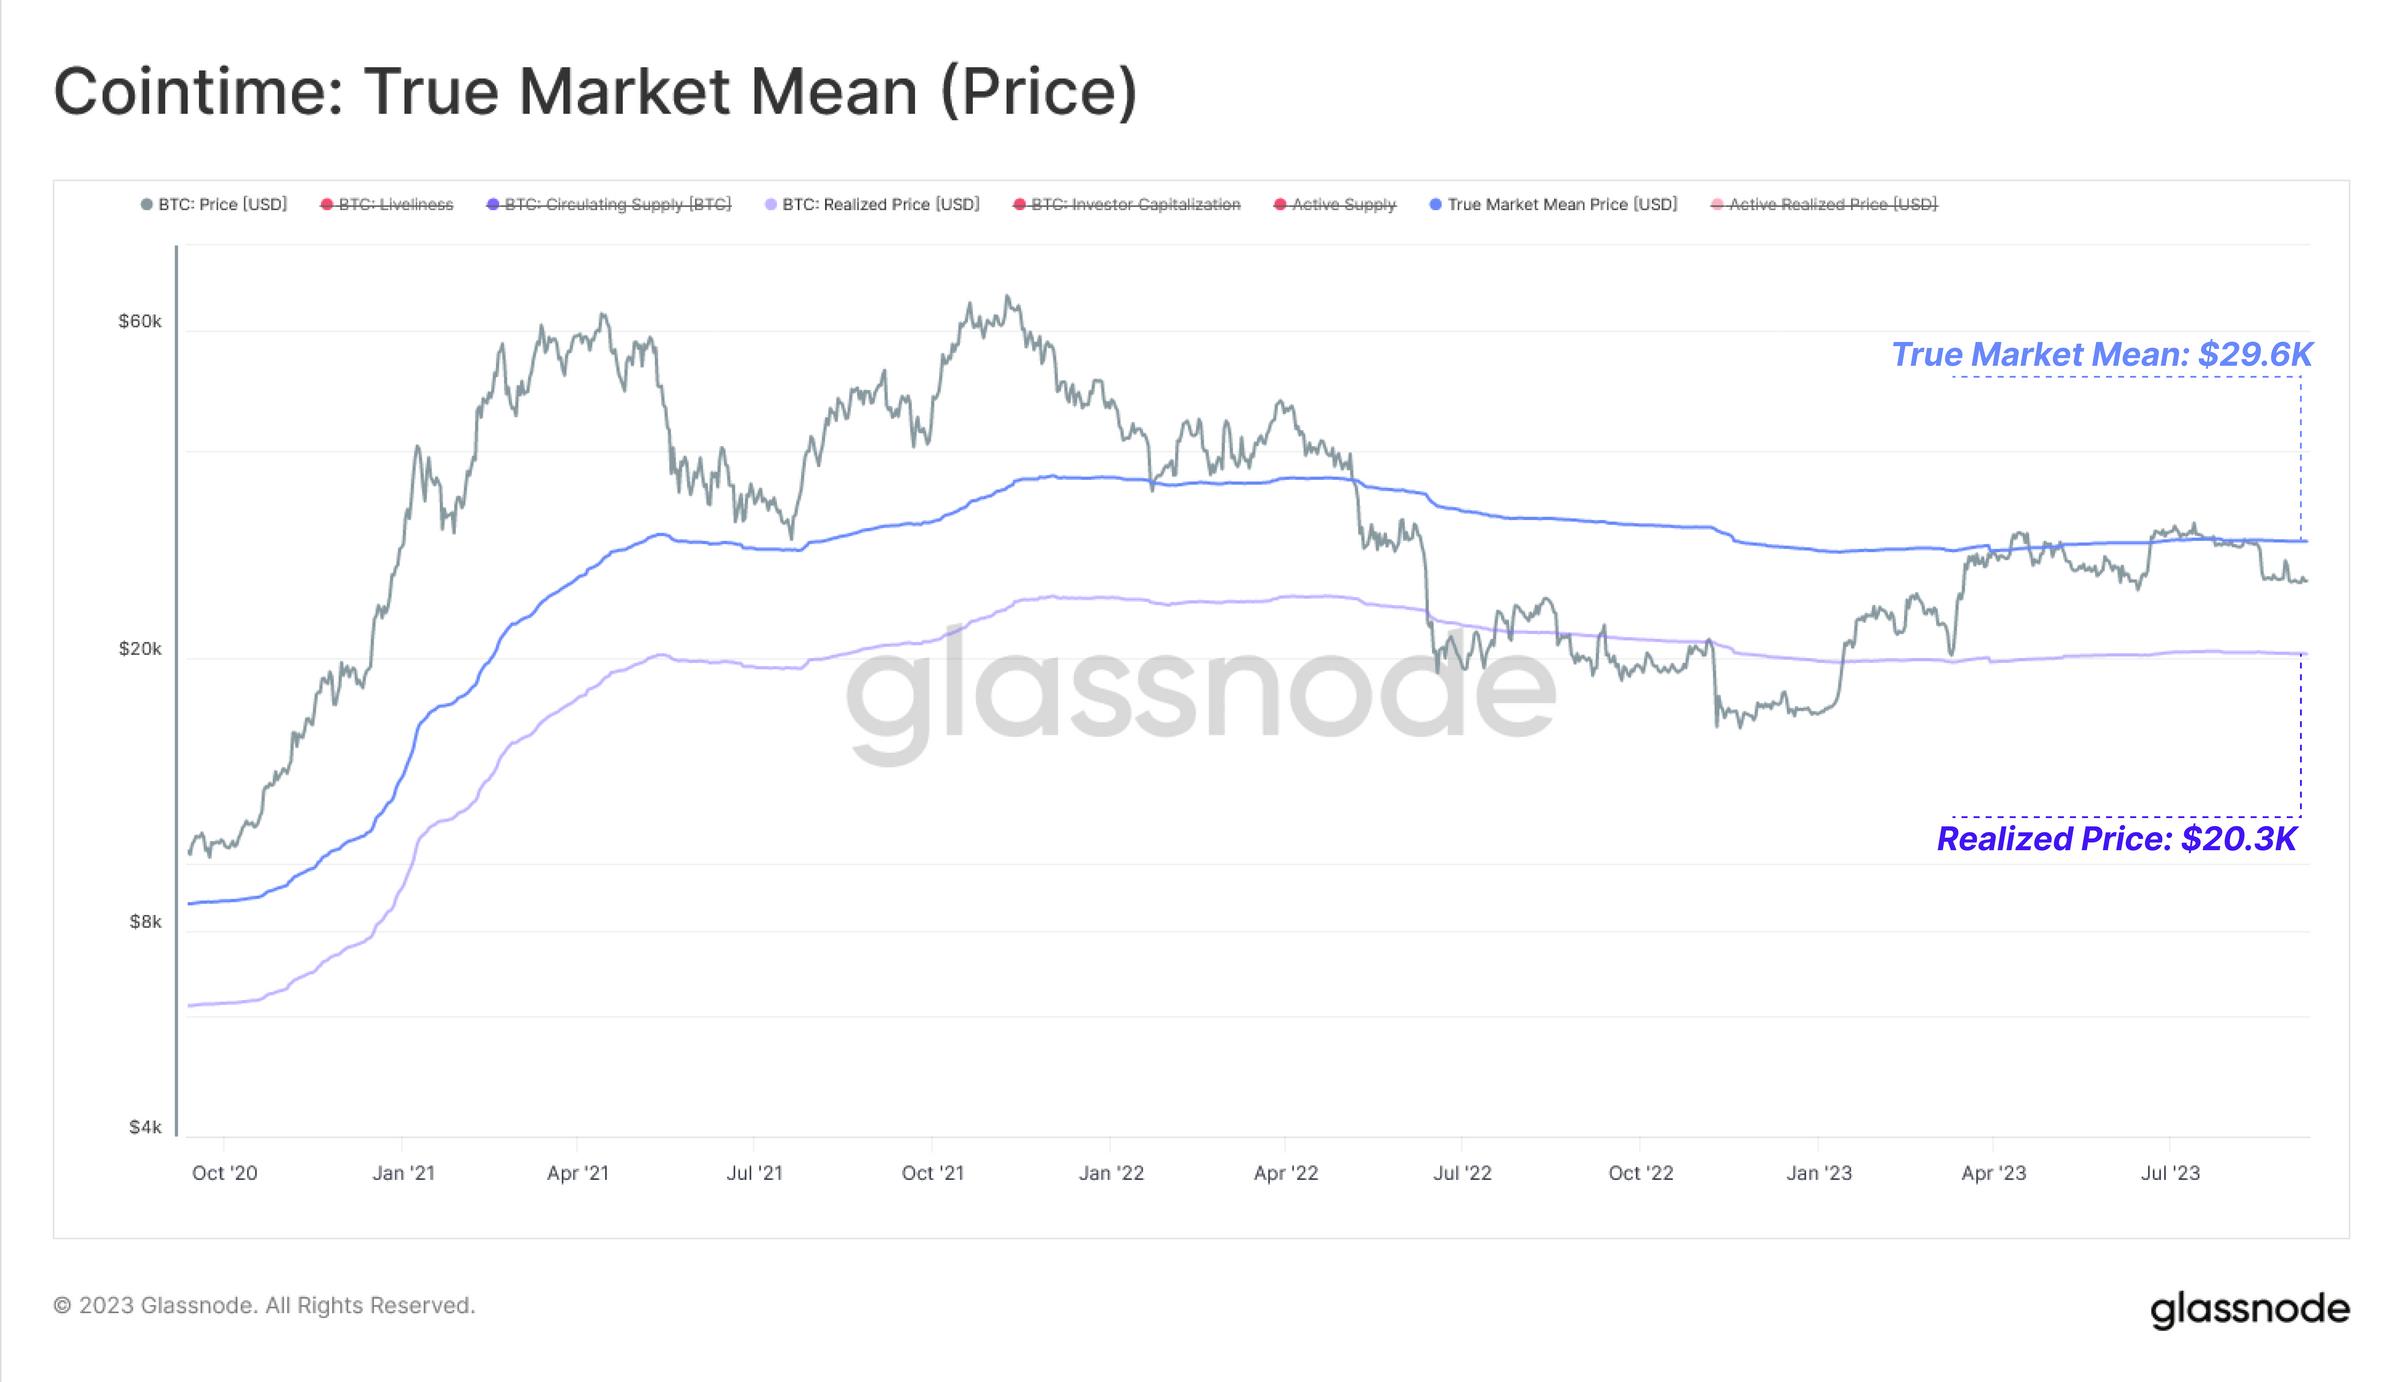
A key insight of this work is the development of the real market average price, which we believe is the most accurate “cost benchmark” model for active Bitcoin investors. The model is currently at $29,600 and has formed a psychological resistance level since April this year. The traditional realized price is $20,300, and both models have limited much of this year’s price action.
Market Sensitivity
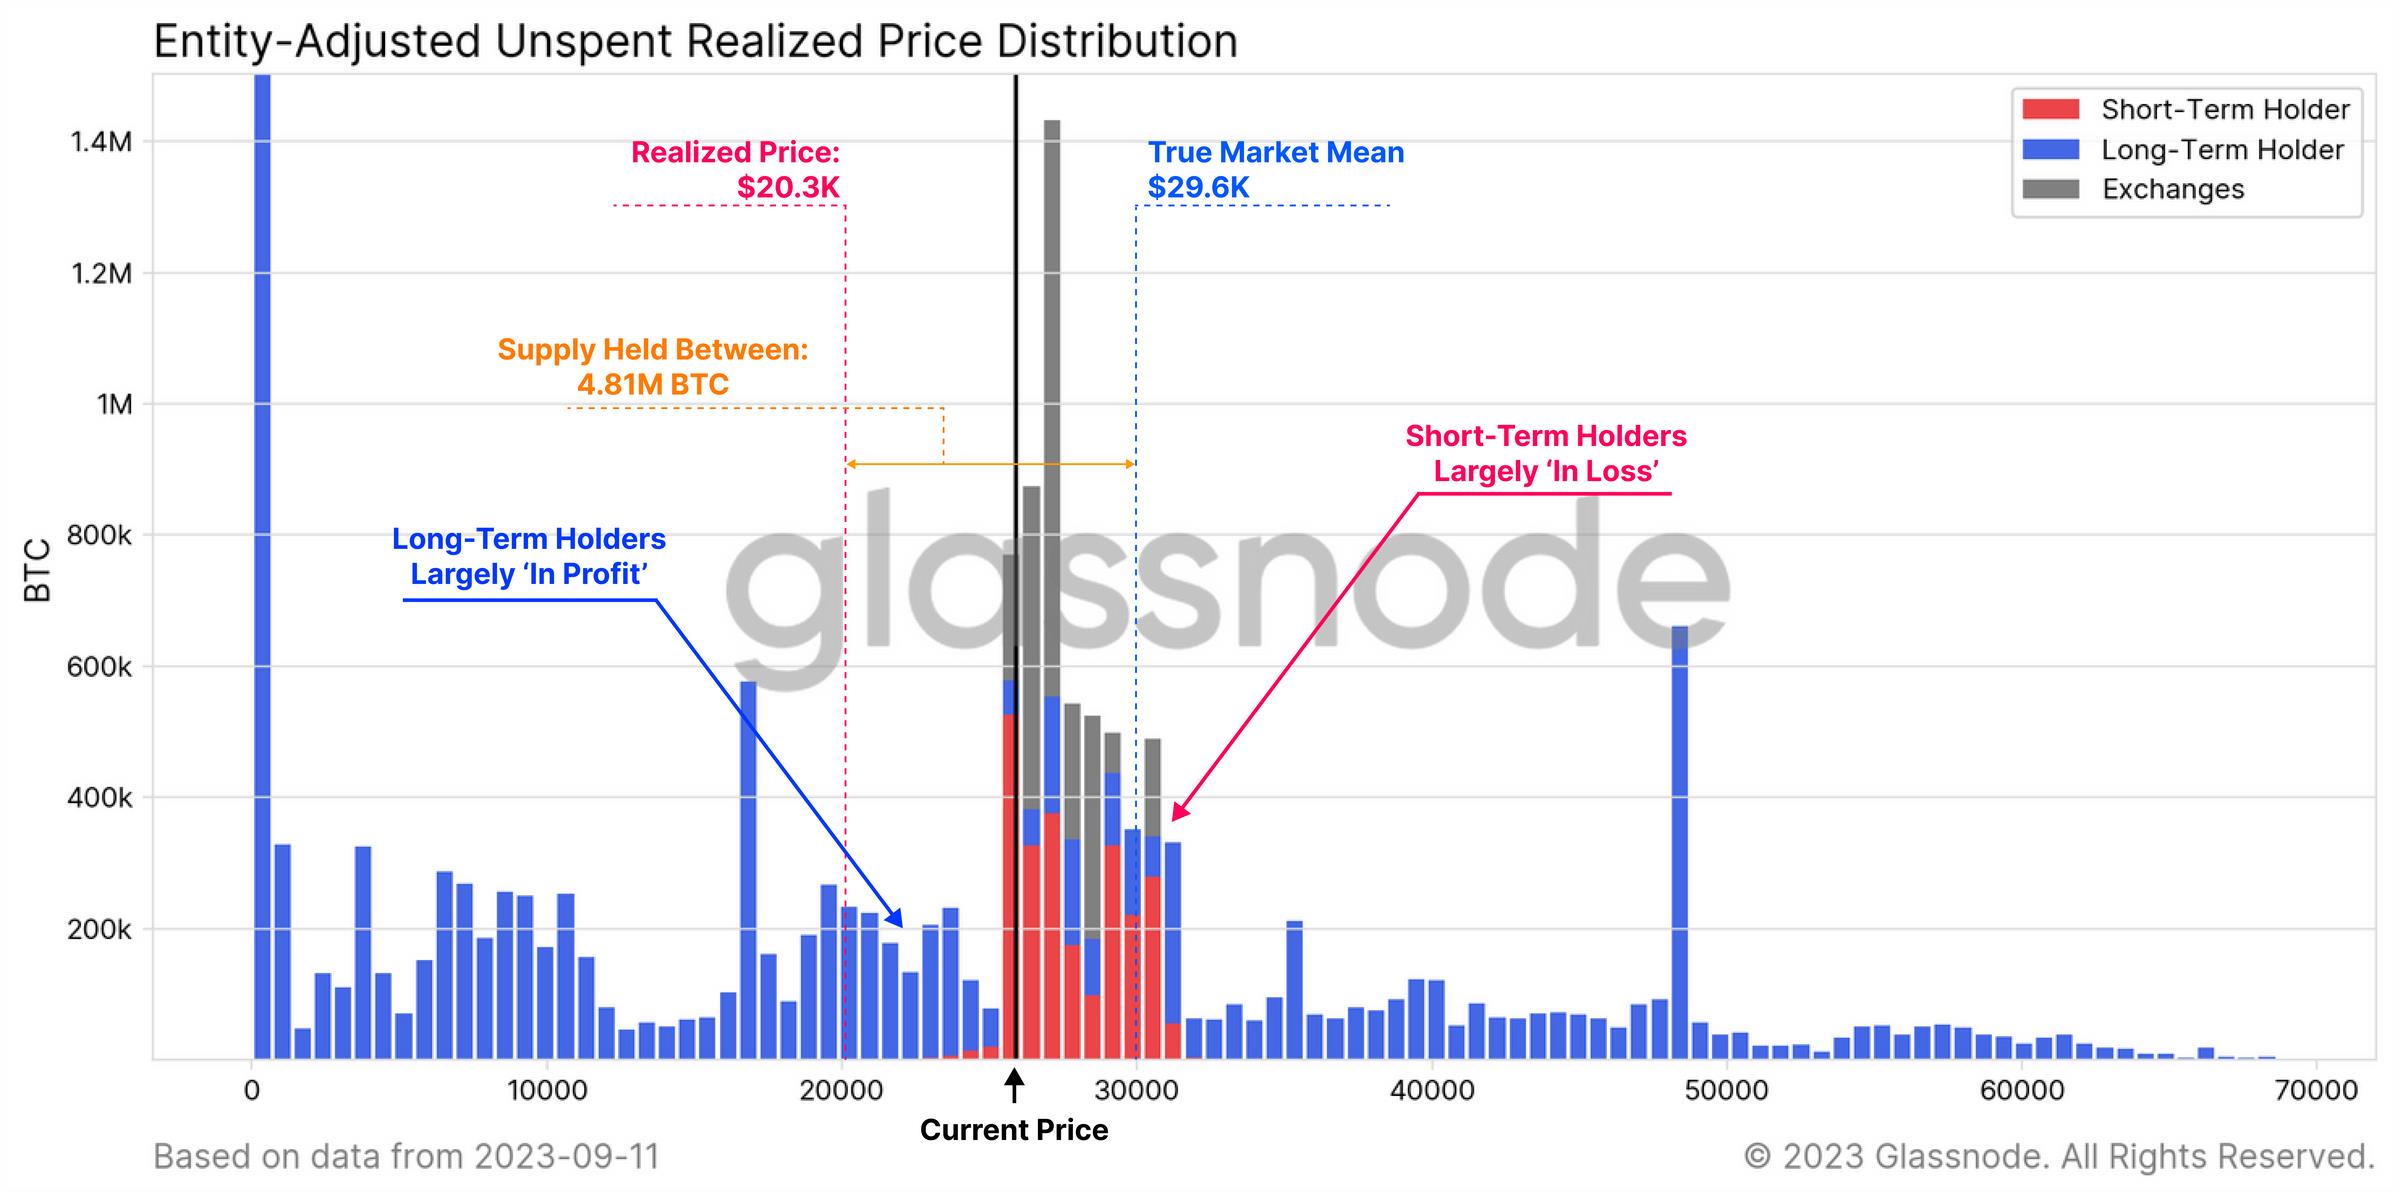
If we apply these two pricing models to the URPD chart and use them as psychological boundaries, we can better describe the supply situation obtained between these two models. Currently, more than 4.81 million BTC have a cost benchmark between $20,300 and $29,600.
We can also see that at the time of writing this article, the price is slightly below $26,000, and short-term holders🔴 are almost entirely in a loss position. It can be said that this makes the group that focuses more on price somewhat nervous.
The chart below shows the percentage of profit in the supply of short-term holders. We can see that the majority of their supply is trapped in unrealized losses, with only 16.3% of holdings still in the “profit” zone.
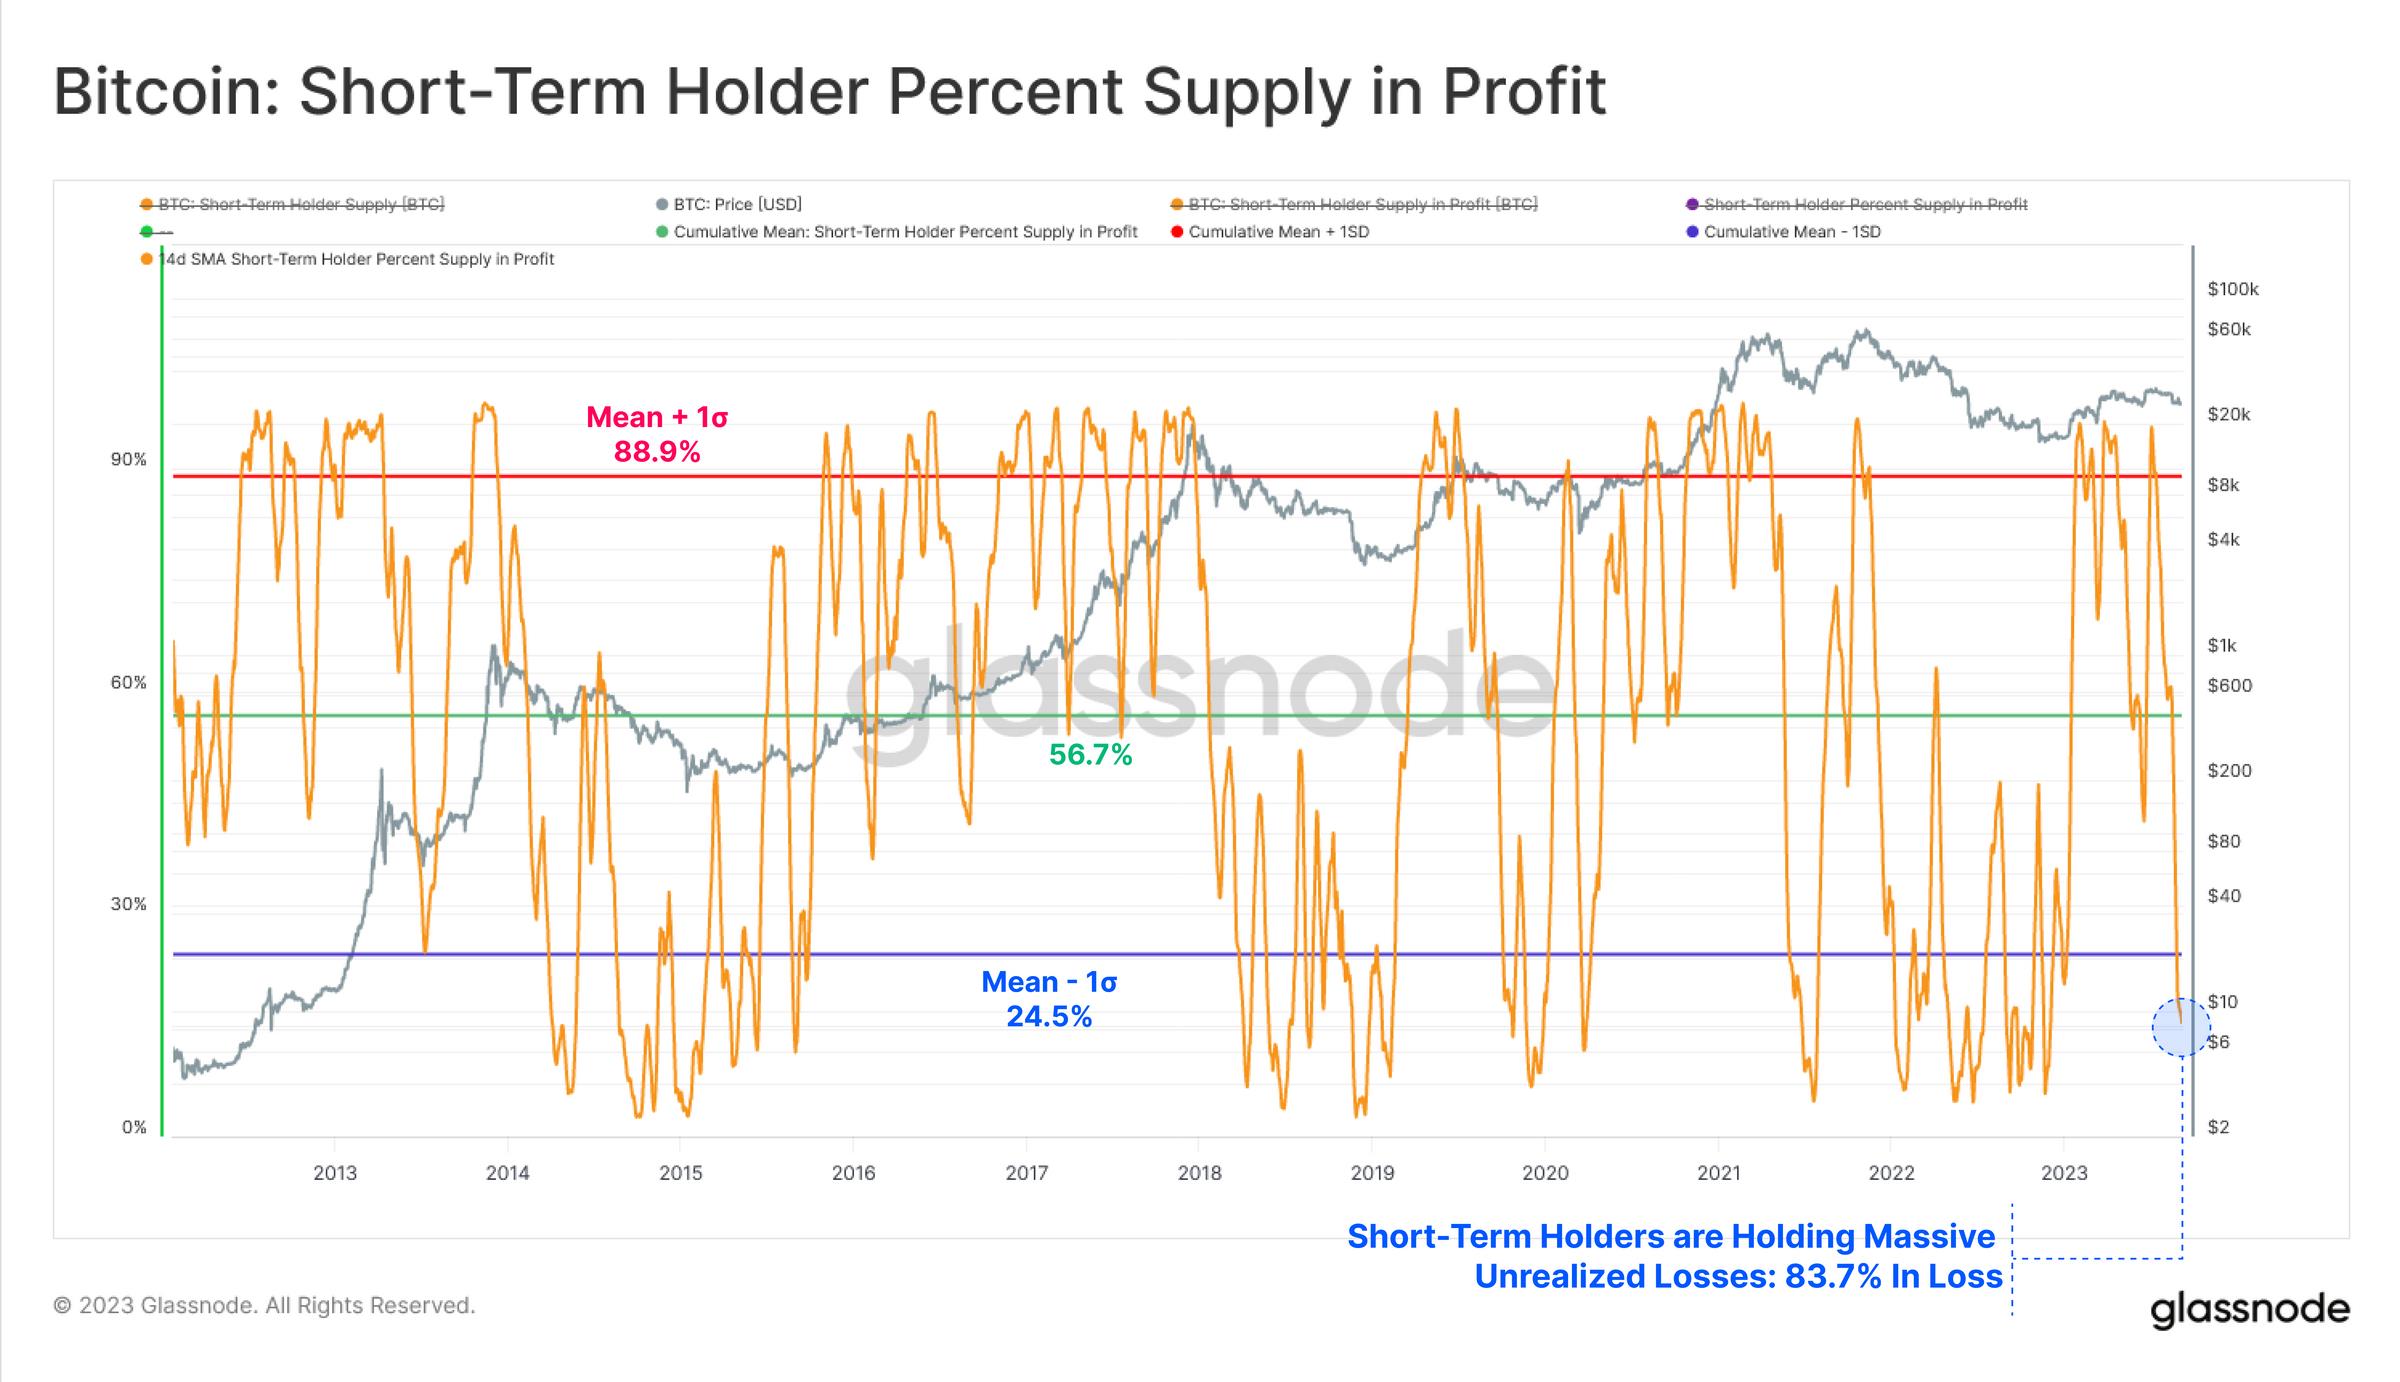
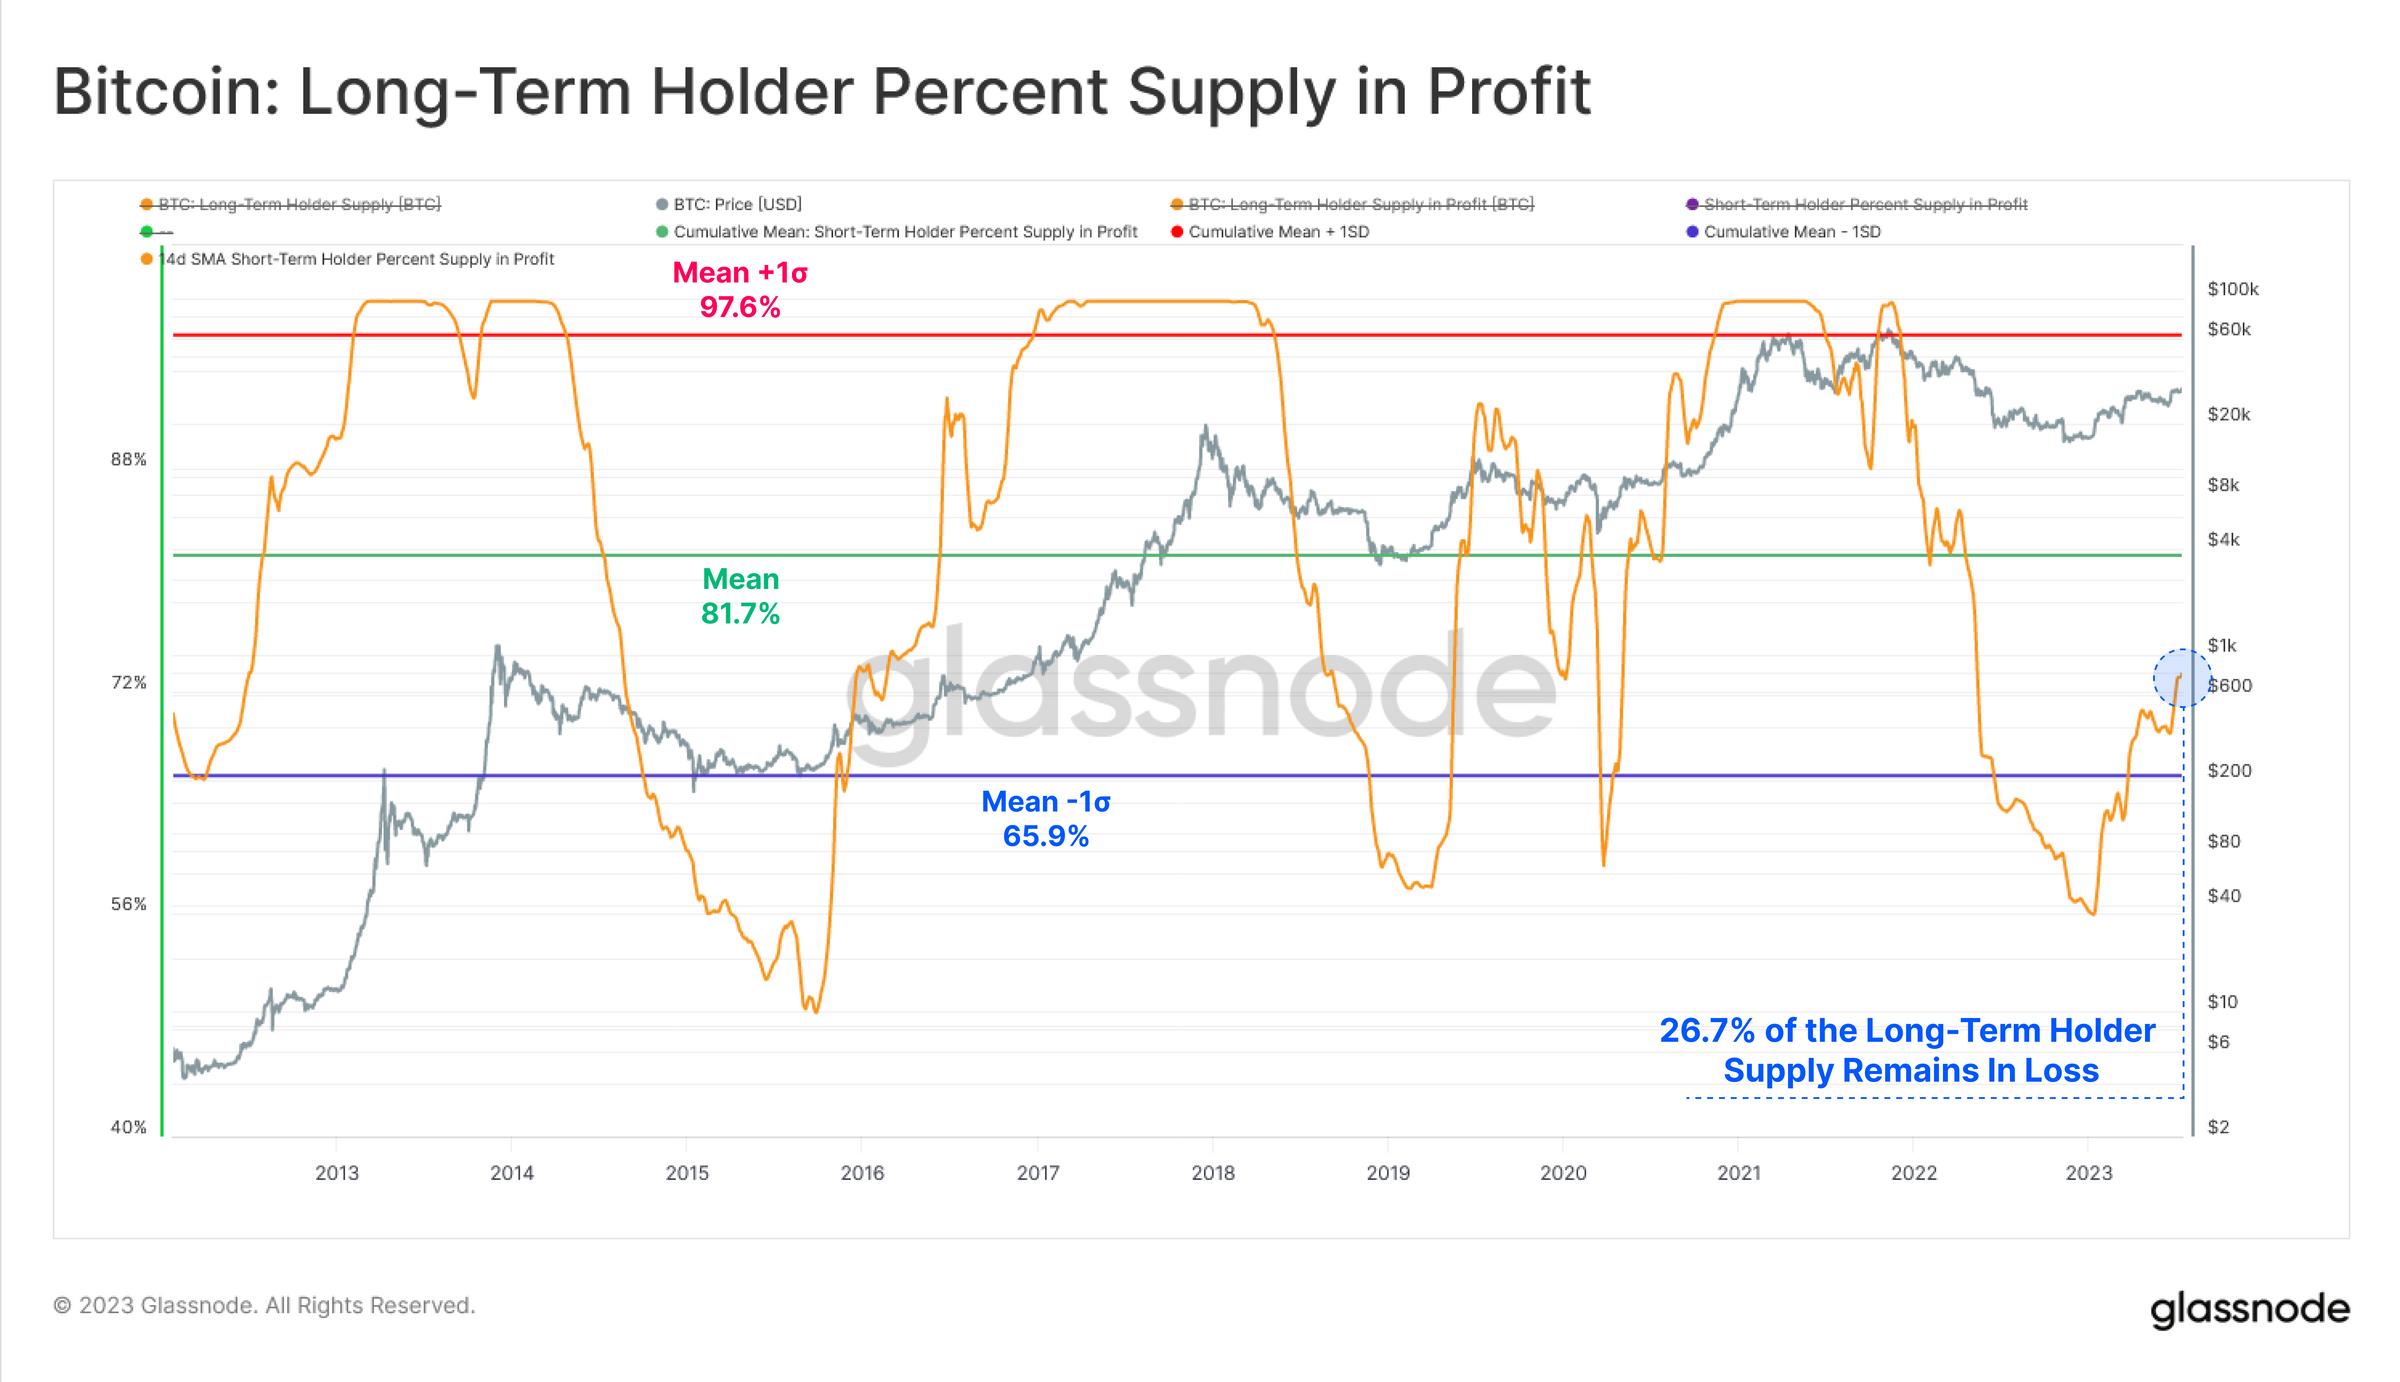
For long-term holders, their profitability is gradually increasing, although it is still at a historical low and only emerged from the negative one standard deviation range a few months ago. Although this is a positive trend, more than 26.7% of long-term holder supply is in a loss state, which is far below the historical average relative to their purchase price.
Although 2023 is a fairly reasonable recovery for Bitcoin and digital assets, these findings indicate that there are still several psychological cost benchmark barriers that need to be overcome.
Summary
Volatility, liquidity, trading volume, and on-chain settlement volume are all at historical lows. This increases the possibility of the market entering a period of extreme indifference, fatigue, or even boredom.
The long-term holder community remains steadfast, hardly giving up the tokens they hold. On the other hand, the short-term holder community is teetering on the edge of profitability, with many tokens having a cost benchmark higher than the current trading range of $26,000. This indicates that this group is becoming increasingly sensitive to prices, and many psychological price levels still need to be overcome.
Like what you're reading? Subscribe to our top stories.
We will continue to update Gambling Chain; if you have any questions or suggestions, please contact us!
