
Despite the market’s rise at the beginning of the week, by the close of Friday, the S&P 500, Nasdaq Composite, and Russell 2000 indexes had fallen for the second consecutive week, although the decline was slower than the previous week. The Nasdaq 100 fell for the first time in two weeks since December last year. The Dow Jones fell sharply on Tuesday but rebounded and ended the week with a gain. The market is currently aggressively adjusting long-term interest rates. Even though both macro and micro data are good, the market is not buying it because these expectations have already been priced in.
Now the focus of the market is whether the further decline of large technology stocks will drag down the overall market or if other stocks will help turn the tide.
In terms of sectors, large technology stocks have been particularly weak in the first half of this year, while oversold energy stocks have rebounded strongly. The S&P 500 energy sector has risen by about 10% since the third quarter. As of last Friday, international oil prices have risen for seven consecutive weeks, marking the longest streak since 2022. US crude oil is priced at $83 per barrel and Brent is priced at $86.5 per barrel.
Regarding whether the AI frenzy is repeating the internet bubble of the late 1990s, analysts from various institutions have summarized their arguments as follows:
- Worldcoin in the Polkadot ecosystem? Analysis and interpretation of another UBI project Encointer
- In the customized Layer2 track, why is it said that OP Stack wins at the starting line?
- Delphi Digital Report Summary Discussing Solana’s Future Development Catalyst from a Cyclical Perspective
Analysts who hold a positive view on the current rebound believe that it is different from the bubble period. AI-related companies are at the forefront of technology that will change society in the next few years. Although the valuation of technology stocks is an issue that needs to be closely watched, AI is driving the technology industry into a “1995 moment,” and future growth will be unprecedented since the 1990s.
Analysts who are skeptical believe that the current market frenzy is filled with speculation and false hopes. They warn that the surge in technology stocks is just a bubble. The previous boom and bust cycles of technology stocks have shown that it is much more difficult to select a few companies that may ultimately dominate a specific industry in the long run than people imagine.
Overall, the market has already digested many good news, including better inflation trends, the possibility of the Federal Reserve pausing interest rate hikes, and the continued economic growth above trend. The current level of market correction is healthy, allowing the market to digest recent gains and prepare for potential upward movement.
Historical data shows that since 1950, the S&P 500 index has experienced 35 instances of a rise of over 15%. On average, there is at least one pullback within six months after a rebound. The magnitude of these pullbacks ranges from -2.5% to -19%, with an average of -8.2% and a median of -7.6%. Currently, the S&P 500 index has only fallen by about 3% since its recent high on July 31st.
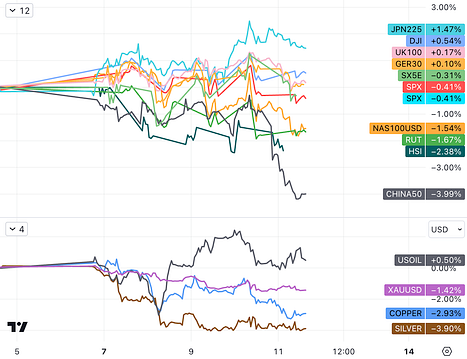
In other markets, as the yen depreciates, the Japanese stock market surged by 1.47%. European stock markets were trading sideways, with slight gains in the British and German markets. The Stoxx50 fell by 0.3%. The Chinese stock market performed the worst due to the sharp drop in social financing data, with the A50 falling by 4%, the Golden Dragon Index falling by 6.55%, and the CSI 300 falling by 2.9%.
Bond Market
The yields on various ten-year US Treasury bonds have roughly returned to the levels before the release of the US non-farm payrolls report last Friday. The ten-year Treasury bond has risen by about 12 basis points this week, marking three consecutive weeks of increases. The two-year Treasury bond, which is more sensitive to interest rate prospects, has risen by about 13 basis points this week, erasing the 11 basis point decline from last week and marking the second consecutive week of increases in the past five weeks.
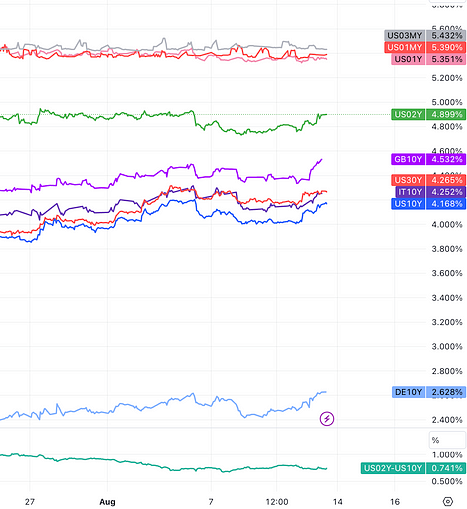
The yield on US 30-year Treasury Inflation-Protected Securities (TIPS) is approaching the key level of 2% without any limit. If it breaks through, it will be the first time since 2011, and numerous bond investors are waiting anxiously. The upward pressure on TIPS and long-term nominal US Treasury bond yields reflects the market’s high level of uncertainty about the inflation path, despite the decline in inflation indicators and inflation expectations from surveys released this week.
Foreign Exchange Market
The US dollar index is at 102.80, rising by about 0.8% last week, marking four consecutive weeks of gains. Among non-US currencies, the Japanese yen performed poorly, falling against the US dollar for five consecutive days, reaching a threshold of 145.00 last September when the Japanese government intervened in the foreign exchange market. The offshore renminbi against the US dollar is reported at 7.2601, with a cumulative decline of 722 points last week, marking two consecutive weeks of declines.
Digital currencies rallied briefly in the middle of next week due to expectations of ETF approval, but were ultimately suppressed by a strong US dollar and rising bond yields. Bitcoin failed to break through the 30,000 level for the second time in August, but overall, it remains above the 29,000 level and has shown relative resilience in the face of pessimism in traditional markets in recent weeks.
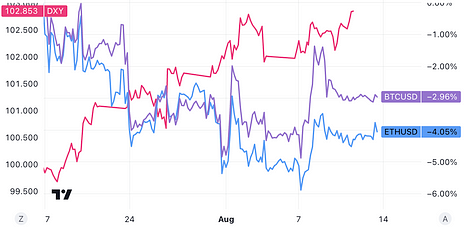
Spot gold fell by 1.49% to $1,913 per ounce for the entire week, marking the largest weekly decline since the week of June 23rd and marking three consecutive weeks of declines. In the past two weeks, it has fallen by over 1% each week.
Review of Hot Events
Inflation Expectations
On Thursday, the US inflation rate for July, measured by the Consumer Price Index, was 3.2%, slightly lower than market expectations. The core inflation, which excludes energy and food, increased by 0.2% this month, the same as in June. The consecutive 0.2% month-on-month growth of core CPI is a positive signal, indicating that price pressures are easing, which may lead the Federal Reserve to consider pausing interest rate hikes. However, the rebound in energy prices shows that inflation slowdown is not smooth sailing.
In this data release, prices of used cars (-1.3%) and furniture and appliances (-0.4%) continued to decline, and airfare prices (-8.1%) fell sharply for the second consecutive month. In addition, prices of services such as hotels (-0.5%) and car rentals (-0.3%) also decreased, playing an important role in restraining core inflation.
However, fuel (+3.0%), gasoline (+0.2%), and natural gas services (+2.0%) all rose in July, and global oil prices have continued to rise since August, indicating that energy prices may further increase month-on-month in August, posing an upward risk to energy inflation.
Since late June, oil prices have continued to rise due to production cuts by countries such as Saudi Arabia and Russia. JPMorgan Chase currently predicts that oil prices may reach $90 by September, as the spot market supply and demand is rapidly tightening.
Driven by the rise in service prices, the US July PPI announced on Friday exceeded expectations with a year-on-year growth rate of 0.8%, up 70 basis points from the previous estimate. The core PPI, which excludes the more volatile food and energy components, did not slow down as expected, but slightly accelerated to 2.4%. Both PPI and core PPI month-on-month growth rates were slightly higher than expected.
The US PPI reflects sticky high inflation, offsetting the brief optimism brought by the CPI data. After the data was released, the US dollar index erased its losses and jumped, US Treasury prices plunged and yields rose, the benchmark 10-year and more interest rate-sensitive 2-year US bond yields hit a one-week high, and the US stock market and cryptocurrencies both declined.
The preliminary estimate of the University of Michigan’s 1-year short-term inflation expectations for August unexpectedly dropped to 3.3%, matching the lowest level in over two years, and long-term inflation expectations also retreated slightly. The overall consumer confidence index for this month fell slightly compared to July.
The confirmation of the El Niño phenomenon has led the EU to believe that it may worsen next year. India has already started restricting rice exports, leading to a surge in Asian rice prices. Now, supply-side pressures have spread beyond energy to food.
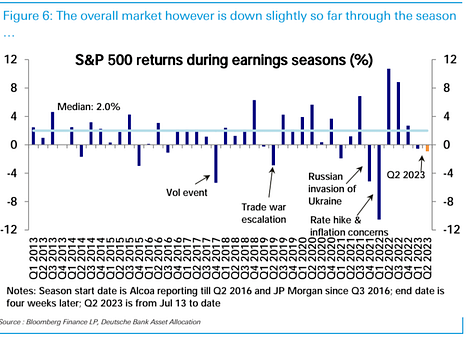
Q2 Earnings Season
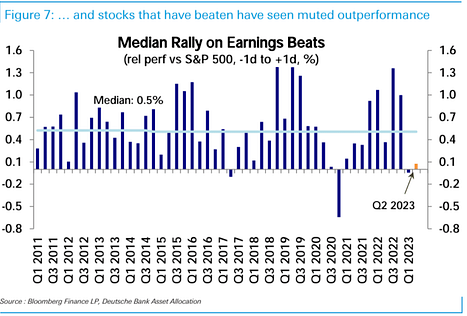
The second-quarter profits of the S&P 500 fell by 4% year-on-year, lower than the expected 9% decline at the start of the earnings season in July. Both revenue and profit margins have increased. 54% of the S&P 500 companies exceeded consensus EPS estimates by at least one standard deviation. On average, companies that beat EPS expectations outperformed the S&P 500 by more than 0.8% on the day after reporting.
Moody’s Downgrades Ratings
Moody’s downgraded the credit ratings of 10 small and medium-sized banks in the United States on Monday and pointed out that several larger banks are under review. The move by the rating agency reflects the challenges still facing the banking industry, including increasing loan costs and declining profitability.
Contrasting Results in US Bond Auctions
The successful bid rate for the $38 billion 10-year US Treasury bond auction on Wednesday reached a seven-month high, with overseas indirect buyers receiving a record-high allocation of 72.2%, far surpassing the previous auction’s allocation of 67.7%. The surprise in this week’s wave of US debt issuance is that buyers were not scared away. Following the strong demand for the $42 billion three-year US bond sale on Tuesday, the ten-year US bond issuance on Wednesday experienced a rare strong demand this year, with astonishing buying power from overseas buyers.
On Thursday, the US Treasury completed a $23 billion 30-year Treasury bond auction, with the successful bid rate reaching the highest level since July 2011. The bid-to-cover ratio for this auction was 2.42, the lowest since April this year. The results of this 30-year Treasury bond auction were somewhat unexpected, as the market had expected an easy completion on Thursday. However, long-term US bond sales faced challenges.
Challenges for China
In July, China’s exports fell by 14.5% year-on-year, the largest decline since February 2020; imports also fell by 12.5% during the same period. The decline in import and export data released on Tuesday has exacerbated the weakening of the country’s economic situation, adding to the previously announced negative inflation, marking the first time China’s economy has fallen into deflation since the outbreak of the pandemic.
In July, China’s new loans denominated in renminbi and the increment of social financing both plummeted, reaching a nearly 14-year low. In terms of social financing, the scale was 528.2 billion yuan in July, significantly lower than the expected 1.1 trillion yuan and the previous value of 4.22 trillion yuan. The year-on-year growth rate of M2 money supply in July was 10.7%, lower than the expected 11% and the previous value of 11.3%. In terms of new renminbi loans, it was 345.9 billion yuan in July, much lower than the expected 800 billion yuan and the previous value of 3.05 trillion yuan. The slow growth in credit is mainly due to:
- A year-on-year increase of only 49.9 billion yuan in corporate loans, mainly due to the overdrawn demand caused by the early release of corporate loans in June under the guidance of the “stable growth” policy;
- A year-on-year increase of only 215.8 billion yuan in medium and long-term loans to residents, mainly due to the weak issuance of mortgage loans and a heavier burden of repayments. Short-term loans to residents increased by only 106.6 billion yuan year-on-year, reflecting a slow recovery in credit card and consumer loans.
- However, the Central Political Bureau meeting held at the end of July has already recognized the economic challenges. The meeting proposed that the current economic operation is facing new difficulties and challenges, and in the second half of the year, macroeconomic policy adjustments should be intensified to focus on expanding domestic demand, boosting confidence, and preventing risks. Investors expect that China’s regulatory authorities will comprehensively strengthen their efforts in monetary, fiscal, real estate, and even capital market policies in the future.
Alibaba FY2024 Q1 Financial Report
On August 10th, Alibaba released its financial report for the first quarter of the fiscal year 2024 (ending on June 30th). As the first financial report after the split of its six major businesses, these data not only explain the operating conditions of Alibaba for one quarter, but also serve as a test of the effectiveness of its organizational structure transformation.
Alibaba achieved a total revenue of 234.156 billion yuan, a 14% increase compared to the revenue of 205.555 billion yuan in the same period last year. The net profit was 33 billion yuan, a 63% increase compared to the net profit of 20.298 billion yuan in the same period last year. Such data once again demonstrates the vitality of the Chinese e-commerce industry to the market.
However, it is worth noting that the international digital commerce had the fastest revenue growth rate in this quarter. Its revenue increased by 41% compared to the same period last year, with international retail business revenue growing by 60% and order growth of about 25% year-on-year. For Jiang Fan, who took charge of overseas e-commerce business three years ago after being transferred from the Tmall sector, the current operating data once again validates his capabilities.
In addition, Alibaba Cloud achieved growth in both revenue and profit in this quarter. The financial report shows that the revenue increased by 4% year-on-year to 25.123 billion yuan, and the adjusted EBITA increased by 106% year-on-year. (Adjusted EBITA can more accurately reflect the company’s daily operating profit capability as it excludes the impact of non-operating expenses such as interest, taxes, depreciation, and amortization. A high adjusted EBITA usually indicates strong profit capabilities.) The growth of EBITA is much higher than that of revenue, which may involve cost reduction, improved production efficiency, or changes in the company’s profit structure.
Consumer Confidence Declines
After reaching a high point in July, the US consumer confidence index slightly declined in mid-August, but it still remains at a relatively high level compared to the same period last year. The survey data released by the University of Michigan on Friday showed that the preliminary consumer confidence index decreased from 71.6 in July to 71.2 in August, and it noted that consumers “perceive little change in the overall economic environment compared to the previous month”.
UK Q2 GDP Exceeds Expectations
The UK’s Q2 GDP grew by 0.4%, exceeding expectations of only 0.2%. Strong growth in household and government spending provides more room for the Bank of England to raise interest rates, leading to significant market volatility on Friday. After the release of this data, UK government bonds plummeted, the UK stock index came under pressure, and GBP received a short-term boost, causing the US dollar to rise by 100 basis points. Prior to this, there were doubts in the market about whether the Bank of England could complete this round of interest rate hikes, but the strong economic data has boosted market confidence. However, only the foreign exchange and interest rate markets have responded more fully, while the impact on the stock market is limited.
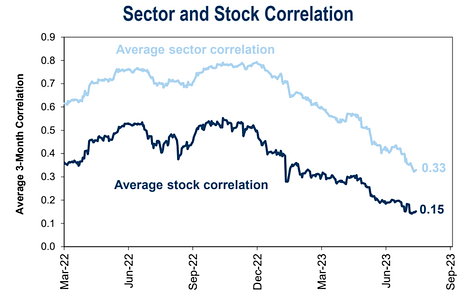
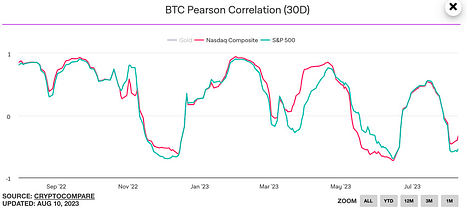
Correlation Declines
The correlation between digital currencies and stock indices has reached a low point, and the internal correlation within stocks has also reached a trough. The influence of technology and innovation, as well as the uncertainty of global economic and trade trends, are the main background reasons.
Changes in Fund Positions
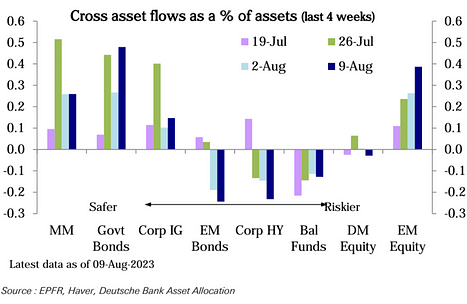
According to Deutsche Bank’s statistical caliber, the overall stock position has continued to decline over the past three weeks and is now at a two-month low. This is mainly due to a sharp decline in subjective investor positions, which have given back more than half of the substantial increase from the end of May to mid-July and are now approaching neutrality.
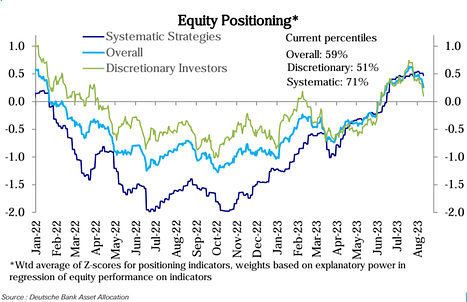
Systematic strategy positions have been slowly increasing since mid-June and experienced a slight decrease last week. The key factors affecting stock positions are unexpected macro data, earnings season, and interest rate volatility. Macro expectations have been steadily improving, with growth data rising and inflation data falling, making it more difficult to obtain further positive data surprises.
The second quarter earnings season performed strongly, with company performance exceeding expectations. However, the market as a whole has slightly declined after the earnings season, and the performance of companies that exceeded expectations is not outstanding.
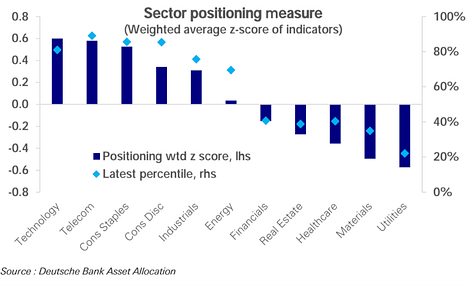
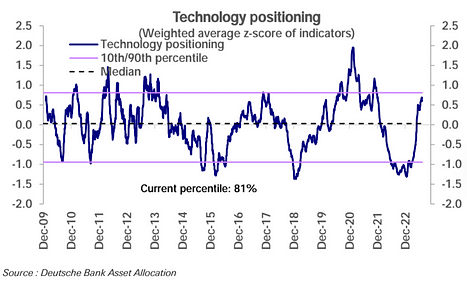
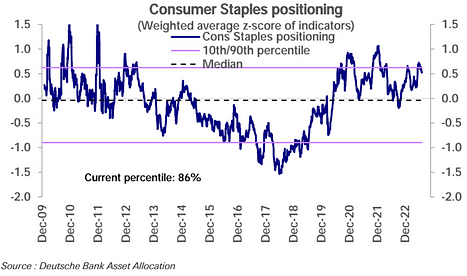
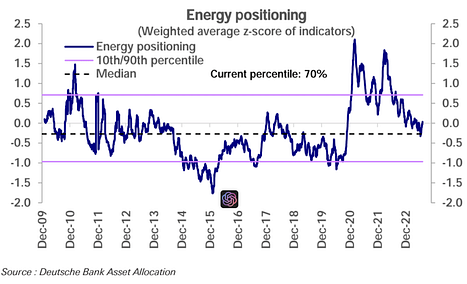
In terms of industries, positions in technology, communication services, and non-durable consumer goods have slightly declined this week, but they are still at historically high levels. Positions in consumer goods have increased significantly this week and are now close to peak levels. Industrial positions are also rising and have entered the overallocated range. Energy positions have gradually risen to a neutral level.
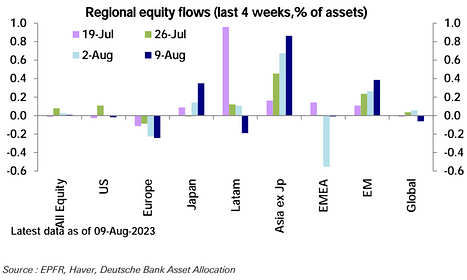
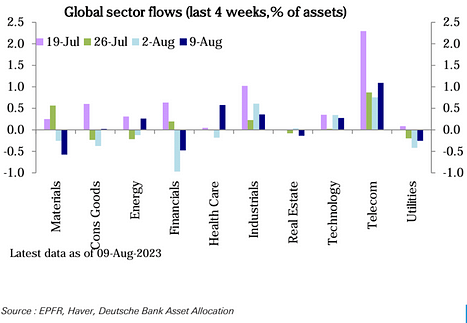
From a fund perspective, fund inflows continue to slow down. Emerging markets and Japan attract strong inflows, but the United States, Europe, and global funds experience outflows. In terms of industries, technology and healthcare attract large-scale inflows. Energy, telecommunications, and industrial sectors also experience small-scale inflows, while finance, real estate, and commodities see noticeable redemptions.
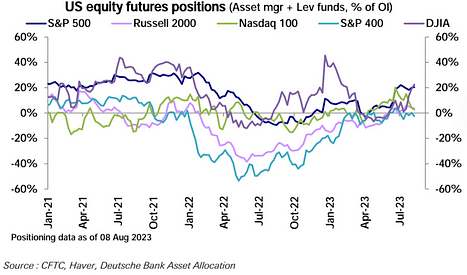
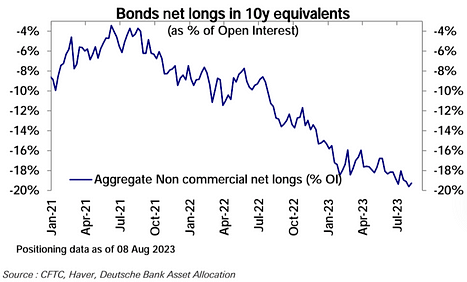
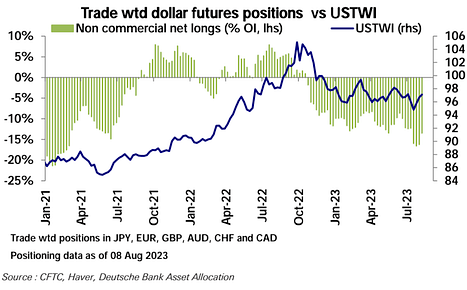
From the perspective of futures positions, net long positions in stock index futures have continued to increase for two consecutive weeks, mainly due to the increase in net long positions in the S&P 500 exceeding the decrease in the Nasdaq 100 and Russell 2000. Net long positions in emerging markets have also decreased. In terms of bonds, overall net short positions have been reduced, mainly due to the decrease in net short positions in the 5-year period. In terms of forex futures, net short positions in the US dollar continue to decrease, mainly due to the reduction in net long positions in the euro and pound.
Investor Sentiment
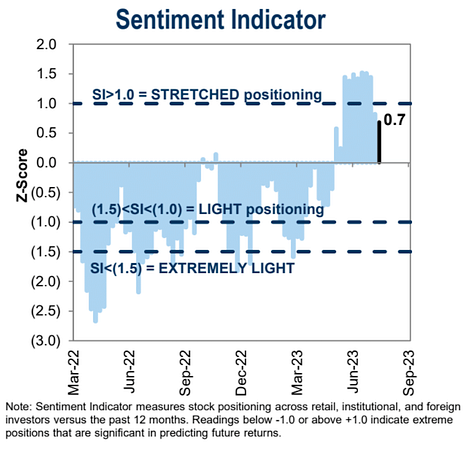
Goldman Sachs’ investor sentiment data continues to decline from 0.8 to 0.7:
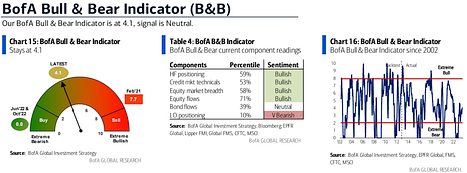
Bank of America’s Bull/Bear Indicator remains the same as the previous week:
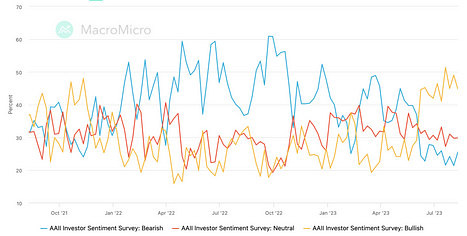
AAII Investor Survey
Bearish: 21.32 to 25.50
Neutral: 29.70 to 29.80
Bullish: 48.98 to 44.70
Cryptocurrency Market
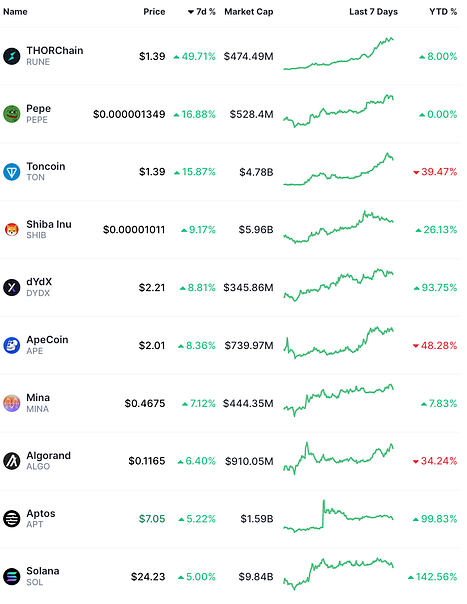
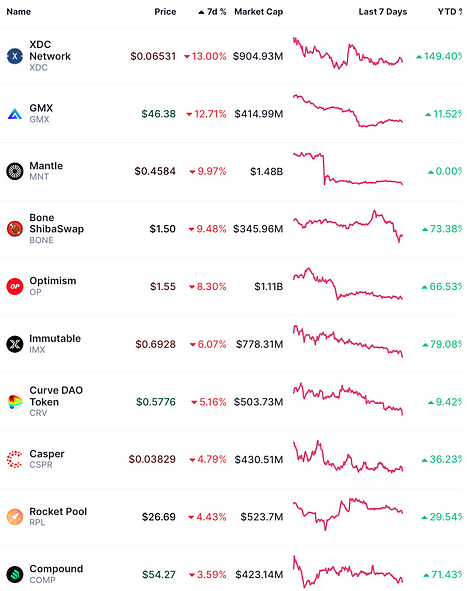
Top 100 cryptocurrencies by market capitalization in the past week: RUNE price increased by nearly 50%, reaching the highest level since April. This may be due to the release of a new swap about a week ago. As far as I know, Thorchain is the only on-chain tool that allows users to exchange native BTC and native ETH. It is also worth noting that TON, the Telegram encrypted bot, has been performing strongly in the market. According to a new report from Binance Research, the daily cryptocurrency trading volume of Telegram bots in July reached a historical high of $10 million:
Top 100 cryptocurrencies by market capitalization in the past week:
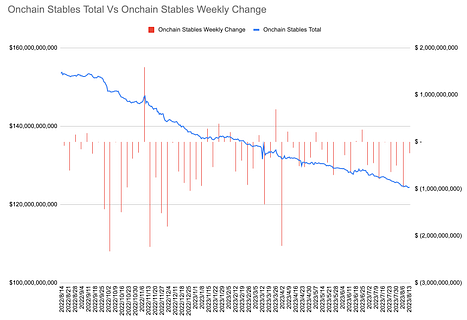
On-chain stablecoins (excluding the DAI newly added to the DS Finance by MakerDAO, which increased by $1 billion in a week) have experienced a net outflow for the eighth consecutive week (-$246 million), a significant narrowing compared to the previous week’s -$973 million:
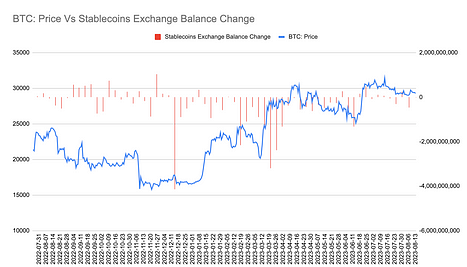
Net outflows of stablecoins in exchanges in the second week (-12 million USD) narrowed significantly from the previous week’s -476 million USD:
Market Comments Excerpt
Wudaokou Macro Notes: “Why are we so eager for AI and room temperature superconductors? It is essentially a race between the innovation cycle and the debt cycle.”
In the past two years, the world’s desire for technological breakthroughs has reached a frenzy, such as metaverse, artificial intelligence, and so on. The fundamental reason behind this is that the current computer/internet innovation cycle is nearing its end and there is an urgent need to start a new innovation cycle, while facing a critical moment of the debt cycle crisis.
The current computer/internet innovation cycle is nearing its end, with the global debt-to-GDP ratio exceeding 335%, and the global market is desperately looking for the germination of the next innovation cycle. The next decade may be the most crucial moment.
A new innovation cycle can bring excess profit rate for companies, high income growth rate for residents, and high investment return rate for investors. The debt cycle is actually a game between profit rate, income growth rate, investment return rate, and borrowing cost. Therefore, in the early and middle stages of the innovation cycle, each sector can obtain excess return rates that are higher than the borrowing cost. In this way, the debt cycle can expand in a benign manner and promote the accelerated outbreak of the innovation cycle. However, in the later stage of the innovation cycle, as the production and demand of the whole cake no longer expand, the investment return rate gradually decreases, the marginal benefit of capital decreases, and the income expectation gradually decreases. With the continuous growth of debt, capital will generate asset bubbles and exacerbate the wealth gap, leading to a debt crisis.
【”Bond King” believes that US bonds have not yet adjusted】
Bill Gross, co-founder of Pimco, said that it is a mistake to be bullish on US stocks and US bonds now, as both markets are “overvalued.” He believes that the fair value of the 10-year Treasury yield is about 4.5%, while the current level is about 4.16%. Bill Gross believes that US inflation may continue to stick around 3%. He pointed out that historically, the 10-year US Treasury yield has been about 135 basis points higher than the Fed’s policy rate. Therefore, even if the Fed lowers interest rates to around 3%, the current 10-year US Treasury yield is still too low from a historical perspective.
Like what you're reading? Subscribe to our top stories.
We will continue to update Gambling Chain; if you have any questions or suggestions, please contact us!
