2 x 2 = 5
Obviously, this is the wrong math problem. When I saw that the liquidity and TVL (total value locked) data displayed on the Uniswap V3 UI were completely wrong, I felt the same as seeing 2 x 2 = 5.
Uniswap is the largest decentralized finance (DeFi) project on Ethereum and the entire blockchain industry. Since thousands of liquidity providers are using Uniswap numbers to build their investment strategies every day, how could these numbers be inaccurate?
I’ve tried to figure out what’s wrong with my calculations, but have been fruitless for hours, and the reality is worse than the TVL being inaccurate.
problem found
First, understand what TVL is and how to use TVL?
TVL is the total value of all crypto assets entrusted to a blockchain or protocol, usually denominated in U.S. dollars. These assets could be the total liquidity of decentralized exchanges, cross-bridges, lending protocols, or the total collateralized assets of PoS.
TVL is widely used by crypto investors, mainly in the following scenarios:
1. Judging protocols, popular protocols generally show their TVL, because larger TVL means greater user trust, lower risk, and more stable profits.
2. Screening protocols, crypto traders generally choose DeFi tools with higher TVL, such as decentralized exchanges or cross-chain bridges.
3. The monitoring protocol, the protocol that TVL data can grow rapidly, is a better and better signal for development.
TVL is so important, but I actually found some errors in the data of the largest DeFi protocol Uniswap v3 TVL. But for me, the biggest discovery is that the official Uniswap chart also has some problems. Here is the whole process of finding this problem:
As an example of a liquidity analysis project, first compare the official Uniswap v3 data with my calculations using raw blockchain data. This step is critical for data quality standards, and to improve validation accuracy, I chose a popular liquidity pool USDC-WETH (0.3% fee level).
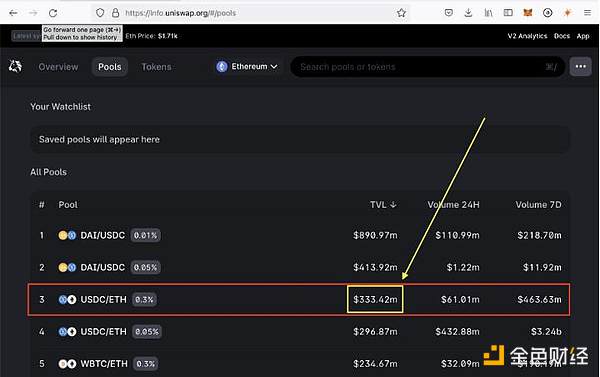 The TVL of the third pool on Uniswap v3 is a whopping $333 million (based on the official Uniswap chart at the time of writing), with a daily trading volume of $61 million.
But what I calculated was $176 million, which was inconsistent with the official Uniswap v3 data, so I decided to go to ETH’s block explorer for further verification. In theory, each Uniswap v3 pool is a smart contract. Therefore, the blockchain explorer can display the balance of tokens owned by the pool, which is the TVL of this pool.
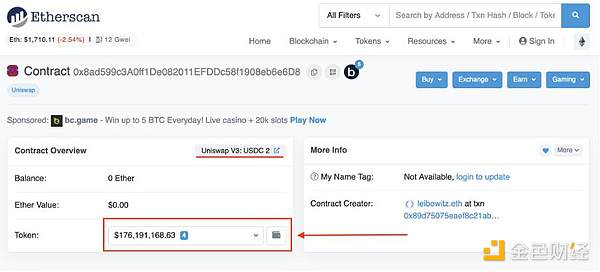
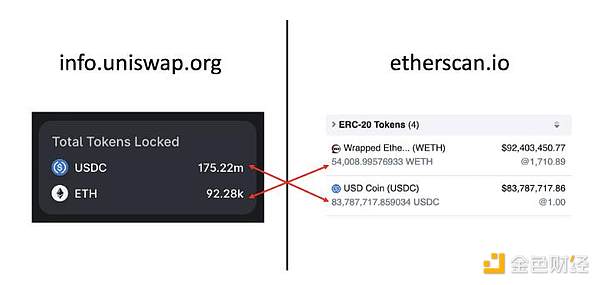
I expect the token balance in the block explorer pool to be a bit larger than the official Uniswap figures, since the pool also includes liquidity and unclaimed fees. But this balance is almost half of the official Uniswap data, and the most surprising thing is that it is the same as my calculation!
I checked the liquidity of other assets one by one, and a similar situation occurred. At this time, I realized that this problem and should not be my calculation problem.
 Why does this happen? After research, I found out that Uniswap relies on The Graph, a decentralized blockchain indexing service. Using this service, any developer can add personal analytics code (called subgraphs) for a specific blockchain data use case and provide analytics via an API. So Uniswap Labs created its own subgraph for Uniswap protocol analysis, and provided it to the service through The Graph to form related data. The good side is that The Graph’s code is public, the bad side is that its TVL is miscalculated.
I did a brief analysis of the code in it and found that it takes into account all exchange and liquidity events, but not fees. The Uniswap mining pool charges a fee of 0.01% to 1% per swap. This fee is deducted from the trading asset and credited to the liquidity provider. In turn, liquidity providers can charge accrued fees at any time. However, the current Uniswap v3 subgraph shows numbers that never seem to accrue and charge anything. As a result, Uniswap v3 TVL data deviates from reality every time it is swapped.
My first reaction was to submit a ticket to The Graph for feedback. But I found on Github that this issue has been raised by core developers in November 2021. I don’t know why The Graph has not solved this problem, but as time accumulates, the TVL will be more and more different from the actual data. For a large pool such as the current USDC-ETH, the current TVL is almost half of the real data.
verification problem
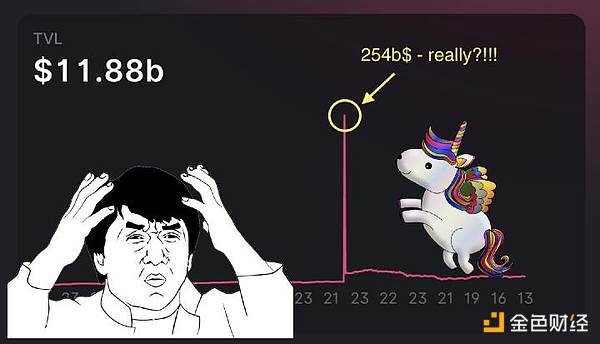
How does an unreal TVL affect our investment decisions? Before we start, let’s take a look at how these biases affect the total TVL of Uniswap v3. At the time of writing, Uniswap v3 is officially listed at $12 billion.
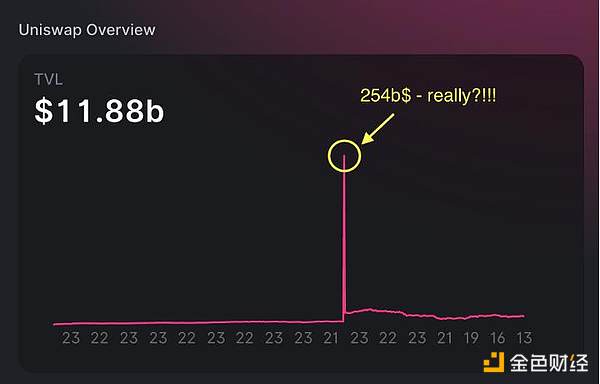
As can be seen from the data reported by the official figures above, TVL steadily increased from $500 million to $4.5 billion on March 6, 2022. But something crazy happened, on March 7, 2022, TVL was reported to be $254 billion. This is 2.5 times more than the highest TVL ever recorded by the entire Ethereum network, and such a change in one day. Obviously, this data is wrong. Over the next few weeks, TVL was officially reported at $10-20 billion.
At this point, I lost all trust in Uniswap’s analytical data, but how can I know the real TVL?
There are two options:
Option 1 — Fork and fix the Uniswap v3 subgraph. The downside of this option is that subgraph reindexing takes days, and I don’t like the GraphQL language used by The Graph.
Option 2 – Use Datamint’s high-performance analytics database, which works with all Uniswap v3 and Ethereum data, ready for complex online queries.
After some experimentation, I have created the following algorithm for accurate TVL calculation, below is the step-by-step procedure.
1. First follow the following two steps to calculate the TVL of all existing Uniswap v3.
2. Add all ERC-20 token transfers to the pool contract (including all unclaimed fees) and match Etherscan’s token balance.
3. Add all liquidity events, incoming and outgoing, then add all exchange transactions to calculate fees.
4. Compare the two methods and make sure there are no unexplained differences.
5. Abandoned and empty pools with less than 50 swaps or 0.00000000000001 tokens (7,863 pools detected, including 2,083 stable pool pairs, my algorithm removed 112 empty and abandoned pools).
6. Find a stablecoin path for each token, convert the TVL in the pool to USD.
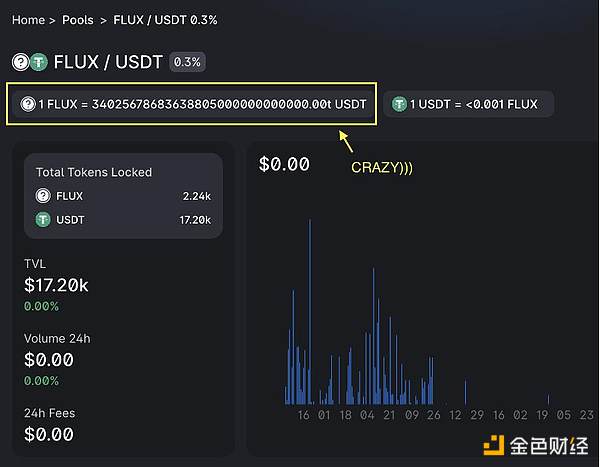
7. Remove illiquid pools with compromised USD value, as some pools may show insufficient value after complete removal of liquidity (see image below for an example).
8. Convert TVL to USD for all remaining currency pairs and add.
 The calculation process is very fast, and I finished it while drinking coffee. Below is the final calculation result.
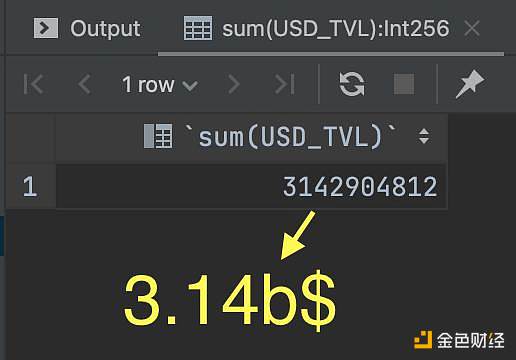 As you can see from the calculations in the graph above, this is almost 4x less than the reported TVL of $11.8 billion.
Disclaimer: My calculations may have errors, we use other tools such as automated testing to achieve high data quality when targeting enterprise customers. But for personal projects, these tools are not suitable. In addition, this study mainly presents the problem of existing data, but not the final data.
fix the problem
Bad data can lead investors to make some bad decisions, and we think it’s actually not that hard to fix Uniswap’s TVL. Uniswap Labs can choose to fix in the subgraph code, or calculator developers start using other data sources. But we were sceptical about the accuracy of the calculator’s predicted data, I did some brief calculations to verify my point, and as I had guessed, I found no data that came close.
This is a very bold guess, and I know that many liquidity providers rely on existing calculators to make investment decisions of tens of thousands of dollars. However, in order to facilitate your further judgment, we have restored the following calculation process:
First, let’s review some core concepts of the Uniswap v3 protocol.
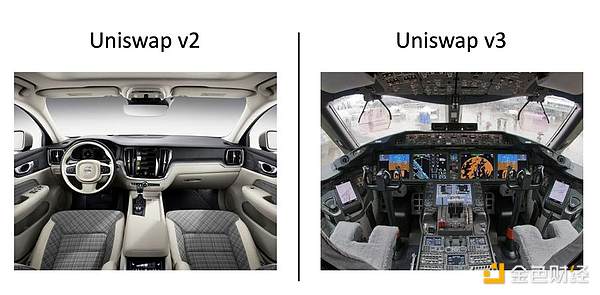
One of its main innovations is centralized liquidity. Essentially, with Uniswap v3, you can choose the price range you want your funds to use as a liquidity provider. This is an amazing concept that can bring enormous value to protocol users. Liquidity providers limit their scope for impermanent losses, and traders can enjoy less price slippage when volatility is low. But all these potential benefits come at a price, and that is complexity.
 In Uniswap v3, liquidity providers choose the price range in which to provide liquidity. Once the price is within this range, he will receive a share of the exchange fee. Liquidity providers want the widest possible price range for their liquidity positions. However, liquidity is prorated within this range. Therefore, the wider the range, the lower the exchange fee per transaction.
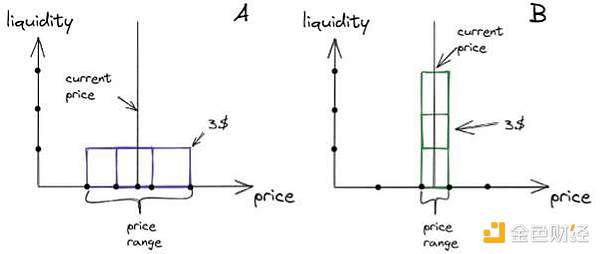
In this example, option A shows the liquidity provider choosing a wider price range, while option B shows a narrower price range for the same amount. Assuming that in both cases the price is within the chosen price range, the liquidity provider gets 3x more fees in option B. However, if the price is more volatile, the liquidity provider may end up with a higher profit in option A.
So, in fact, choosing the right price range should find the best balance between the risk of missing the price and getting a lower reward per trade.
In addition, there is an often overlooked parameter that also affects liquidity providers’ profits. That’s the LP Profit Calculator, and this parameter can change everything. If you want to know the specific calculation logic of LP, you can refer to the following example:
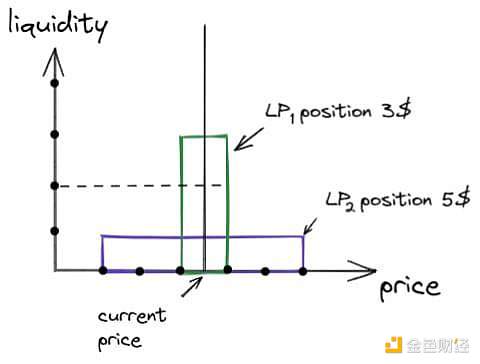
In this example, two liquidity providers (LP1 and LP2) have positions. LP1’s position is narrowly $3. LP2 has a wide position of $5. In this case, if the price does not exceed the position range of LP1, he will get 3 times more fees than LP2. Because LP2 has only $1 in this range, and that $1 is competing with LP1’s $3.
If you look at the liquidity distribution of any Uniswap v3 pool, you will see that it is not uniform.
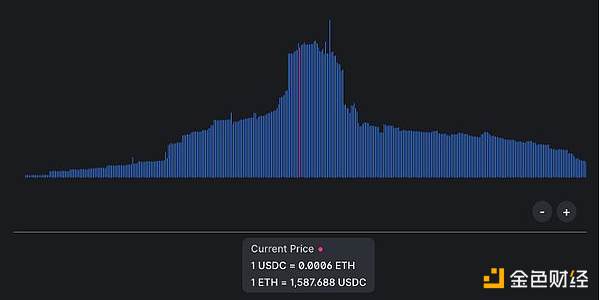
The higher the threshold, the higher the competition, and liquidity providers need to find a balance between choosing a competitive range and a range with a lower probability of price declines. That’s why this distribution plays an important role in LP profit forecasting and strategy formulation, but I’m not sure if this distribution is calculated correctly.
Liquidity
Liquidity providers are all about guessing prices, competition status, and trading volumes, and if LPs have a desire to know the future of trading in advance to adjust liquidity positions, this is achievable.
During my research, some unusual liquidity providers came to my attention. They add and remove large liquidity positions (over $10 million) multiple times a day. Even more surprising is that they always add and remove liquidity in the same block.
We can see the following example:
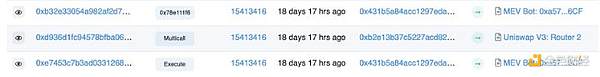
We have three transactions, all at block 15413416, positions 3-5, executed in bottom-up order. The first transaction to use the Execute method was a contract called “MEV Bot” that added $22 million in liquidity to the USDC-WETH pool.
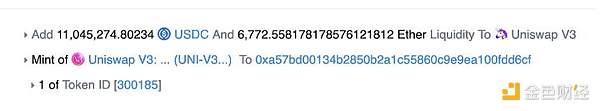
MEV Bot increases liquidity
The second transaction was an exchange from USDC to DogeChain via WETH, a common exchange transaction worth about $16,500.
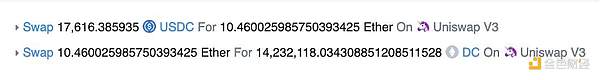
Standard exchange transaction
The third transaction was again “MEV Bot”, which removed $22 million in liquidity from the USDC-WETH pool.
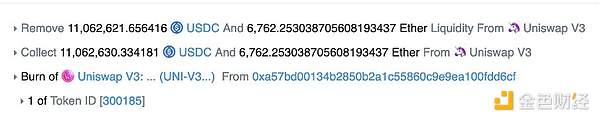
MEV Bot Eliminates Liquidity
What’s happening in the example is called “liquidity sniping”, let me explain how this works:
1. Someone sent a transaction to exchange USDC to DogeChain;
2. The MEV Bot detected this transaction in the mempool and activated the private link with the mining pool using Flashbots technology or similar technology;
3. The MEV Bot pays the miner one exchange transaction and two transactions in a specific order to allow the extraction of value;
4. The MEV Bot adds so much liquidity ($22 million) in a very narrow price range, so effectively, all fee profits from a particular USDC-DogeChain transaction accrue to him;
5. MEV Bot removes liquidity and earns fees (~$35).
Therefore, his gross profit after gas fees is about $30. Maybe it’s not a lot of money, but he executes this strategy multiple times per minute, all of which add up to a significant amount. You can also check the process yourself through a block explorer.
What does this mean to you as a liquidity provider? This means that liquidity snipers can slash your fee profits.
in conclusion
I believe that Uniswap is a great project with huge potential, and I respect the idea of centralized liquidity at the core of Uniswap v3. However, I find that the analytical part of the Uniswap ecosystem is far from mature, and I believe this will change soon! Finally, to summarize my findings:
1. The TVL data in the Uniswap v3 graph is very inaccurate, and all analysis tools that rely on the official Uniswap v3 subgraph have the same bug.
2. Uniswap v3 TVL totaled $3.14 billion, compared to $11.8 billion reported by the official website (data as of this writing).
3. The calculators of Uniswap v3 liquidity providers have little value for real life strategies as they do not take into account competition and liquidity snipers.
Fortunately, you now have a better understanding of how Uniswap v3 liquidity pools work in real life and can adjust your research accordingly.
While I can’t offer investment advice, I think there are only 2 options for building a strategy that highlights liquidity:
- Simple version, using historical performance data. Try some small liquidity positions to see which options work better, but this only works under the assumption that the market is stable.
- Advanced, conduct research and optimize LP strategies accordingly. As mentioned above, this requires a deep understanding of the Uniswap v3 protocol, mathematics and gaming, and powerful data analysis tools that process large amounts of data in real-time.
One thing these two options have in common is that your decisions are based on data rather than intuition or random tools, and sometimes working with data is difficult, but it pays off.
Like what you're reading? Subscribe to our top stories.
We will continue to update Gambling Chain; if you have any questions or suggestions, please contact us!
