More than 140 million new addresses, and the average proportion of profitable chips is 60.50%
In 2022, affected by the Federal Reserve’s continuous hawks and the tightening of global liquidity, Bitcoin ended the bull market that had been rising continuously for the past two years, and entered a bear market that fluctuated downwards. In the reversal from rising to falling, the currency price of Bitcoin fell below the integer mark of 20,000 US dollars, and the successive thunderstorms of leading exchanges and DeFi protocols severely damaged market confidence. In addition to these appearances, what profound changes will happen to Bitcoin in 2022?
The currency price fell by 65.09%, and the exchange stock decreased by 20.20%
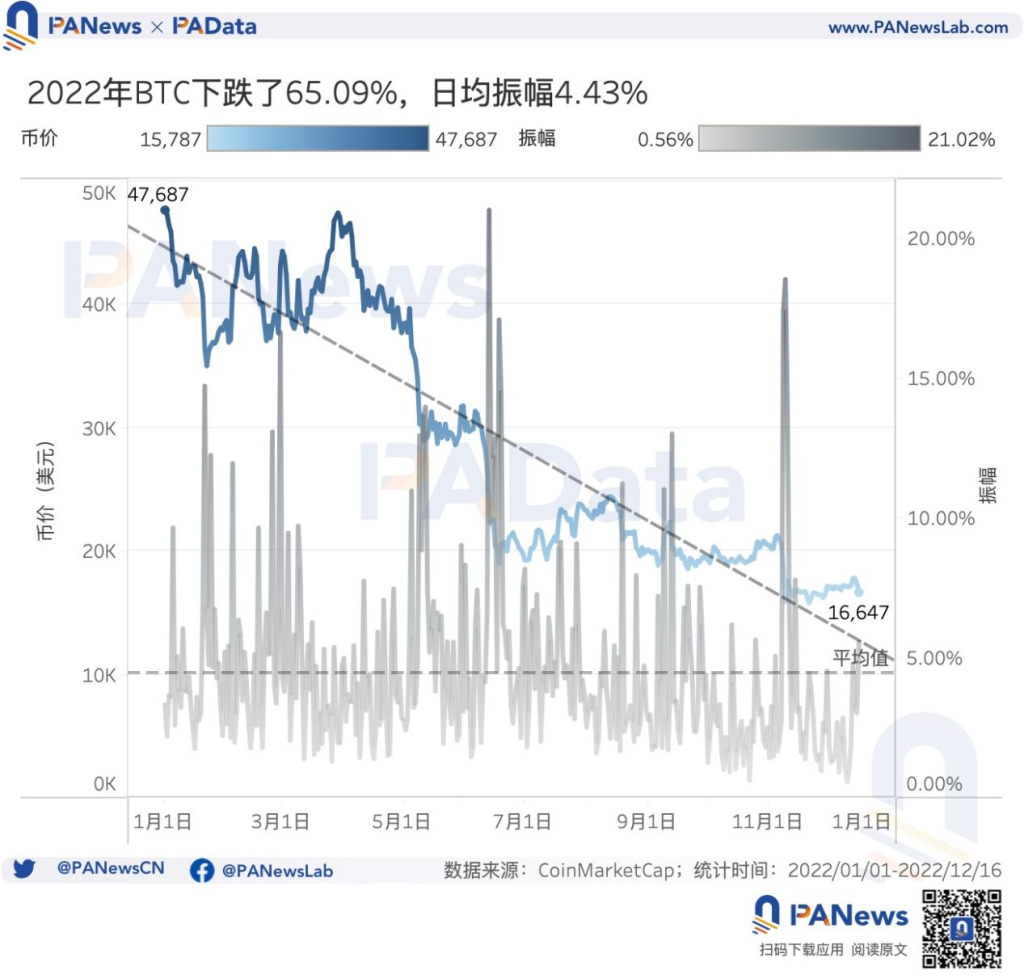
In 2022, the price changes of BTC show two characteristics. One is the overall decline during the year. The price of BTC dropped from about US$47,700 at the beginning of the year to about US$16,600 at the end of the year (December 16), a drop of about 65.09%. . If the day-to-day drop of more than 10% in the closing price is understood as a “slump”, then BTC experienced a total of 6 plunges throughout the year, of which 2 occurred in a single month in November.
The second is the rapid decline, forming a “step-like” decline pattern. Although the maximum daily fluctuation of BTC throughout the year is only about 4.43%, almost every “slump” is accompanied by an ultra-high intraday fluctuation of more than 10%. In other words, BTC’s sharp declines are usually completed within a day, and then fall again after a short period of stability.
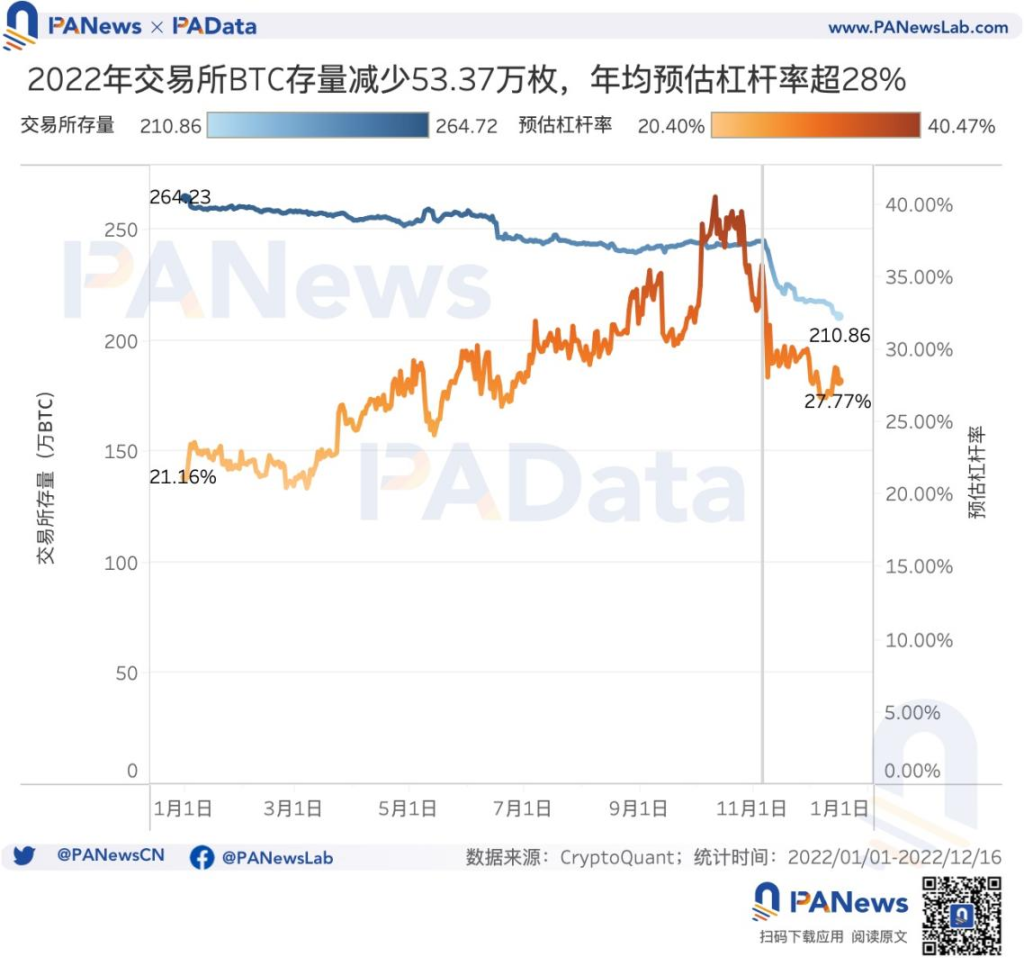
In 2022, the stock of BTC on exchanges will drop from 2,642,300 to 2,108,600, a decrease of 533,700, or about 20.20%. Among them, taking the FTX incident as the boundary, before, the stock of BTC on the exchange was stable with a decline; after that, the stock of BTC on the exchange declined rapidly. During the 11 days from November 6th to 17th, there was a total decrease of about 240,000 BTC, a drop of about 9.80%. And after the event basically subsided, the stock of BTC on the exchange still dropped significantly.
Changes in currency prices and exchange stocks affect the trend of the expected leverage ratio in the BTC market. Generally speaking, the estimated leverage ratio in the market first continued to increase during the year, and then fell rapidly. The highest leverage ratio in the year was created on October 11. 40.47%, but about a month later, on November 8, the leverage ratio fell back to 28.05%. Since then, the leverage ratio has never exceeded 30%
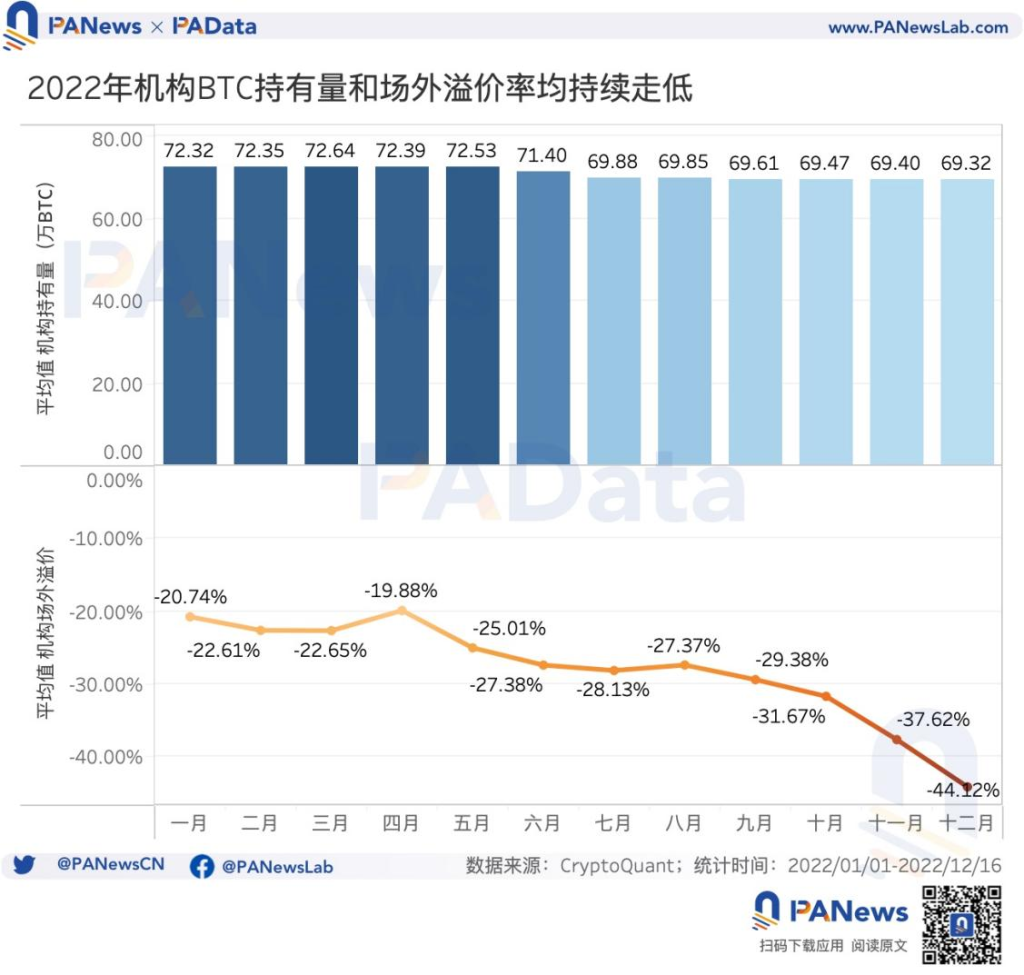
In addition, from the perspective of indirect investment, the average daily BTC holdings of institutions such as trusts, ETFs, and funds in 2022 will be about 700,000 BTC. However, the annual holdings of institutions still declined moderately, with an overall decrease of 32,900 BTC, or about 4.54%, and the demand for indirect investment continued to decrease. Moreover, affected by the sharp drop in currency prices, the OTC premium rate of institutional assets has also continued to decline. The monthly average off-market premium rate dropped from -20.74% in January to -44.12% in December, and the premium rate fell as high as 112.73%.
The monthly average cumulative active addresses are 27.82 million, and the cumulative transaction volume is 1.256 billion BTC
Behind the market fluctuations are changes in the data on the Bitcoin chain. According to statistics, the cumulative monthly active addresses of Bitcoin in the first 11 months of 2022 are approximately 27.82 million, a decrease of 7.67% from the average monthly active addresses of last year. The average daily active address of Bitcoin in the first 11 months of 2022 is about 916,500, a decrease of 7.70% from the average daily active address last year.
In 2022, not only will the scale of active Bitcoin addresses decrease, but the number of new addresses will also decrease. According to statistics, as of December 15, the cumulative number of new Bitcoin addresses this year reached 141 million, a decrease of 9.50% from the same period last year. In addition, the average monthly increase in the first 11 months was 12.274 million, a decrease of 9.83% compared with the same period last year. The number of new addresses here includes the impact of the UTXO change mechanism.
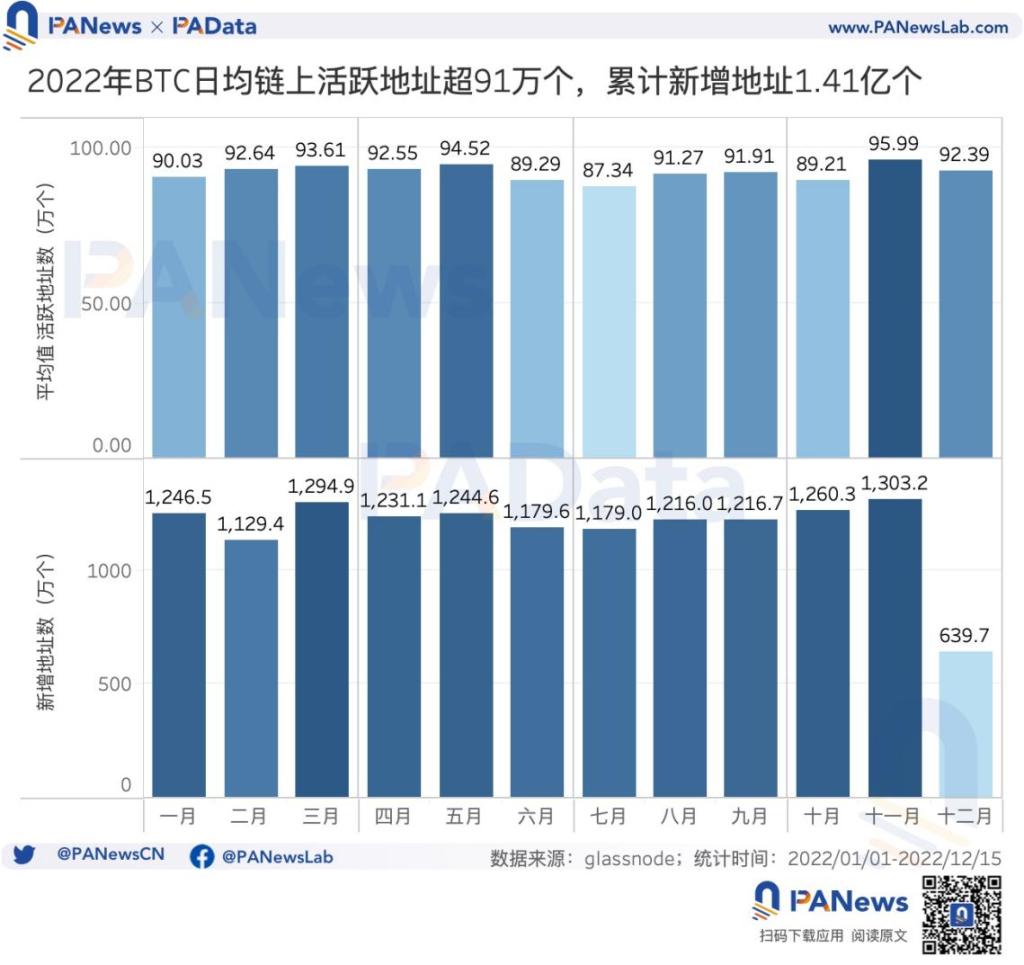
Generally speaking, there are two major characteristics of the change of addresses on the Bitcoin chain in 2022. First, the number of users on the Bitcoin chain this year has dropped significantly compared with last year. Second, despite the large market volatility during the year, the number of users on the Bitcoin chain has remained relatively stable.
In addition to address changes on the chain, transactions on the chain are also an important part of the fundamentals on the chain. According to statistics, as of December 15, the cumulative number of bitcoin transactions in 2022 will be 88.99 million, a decrease of 4.13% from last year. In the first 11 months, the cumulative number of transactions per month was 7.733 million times, of which the number of transactions in May was the highest, exceeding 8.05 million times.
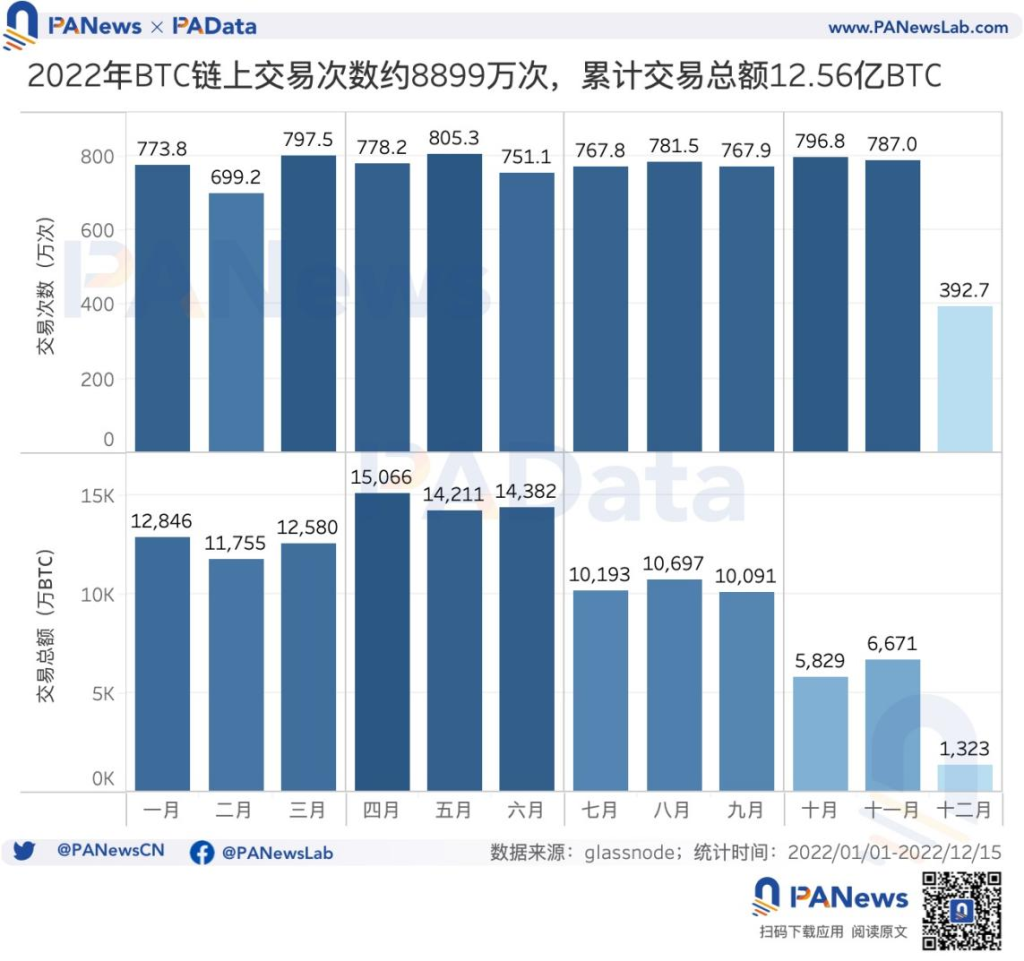
However, despite the decrease in the number of transactions, the total number of Bitcoin on-chain transactions in 2022 will increase significantly. As of December 15, the cumulative total transaction volume of Bitcoin in 2022 will be approximately 1.256 billion BTC, a substantial increase of 36.37% over last year. If you look at a smaller time period, you can see that the average monthly transaction volume in the first half of the year was 135 million BTC, significantly higher than the 86.96 million BTC in the second half of the year (excluding December). Affected by the sharp drop in the market in the second half of the year, the activity of funds on the chain has also dropped significantly.
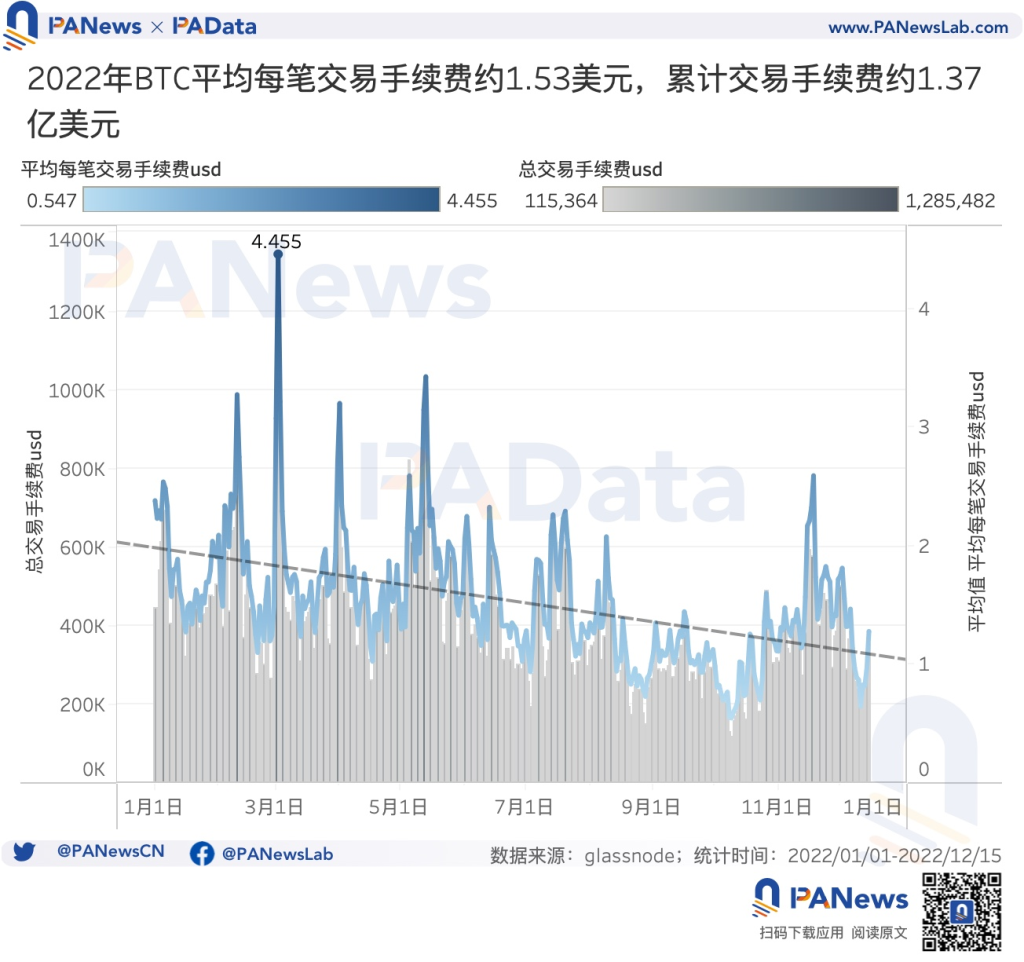
The decline in transaction activity on the chain has also brought about a decline in transaction fees. Converted according to the daily closing price of Bitcoin, the average daily transaction fee for each transaction on the Bitcoin chain in 2022 will be about 1.53 US dollars, and it will show a clear downward trend during the year. Among them, the average daily transaction fee per transaction on the chain in the second half of the year is about $1.26, which is much lower than the average in the first half of the year.
As of December 15, the cumulative on-chain transaction fees of Bitcoin in 2022 will be about 137 million US dollars, which also shows a clear downward trend. The average monthly cumulative transaction fee in the first 11 months was US$12.0406 million. Among them, the cumulative transaction fee in May was the highest at US$16.1719 million, and the cumulative transaction fee in October was the lowest at approximately US$7.4758 million.
The proportion of the average profitable chips continued to decline, and the proportion of the number of chips in the 1-2 year currency holding cycle increased the most
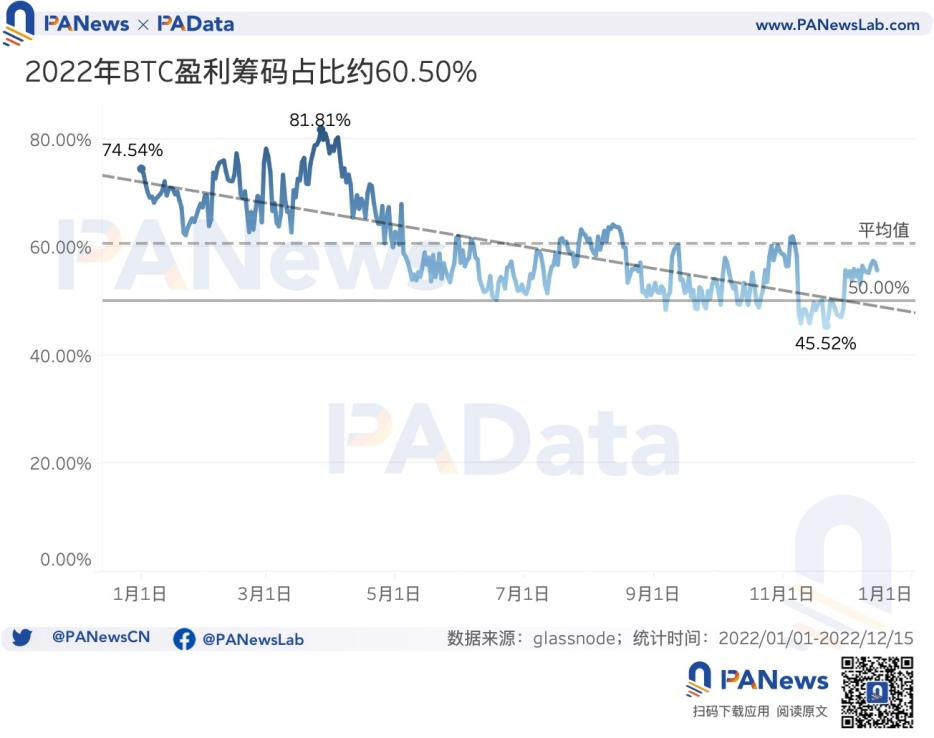
The violent market fluctuations in 2022 have caused changes in the bargaining chip structure. First of all, from the perspective of the distribution of profit chips, the average proportion of Bitcoin profit chips in 2022 is 60.50%, which means that 40% of the chips are in a loss state every day throughout the year. Moreover, the proportion of profitable chips showed a clear downward trend throughout the year, from 74.54% at the beginning of the year to 55.77% at the end of the year, a decrease of more than 18 percentage points. Especially during the period from November 8th to November 29th after the FTX incident, the proportion of Bitcoin’s profit chips was almost always lower than 50%, that is, more than half of the tokens were in a loss state at that time.
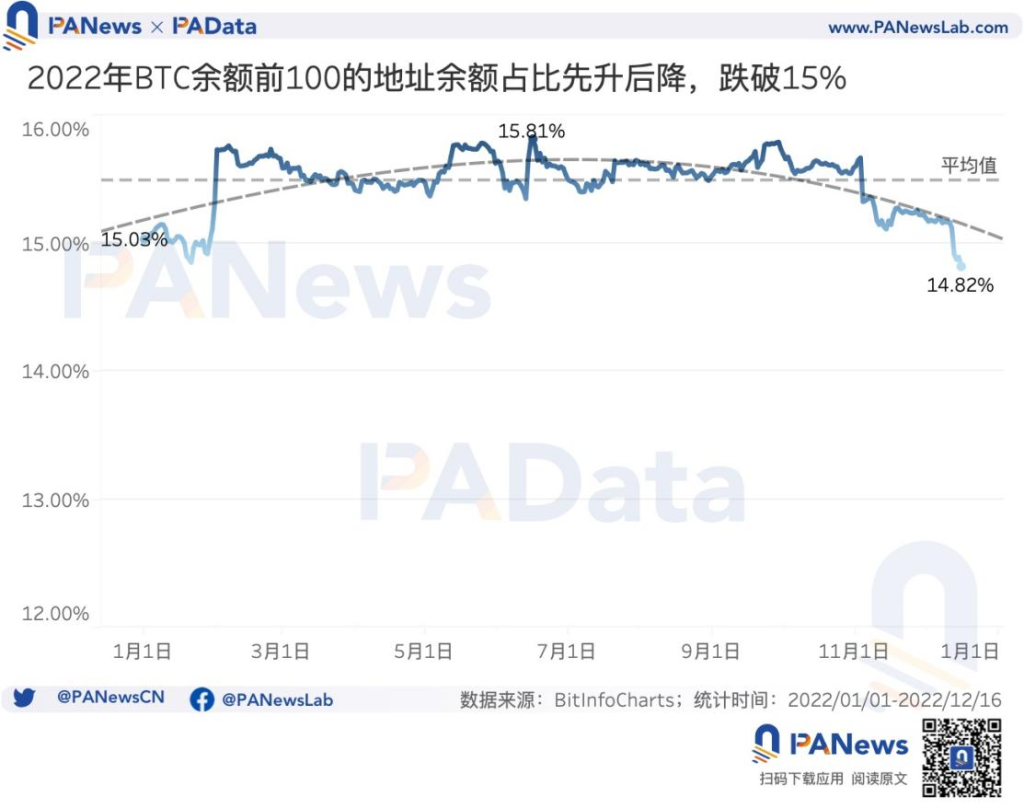
In addition, the concentration of Bitcoin chips also experienced a process of first concentration and then decentralization during the year. According to statistics, the total balance of the top 100 addresses in circulation rose from 15.03% at the beginning of the year to a peak of 15.81% in mid-June, and then dropped to 14.82% at the end of the year. Although the largest change in this proportion during the year is only 1 percentage point, for Bitcoin, 1% of the circulating supply is about 190,000 BTC. From an absolute number point of view, this change is still worthy of attention.
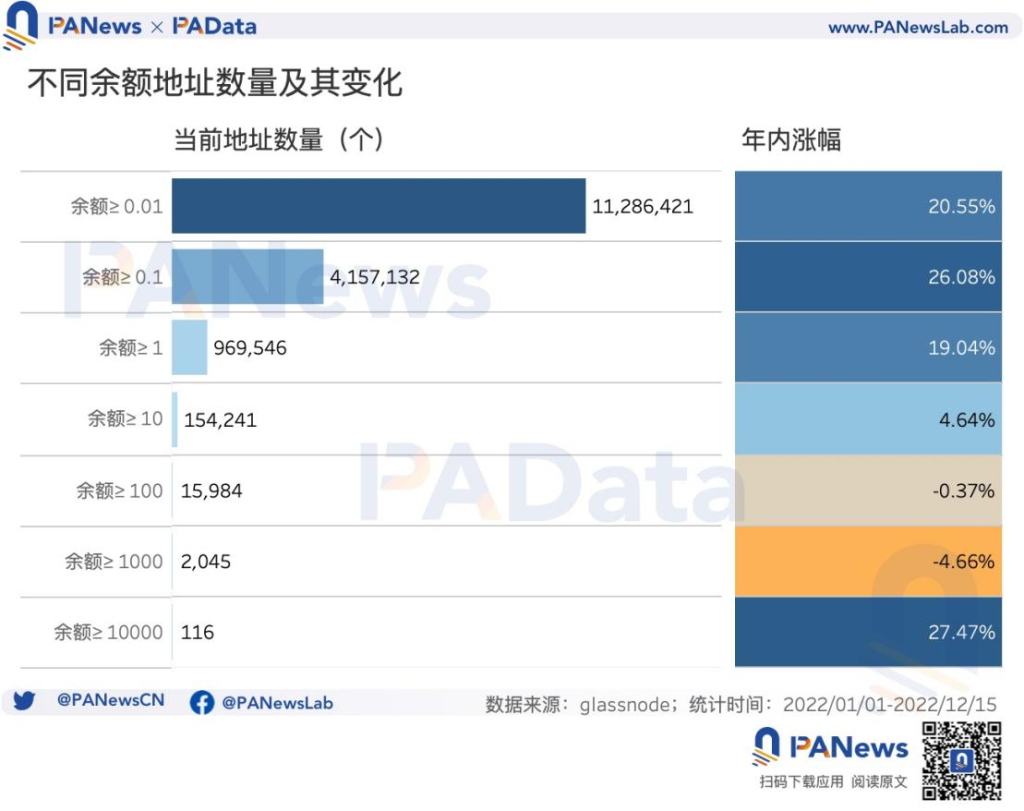
In 2022, the asset movement of Bitcoin holding addresses will continue the two major characteristics of last year. First of all, from the perspective of balance, this year, small-value addresses continued to grow significantly, but the new change compared to last year is that the balance range for which the number of addresses has increased has expanded from below 1 BTC to below 10 BTC, and small-value addresses have increased significantly improve.
Among them, the number of addresses with a balance greater than 0.01 BTC increased by 20.55% during the year, nearly 10 percentage points higher than last year. The number of addresses with a balance greater than 0.1 BTC increased by 26.08% during the year, which was nearly 20 percentage points higher than last year. The number of addresses with a balance greater than 1 BTC increased by 19.04% during the year, and the number of addresses with a balance greater than 10 BTC increased by 4.64% during the year. In addition, the number of addresses with a balance greater than 10,000 also increased by 27.47% during the year. The number of these three types of addresses showed negative growth last year.
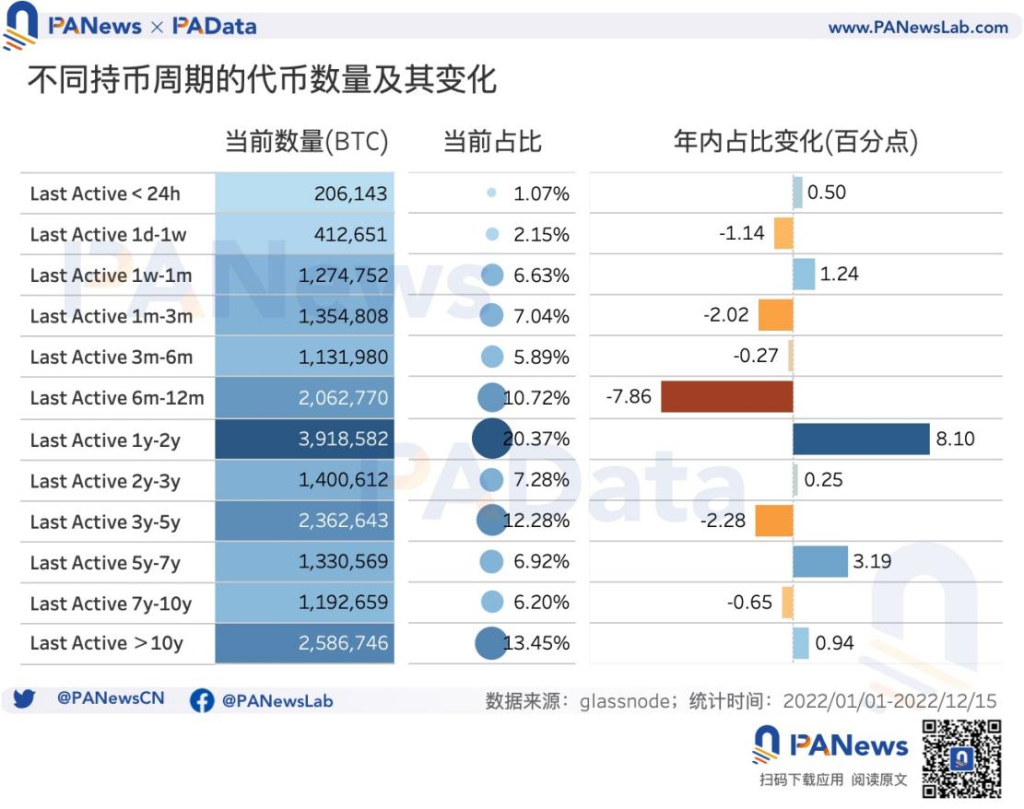
Secondly, from the perspective of the currency holding cycle, this year, the chips of different currency holding cycles continue to differentiate, and the dominant currency holding cycle is 1 to 2 years. As of December 15, there were 3.9186 million BTC holding period of 1 to 2 years, accounting for 20.37%.
But the new changes compared with last year are, first, the currency holding period with the largest increase has changed from 6 months to 1 year to 1 year to 2 years. According to statistics, the proportion of chips with a currency holding cycle of 1 to 2 years increased by more than 8 percentage points during the year, which is basically the same as the change in the proportion of chips from 6 months to 1 year. It is reasonable to speculate that most of the original 6 months to 1 The chips of the previous year were continued to be held, turning to a 1- to 2-year cycle.
Second, short-term and ultra-long-term currency holding addresses have increased. Among them, the proportion of chips with a currency holding period of less than 24 hours increased by 0.5 percentage points during the year, and the proportion of chips with a currency holding period of 1 week to 1 month accounted for 1.5%. An increase of 1.24 percent during the year. In addition, the number of chips with a currency holding period of 5 to 7 years and more than 10 years also increased during the year.
Taken together, this change in the number of addresses and chips shows that the asset distribution of ordinary Bitcoin users this year has shown a trend of accelerating miniaturization and polarizing the length of the currency holding cycle.
The computing power continued to grow throughout the year, and the daily mining revenue per unit computing power dropped by more than 77%
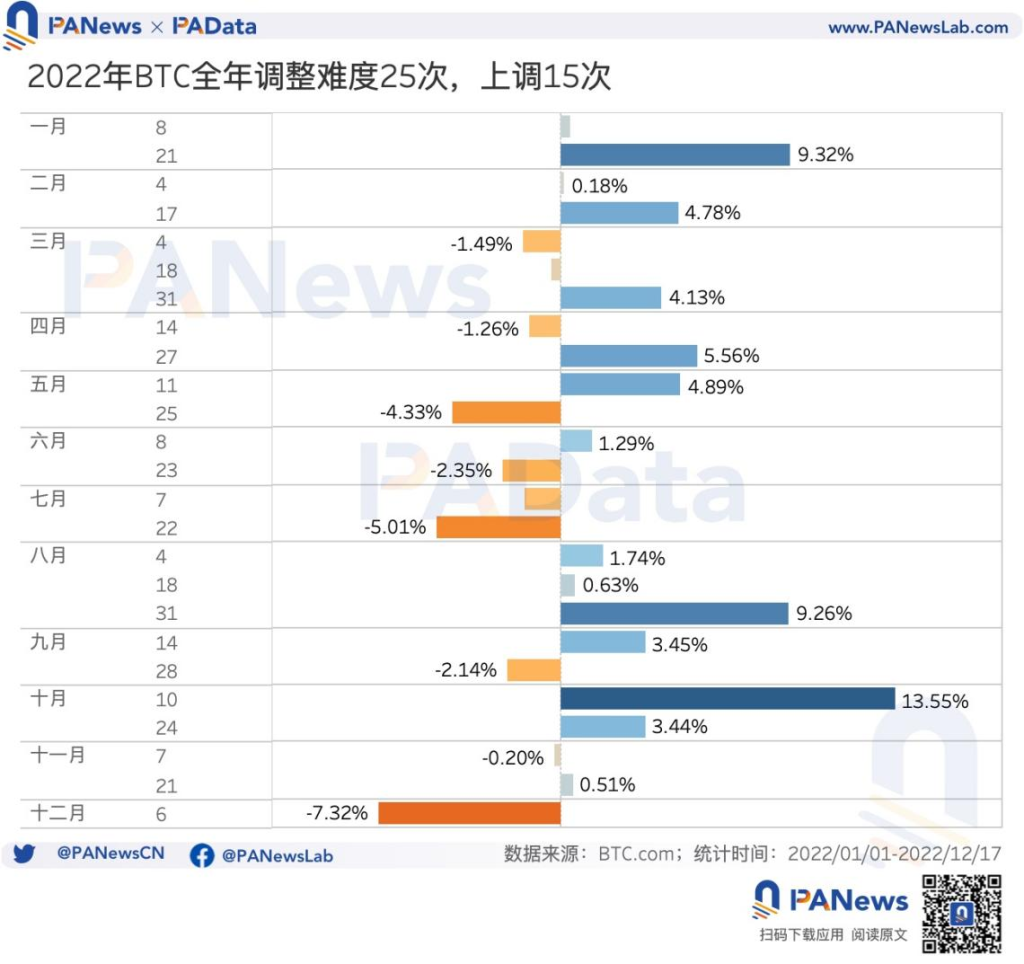
As of December 17, the difficulty of BTC mining has been adjusted 25 times throughout the year, including 15 upward adjustments and 10 downward adjustments. Overall, the upward adjustments are greater than the downward adjustments. Among them, the largest increase occurred on October 10, reaching 13.55%. In addition, the upward adjustments on January 21 and August 31 were also relatively large, both exceeding 9%. On the contrary, December 6 saw the largest reduction, reaching 7.32%. In addition, the reductions on May 25 and July 22 were also relatively large.
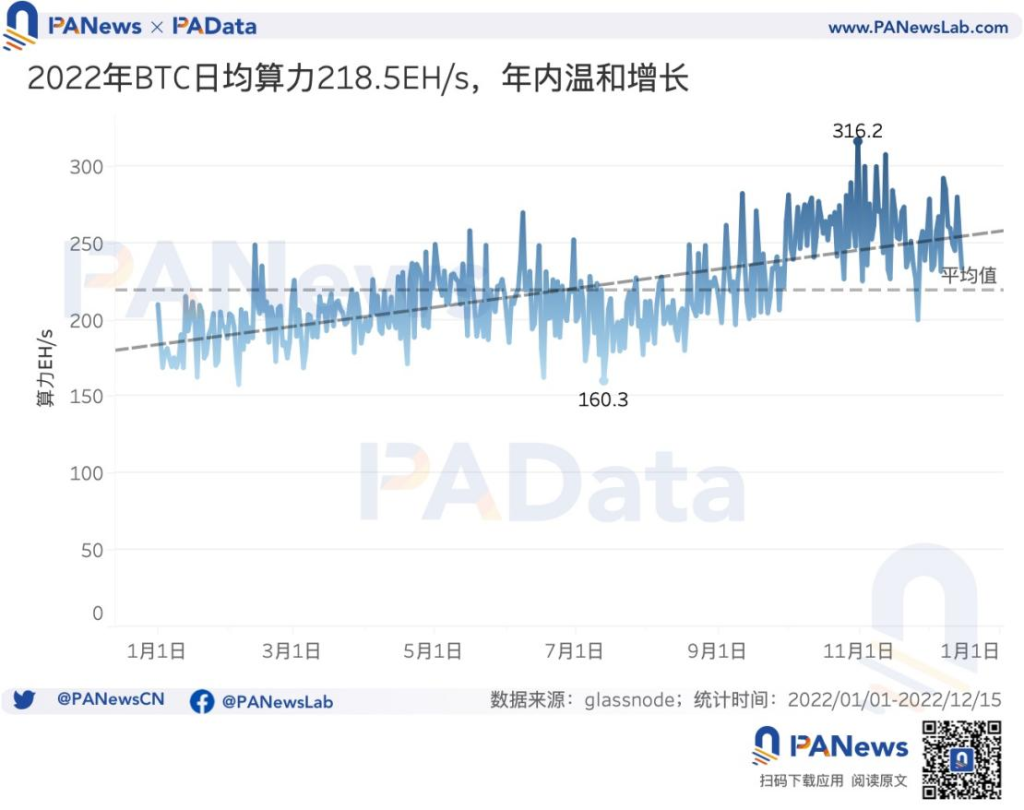
From the perspective of computing power, the average daily computing power of Bitcoin in 2022 is about 218.5 EH/s, with an annual increase of about 11.21%, showing a mild upward trend. The highest computing power in the year is about 316.2 EH/s, and the lowest computing power is about 160.3 EH/s. According to the statistics of DIGICONOMIST, as of December 18, the estimated annual power consumption of Bitcoin mining is about 113.83 TW/h, which is comparable to that of the Netherlands.
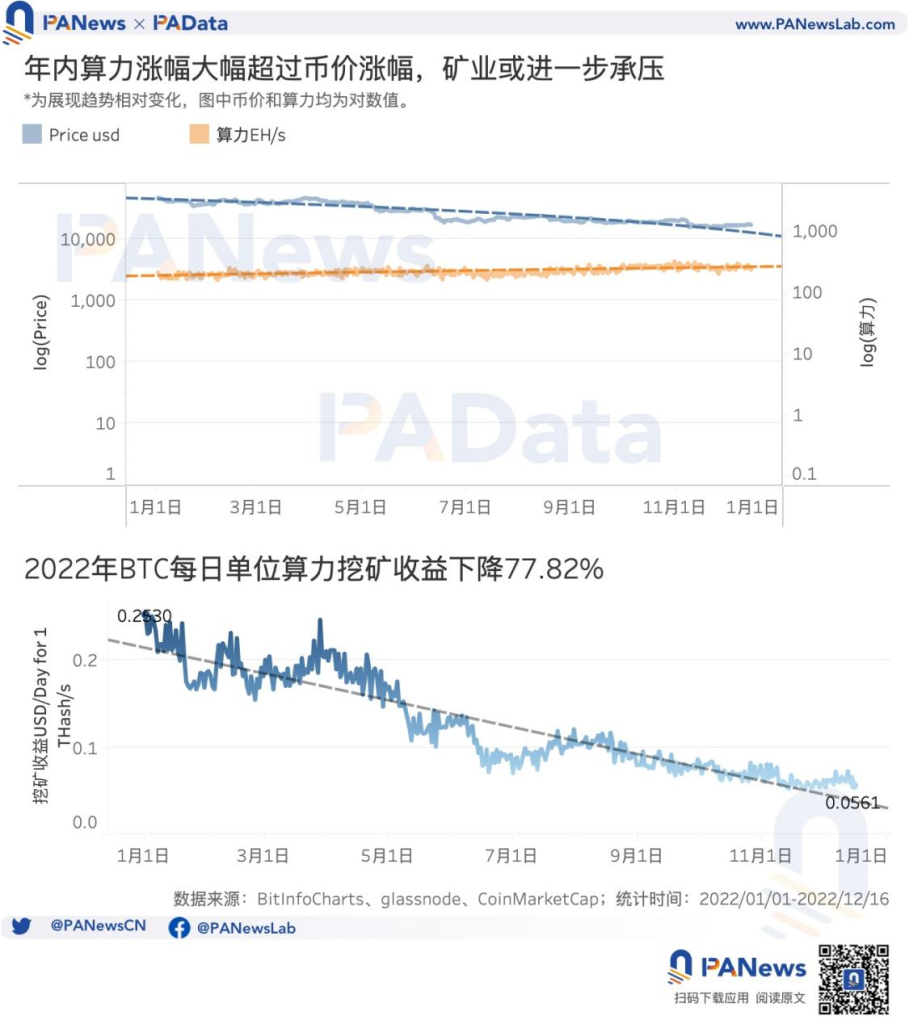
Judging from the relative changes in computing power and currency prices, the two moved in opposite directions during the year, that is, the continuous decline in currency prices and the continuous growth of computing power occurred at the same time, but the decline in currency prices was greater than the growth in computing power. This means that the profitability of the mining industry has been further squeezed, and the decline in currency prices has limited the growth rate of the mining industry. According to statistics, Bitcoin’s daily mining income per T computing power dropped from US$0.25 at the beginning of the year to US$0.06 at the end of the year, a drop of up to 76%. Especially after September, Bitcoin’s daily mining income per T computing power has always been less than $0.1.
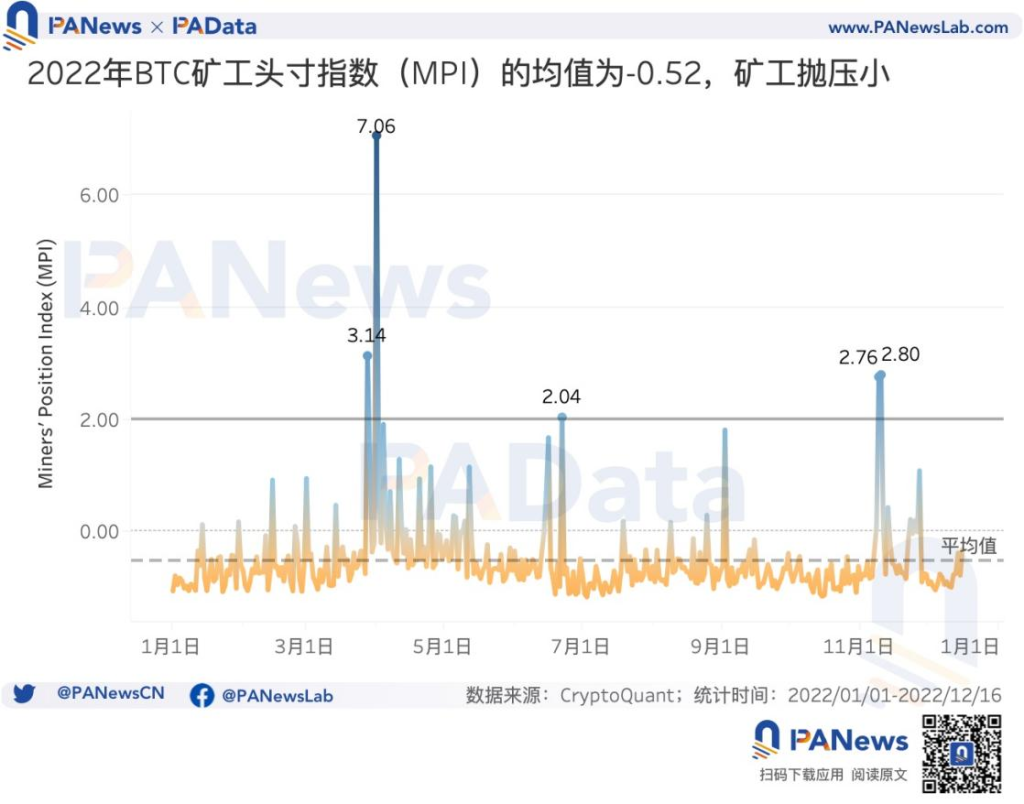
However, despite the downturn in the market, there will be little selling pressure from miners in 2022. A higher Miner Position Index (MPI) indicates that miners trade (sell) more Bitcoin than usual, i.e. more selling pressure. Generally speaking, an MPI greater than 2 indicates that most miners are selling Bitcoin; an MPI less than 0 indicates that miners are under less selling pressure. According to statistics, the average Bitcoin MPI for the whole year is -0.52, which is less than 0, and the selling pressure is relatively small. However, there were four periods of high selling pressure throughout the year, namely the end of March, early April, mid-June, and mid-November.
The number of lightning network channels decreased by more than 18%, and the supply of WBTC decreased by more than 24%
The applicability of the Bitcoin network is currently mainly reflected in two aspects. On the one hand, it is the Lightning Network that supports efficient point-to-point transactions, and on the other hand, it is WBTC as a medium for connecting with the Ethereum ecosystem. However, the applications of these two aspects will appear in 2022. blocked.
Judging from the data of the Lightning Network, the number of channels of the Lightning Network will drop from 83,000 to 67,700 in 2022, an overall decrease of about 18.53%. Taking mid-October as the boundary, the number of channels remained basically stable before, but since then, the number of channels has decreased rapidly and significantly. The decrease in the number of channels means that the connectivity of the entire network is reduced.
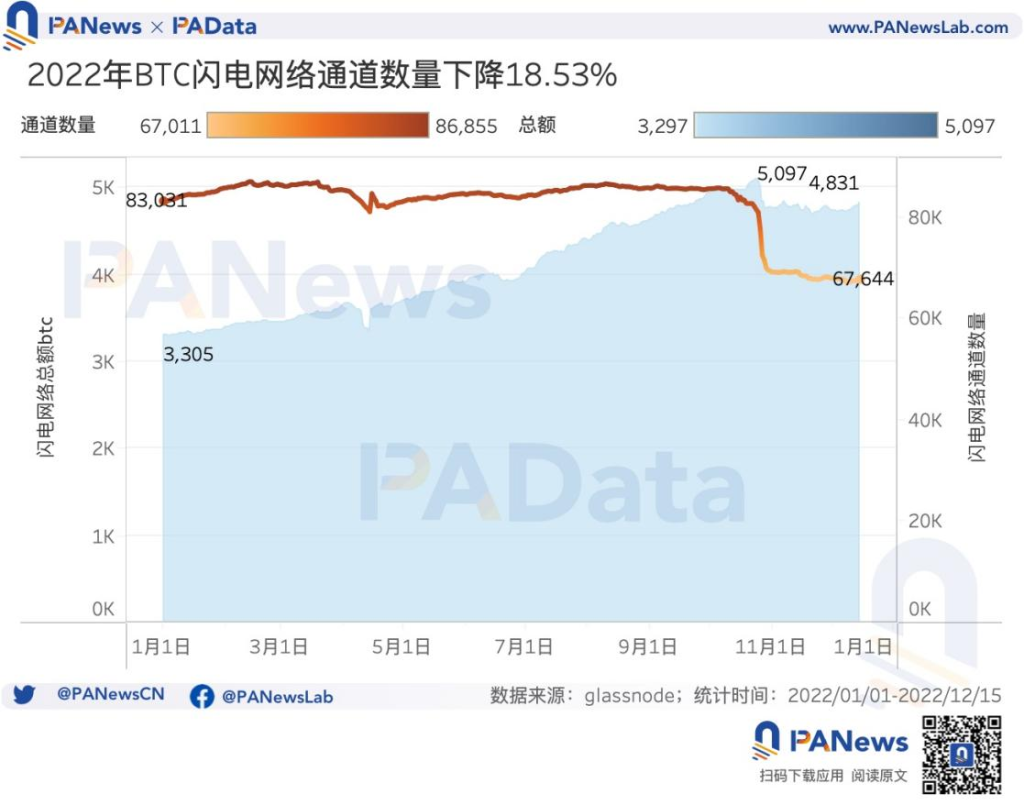
In addition, the capital capacity of the Lightning Network experienced a change of first rising and then falling during the year. Taking October 25th as the boundary, the capital capacity of the Lightning Network has risen from 3305 BTC to 5097 BTC, an increase of about 54.22%. But since then, the capital capacity of the Lightning Network has dropped rapidly, falling to 4845 BTC within 3 days, a drop of about 4.94%, and has basically stabilized at around 4760 BTC since then. The overall increase of the annual fund capacity is about 46.19%
However, on the whole, the development of Lightning Network in 2022 is still relatively stable, especially the capital scale will increase significantly. In the future, as a second-tier network, the Lightning Network will still have a lot of room for development in its ecology.
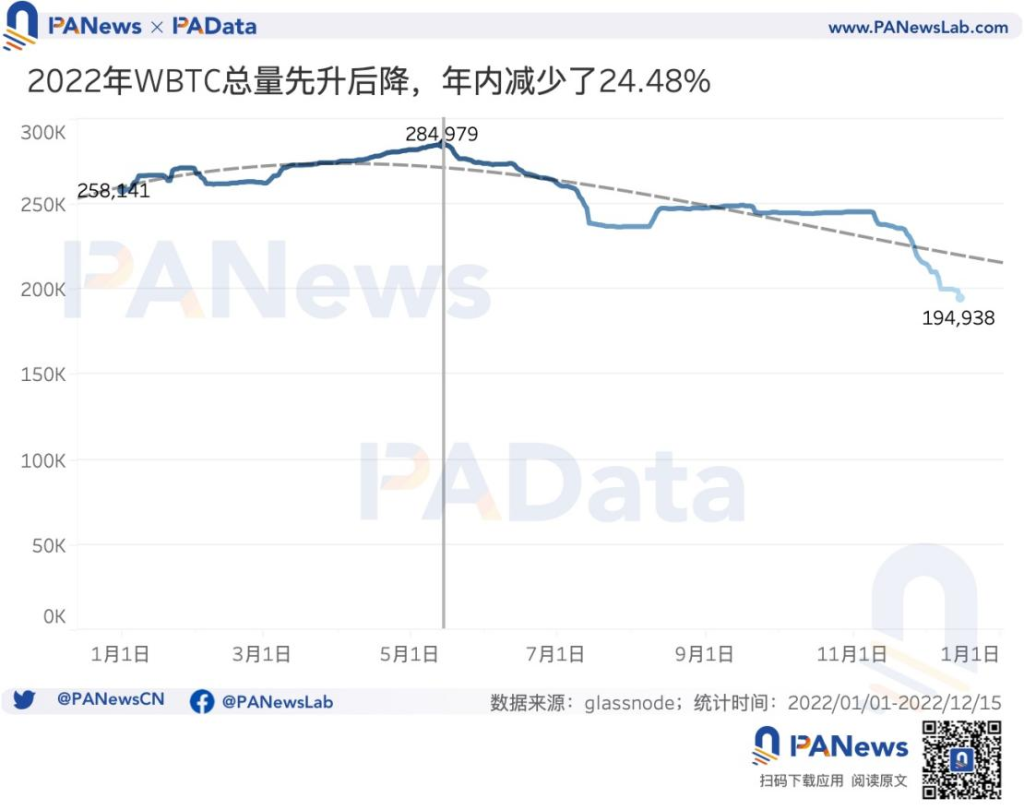
Judging from the data of WBTC, the total amount of WBTC in 2022 will also rise first and then fall. Taking mid-May as the boundary, before that, the total number of WBTC increased from 258,100 to 285,000, and then fell all the way to 194,900 at the end of the year, with a daily decline of about 24.48% during the year. Affected by the FTX incident, in late November, the WBTC/BTC exchange ratio was once slightly lower than 1, showing a decoupling phenomenon. However, WBTC is essentially a BTC-anchored currency issued across chains, which is controlled by multi-signatures and is relatively safe. The decline in the number of WBTC means that the connectivity between Bitcoin and other DeFi ecosystems has decreased.
Like what you're reading? Subscribe to our top stories.
We will continue to update Gambling Chain; if you have any questions or suggestions, please contact us!
