There’s been a lot of FUD about web3 and digital assets recently. Bear market vibes.
Here is a compilation of ~120 charts that put where we are into context.
The State of Web3 and digital assets as of Q4 2022.
1. Bitcoin
- How is the development of the Cosmos ecosystem, which is as popular as Ethereum?
- Data Analysis: The TVL calculation of Uniswap V3 is all wrong?
2. Ethereum
3. Stablecoins
4. DeFi
5. DAOs
6. NFTs
7. Metaverse and games
8. Emergent Themes – Bridges, scalability and consumer social
9. Mobile app usage and exchange deposit behavior
Data sources used
1. Glassnode
2. Nansen
3. Parsec
4. Cryptoquant
5. Santiment
6. Intotheblock
7. TokenTerminal
8. Dune
9. Cryptoslam
10. WeMeta
11. MetaMetriks
12. L2Beat
We start with Bitcoin. As of July 2022, a billion bitcoin wallets have been created. Of these, some 42 million have a non-zero balance. It took bitcoin ~4 years to see its first million non-zero balance wallets. The last million took six months.
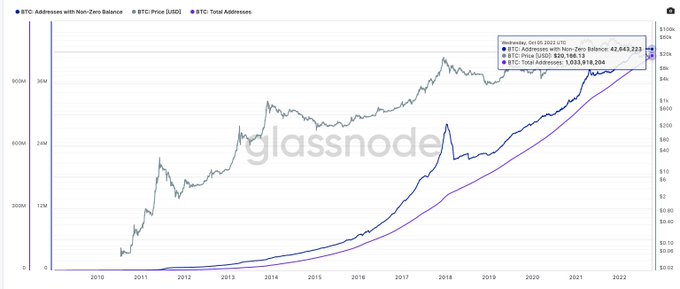
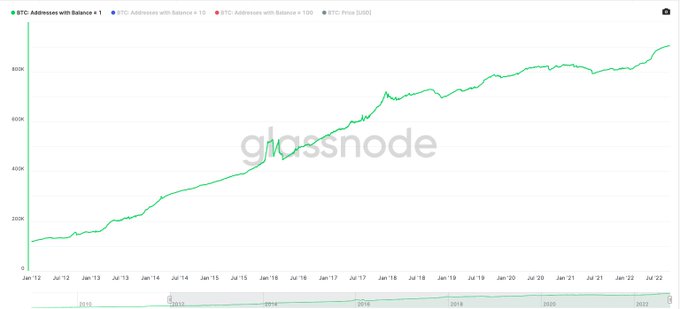
It is easy to dismiss that figure as “dust wallets”. Wallets that hold a small amount of Bitcoin from a random transaction in 2011 may add up to it. Wallets holding 1+ bitcoin set a new ATH despite it costing 100x more than ~5 years back to acquire one bitcoin
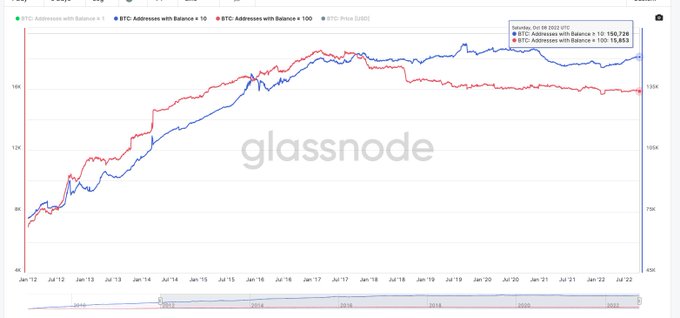
Some of the larger wallets have divested since the price rallies of June 2017 though. Wallets holding more than 100 bitcoin peaked at 18k wallets in June 2017, and those with more than 10, at 150k around Sep 2019 They have more or less flatlined since then.
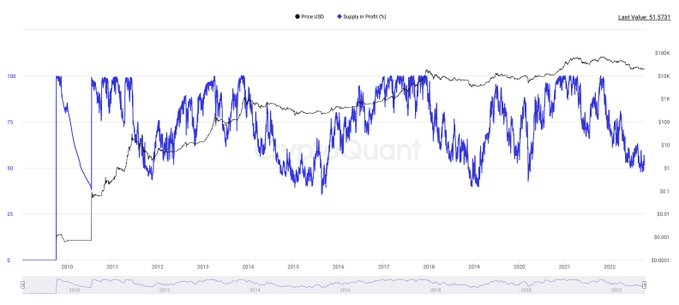
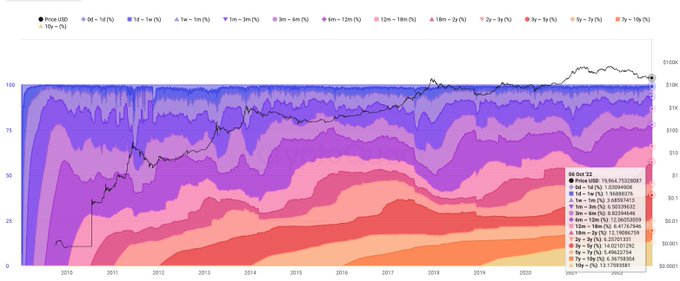
Supply in profit % takes the bitcoin price the last time a coin was moved and the current price to see if the coin is in profit. At ATH – all UTXOs are in profit Currently, ~54% of utxo’s are in the green. Historically, this measure bottoms around 40%
Age bands look at what % of a network’s assets were moved in different periods. The assumption is that moving some of the older coins will lead to lower prices as they were acquired cheaper ~40% of tokens have not moved in 3yrs or longer (inc Satoshi’s coins)
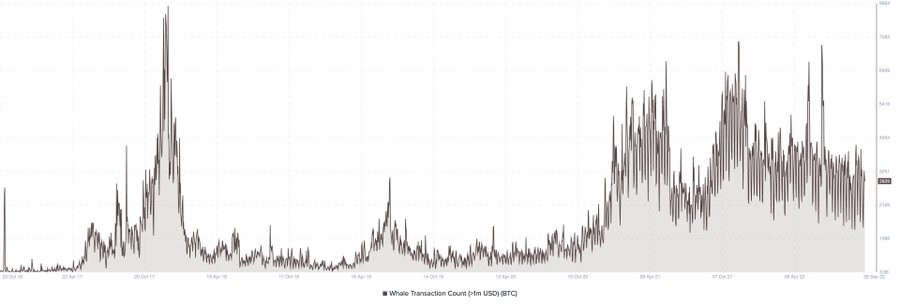
One way to gauge Bitcoin’s usage is the count of transactions worth over $1 million. While this relies on Bitcoin’s price, a floor is being established here. Some ~3000 tx’s worth over $1mil occurs on Bitcoin on a given day to day.
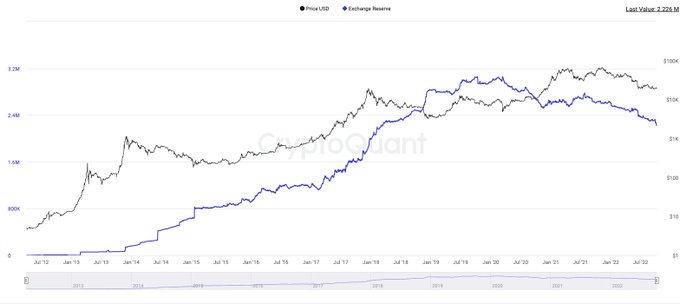
Close to ~10% of Bitcoin’s supply rests on exchanges today (around 2.26mil coins) At its peak, this figure was closer to 3 mil bitcoins. ~1 mil has more or less gone towards cold storage / prime brokers in the past year
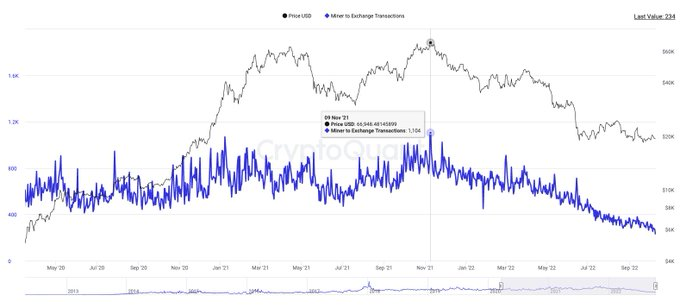
Miners are a crucial part of the supply chain for new coins entering the market. Wallets identified to be held by them hold slightly over 1.9 million bitcoins (9%) of supply. They seem to be strong holders – likely due to hedging through off-chain instruments like options
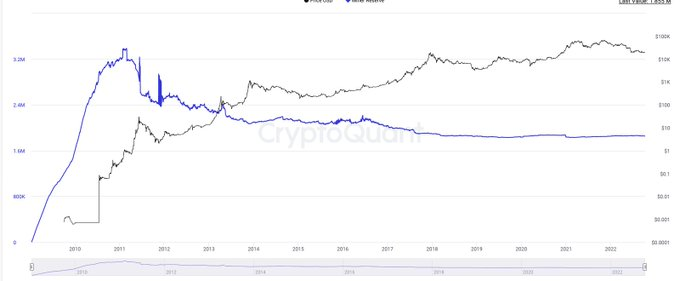
At peak, miners held close to ~168 billion worth of Bitcoin. That figure is now around ~$33 billion. As mentioned earlier, suggesting they lost all of those gains is not fair. Highly likely a large chunk of these was hedged.

Correlation is not causation blah blah – but it is worth observing that wallets owned by miners did the highest number of transactions towards exchanges right at the top – last year. Miner-to-exchange transactions have been in decline since then
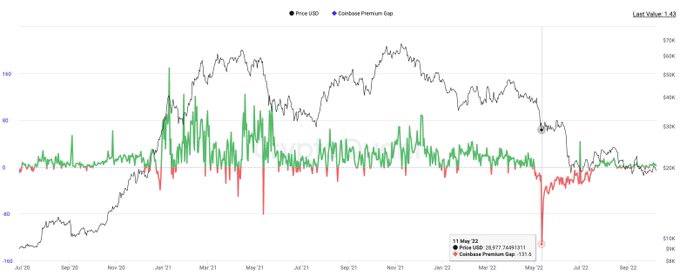
The coinbase premium index looks at the difference between coinbase pro price (for btc, in USD) and that on binance (for btc, in usdt) It’s a measure of US investor interest in buying Btc. It has been somewhat flat lately – but worth noticing that discount during May 2022
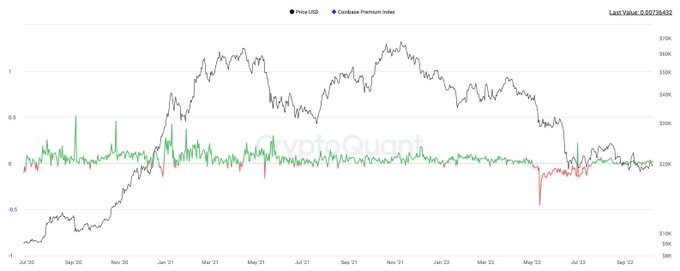
This premium gap went from a high of ~$160 when Elon was talking about bitcoin in Jan 2021 to a low of ~140 thanks to Do Kwon For the moment -it stays choppy, like the rest of the market
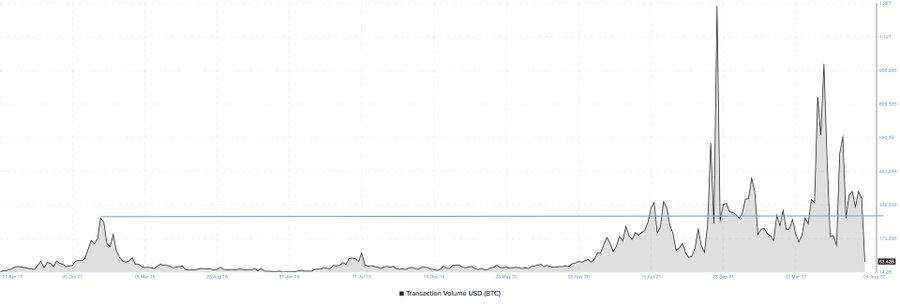
The average week sees some ~350 billion flowing through Bitcoin in transfers. For a sense of scale, that is ~5x what India sees annually in inbound remittance This figure changes depending on what the price of Btc is but it is still up from the $200 billion range in 2017
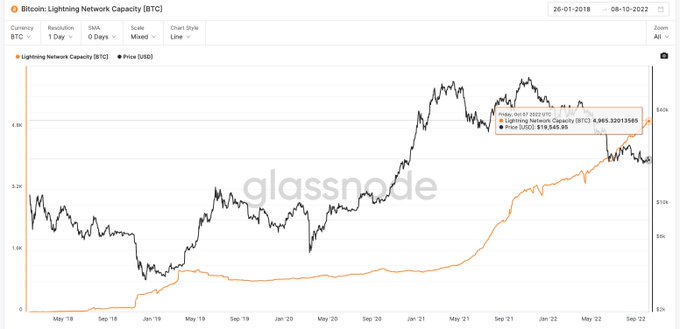
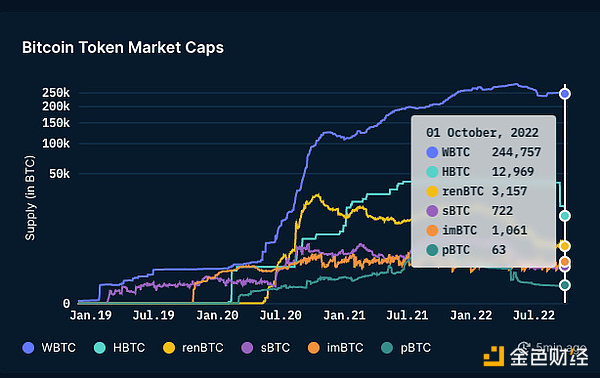
I will end on Bitcoin with an honorary mention of WrappedBitcoin. Currently – there are~50x more coins on wbtc than Lightning network’s capacity.
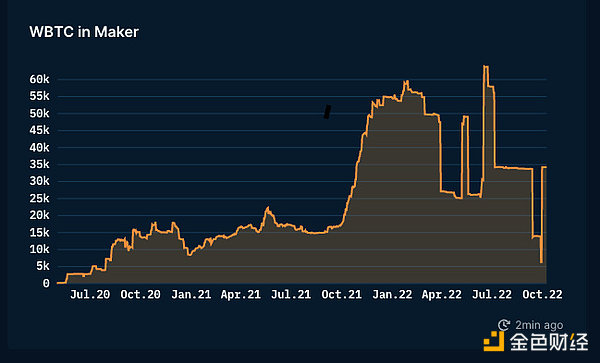
About 250,000 of them-about 60,000 bitcoins in Makerdao’s heyday. Now the figure is closer to 40k. DEFI yields are, of course, the key driver of this mix between ether and Bitcoin.
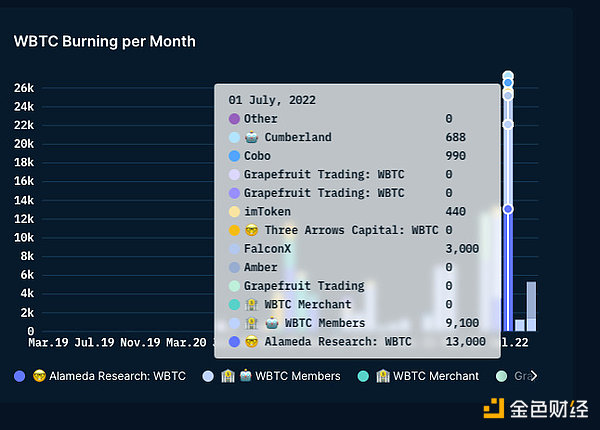
Players like Alameda, Grapefruit, and 3arrows (UH) — historically crucial to its adoption. The June fire was caused in part by the market self-correcting and stress-testing everyone’s balance sheet in May.
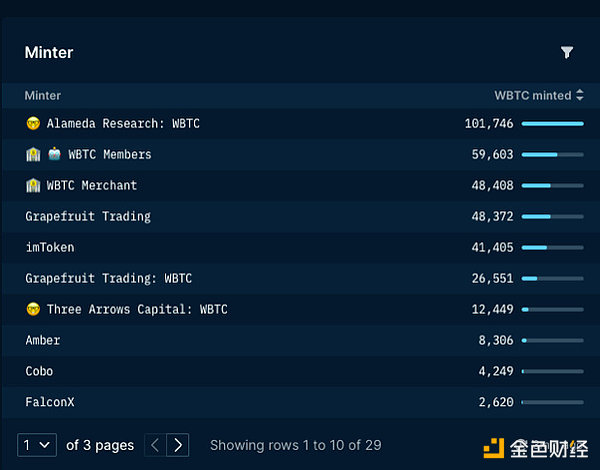
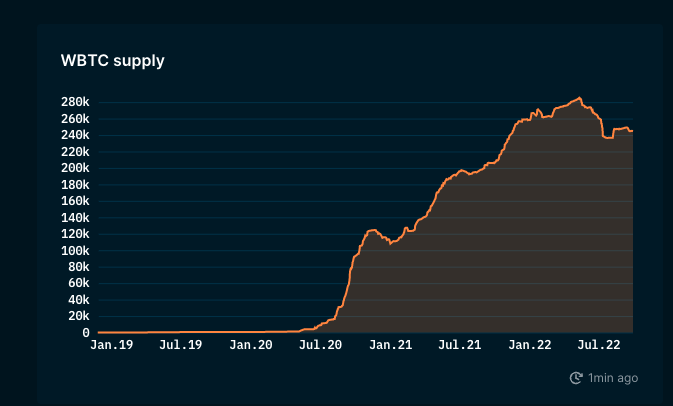
In terms of market share, nothing compares to WBTC. The second largest player owns 5% of the btc-on-eth supply. Given their distribution and coverage, I think a similar product from Binance could be hugely attractive.
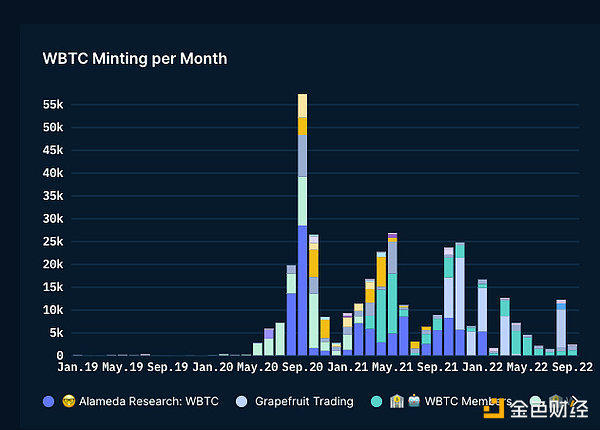
That said-it does seem that interest in the bitcoin packaging variant is waning. At its peak, we see nearly 55k of WBTC being cast each month. In August, that number fell by about 80% .
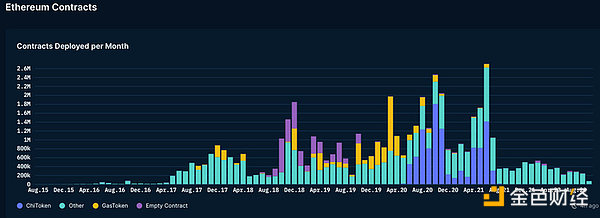
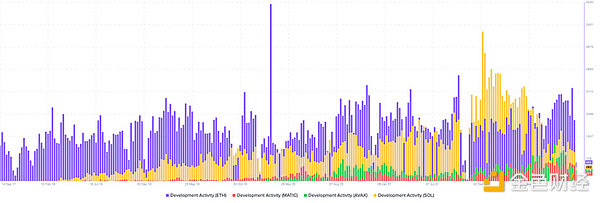
Next, we look at what happened at Ethereum. If we use the deployed smart contract as a measure of developer interest — we can say that activity is on track for 2019. However, this does not account for the fact that other chains may attract developers’ attention.
Santiment has a developer activity index that requires several GitHub repositories and their activities to give indicative metrics. Here’s how Solana, Matic, and Avalanche caught up with ether. Note: the data is very crude and does not make much sense/difference in itself.
Developers work in multiple places, but what happens at Ethereum? Let’s start with the basics. An active wallet is a good place to start. What I find interesting is that despite the year-long bear market, the aether wallet has not fallen significantly to a new low.
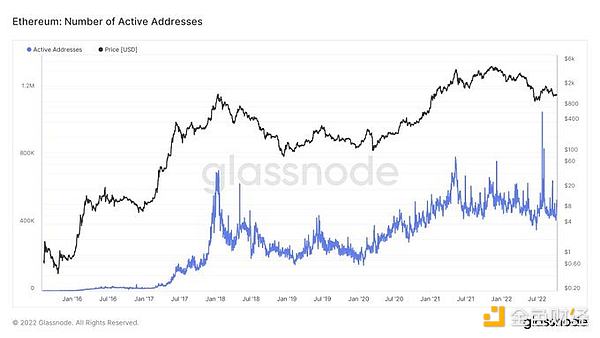
A twofold increase in daily active addresses isn’t much — but it’s impressive. Since the last Ath, the number of non-pocket purses in Ethereum has increased from about 8m to 86m. To be sure, people use multiple wallets — a good measure of online activity.
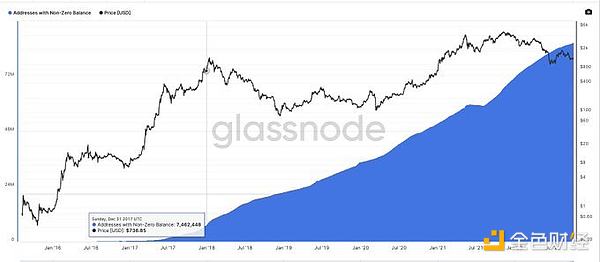
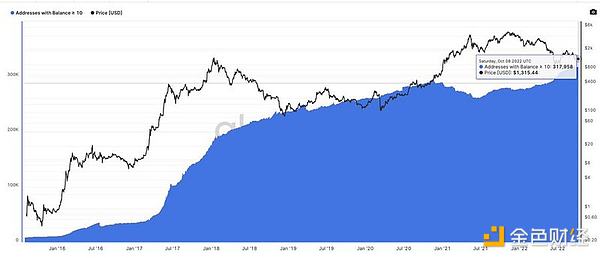
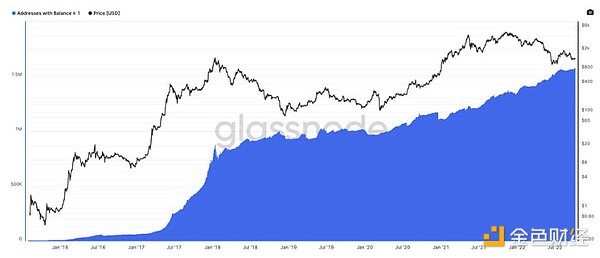
People will always argue that these are zombie wallets — so we explored every wallet over 1eth and 10eth. Both are at record levels. Today there are about 1.58 million wallets with more than one ETH-up from 882,000 in January 2018.
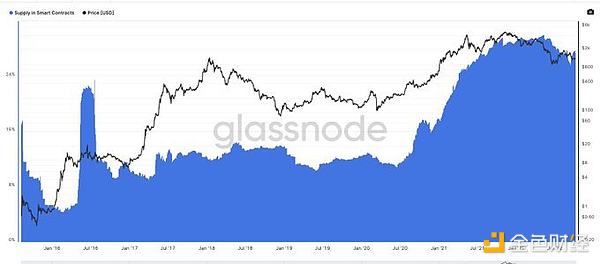
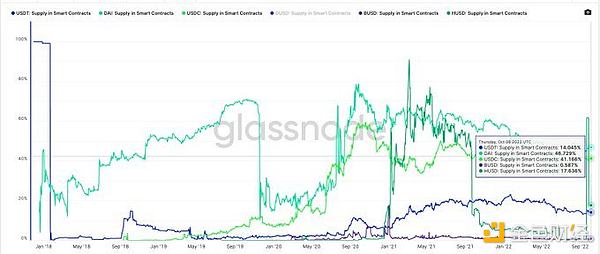
The measure of trust in networks is the percentage of supply in smart contracts. If you can use it to generate revenue, you do so at ETH, where 27% of supply comes from smart contracts. Nor has the bear market affected the figure.
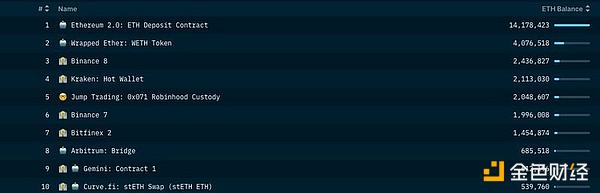
Four of Ethereum’s top 10 purses are smart contracts or variants — still one of the few assets CeFi is losing its share of smart contracts. So it’s safe to say — people are using ethereum — and increasingly using its smart contracts.
This chart breaks down the types of transactions on the web. By the time it reaches Ath in 2018 — about 60% of all transactions on the web will simply send the ETH from A to B. That number is now down to 30% . – NFT 15%-stablecoins approximately 9%-DeFi 10% .
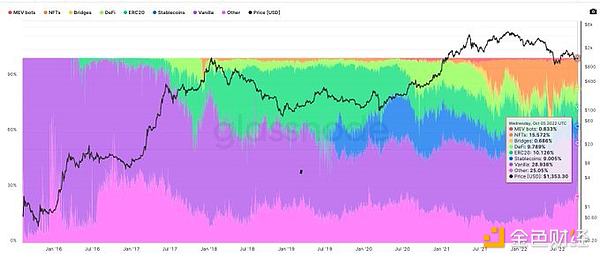
Use cases such as NFT, DEFI, and stablecoin transfers actually far exceed the number of ERC-20 token-related transactions in a single day. Yes, you can also use these applications to speculate.
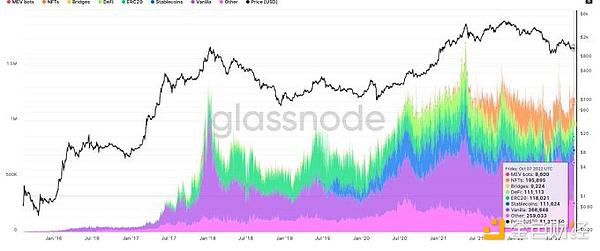
Use cases such as NFT, DEFI, and stablecoin transfers on a given day far exceed the number of transactions associated with ERC-20 tokens. Yes, you can also use these applications to speculate
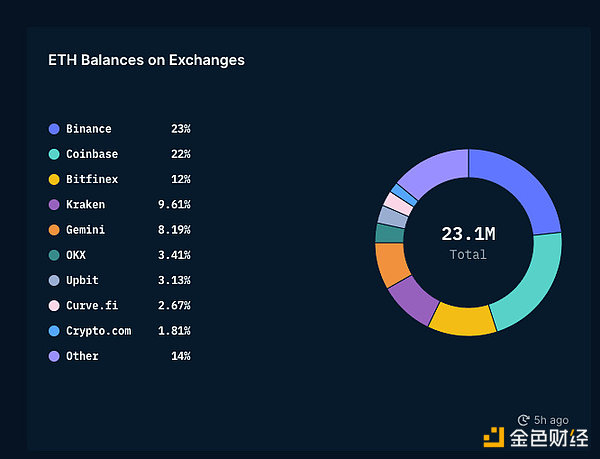
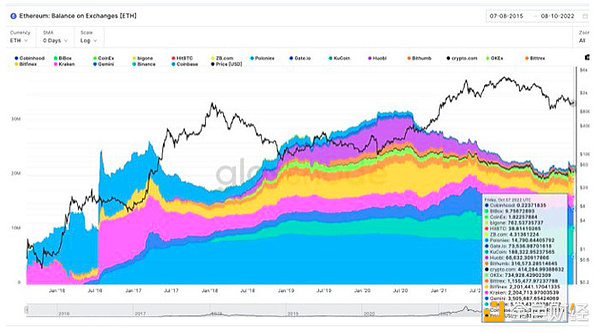
Most of the balance is held by Binance and Coinbase, which together control about 44% of the ETH balance held by the exchange. The second chart here shows how Coinbase is stagnating in market share, while Binance is catching up (Nansen’s chart doesn’t include FTX for some reason) .
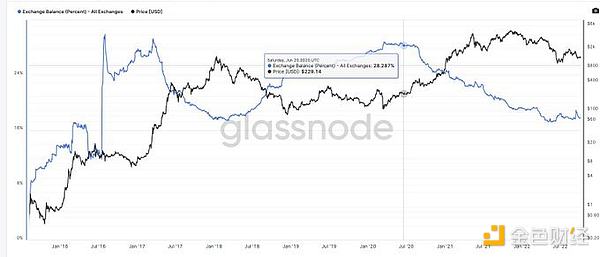
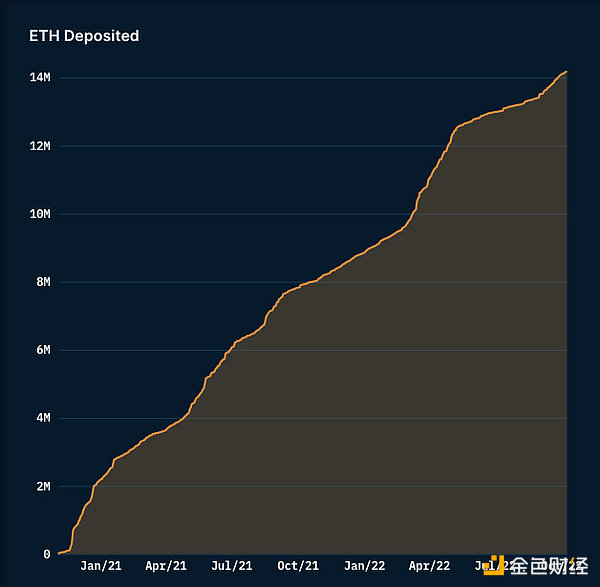
Okay.-so ETH is leaving the exchange, but why? The main contributor to this trend is DEFI. We’ll dig into that later. Some 14m ETH 2021 have been pledged to ETH2 since January.
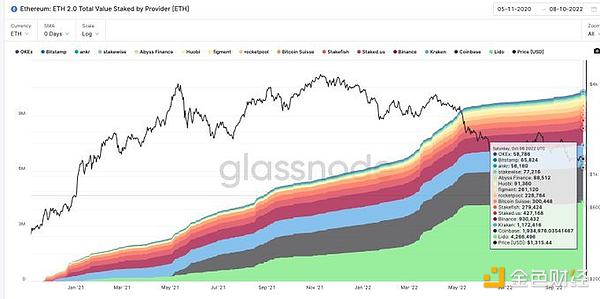
There’s been a lot of discussion about this-but interestingly, Lido has far outstripped the full-blown exchange alternative Lido in terms of total value of pledges, with about 4m eth pledged through it and 3m pledged through Binance + coinbase.
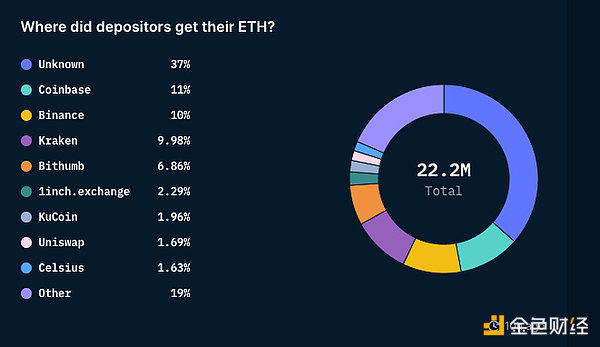
The reason I say exchange deposits are pledged is because of this chart from Nansen — about 40% of pledged ETH can be traced back to centralized entities.
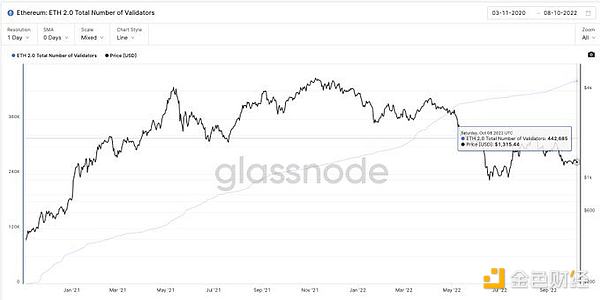
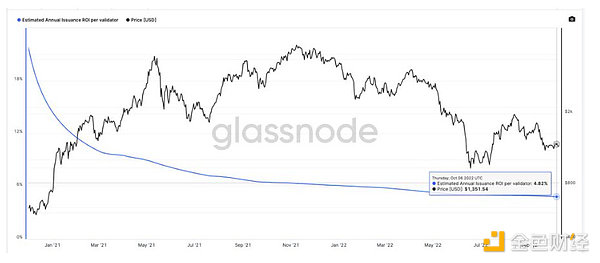
At the time of this writing-there are more than 442k validators on the network. Thus, part of the attraction for ETH holders is that they can see a theoretical yield of about 4.5% for the future ETH pledge.
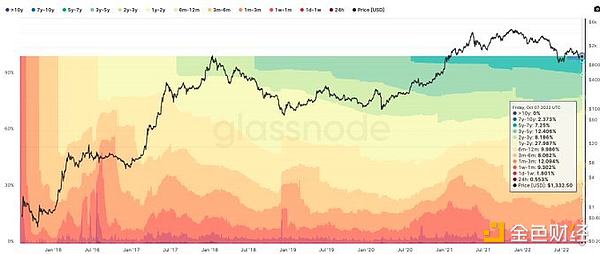
Nearly 30% of the ETH supply has been dormant for two years or more. I’ve ignored hodlwave for more than a year here because the ETH2 bet affects this metric. This is a large part of the supply that is willing to withstand multiple cycles.
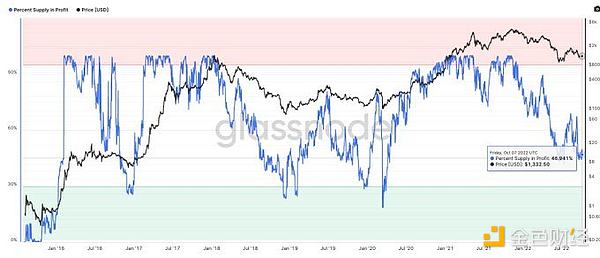
Part of the reason for this willingness is that much of the network is in relative profit. $1,290 — nearly 46% of ETH holders are still green. During the March 2020 crash, the Index’s all-time low was about 18 per cent.
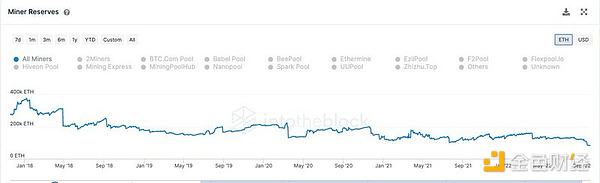
One interesting consequence is that miners hold less ETH. They may have taken their AUM and pledged it — but since January 2018, at the time of this writing, ETH’s miners’ reserves have increased from about 400k to 83k.
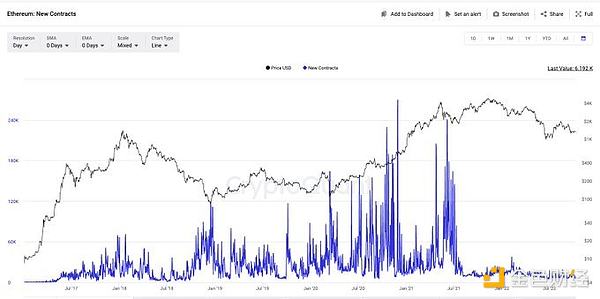
One way to measure the growth of the ETH is to look at the number of smart contracts deployed. As of this writing, there are about 24m smart contracts on the web. That is about eight times the 3 million recorded during the 2017 rebound.
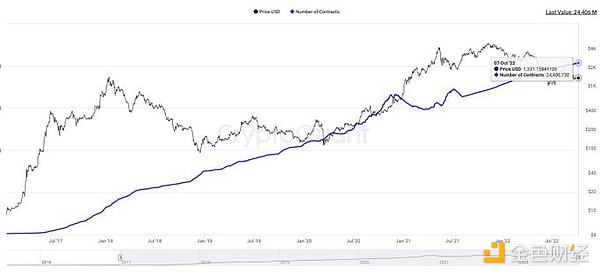
Despite the huge lead, interest in deploying new smart contracts to Ethereum is waning. As a result, the numbers are more or less back to 2019 levels. Developers’ thought sharing may be captured by other emerging layers 1.
Stablecoins have one of the most beautiful growth trajectories of all cryptocurrencies. Within a few years, their combined market capitalisation had exceeded $100bn. 2022 was the year USDC finally surpassed the USDT in terms of supply to the market.
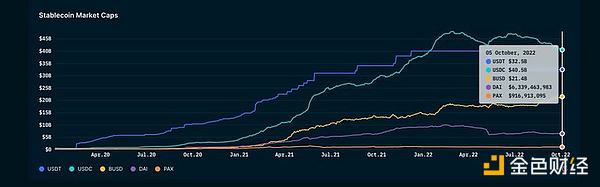
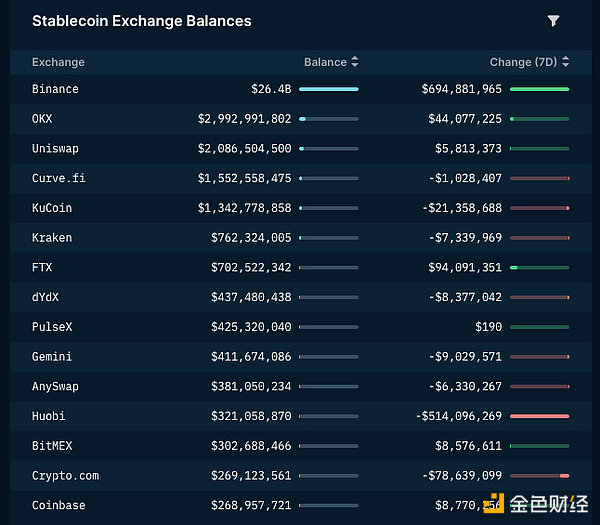
Of that $100BN or so, the company alone has a balance sheet of $26bn. Although, if-that figure is partly boosted by their 20 billion BUSD holdings. Purely from tether’s point of view — Binance has 20 times the USDT of its North n counterparts (FTX, Kraken) .
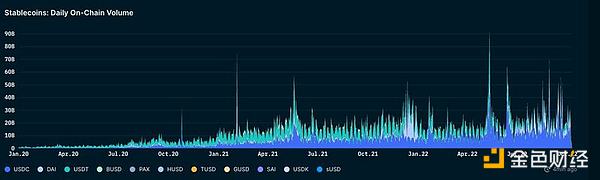
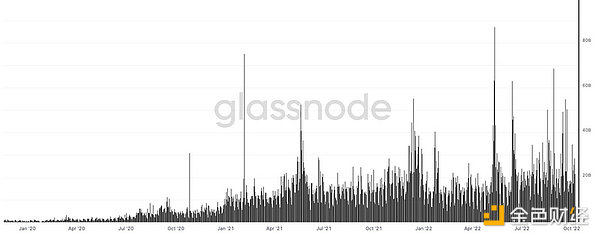
There may be a gap in this data as it may not involve some L2 and non-EVM chains-but in terms of trading volumes, stablecoins have grown about 22-fold in the past two years, despite the bear market. From about 600 million a day to about 14 billion today.
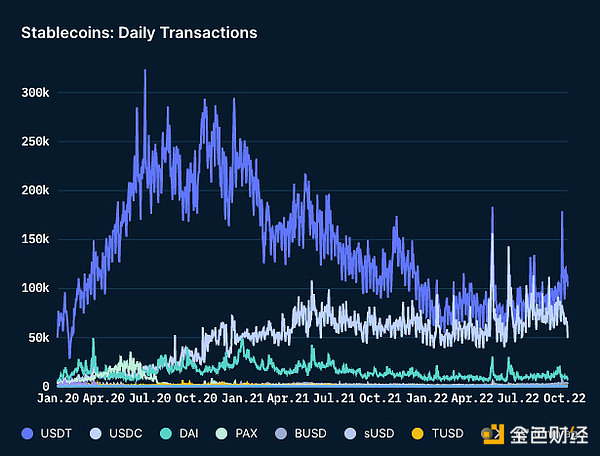
June 2020(DeFi Summer?)-today, cumulative transactions of the STABLECOIN TX are about 500,000 per day, close to 200,000. What could happen is 1.2. Whales use stables as holder assets during bear markets. 2. Greater stable-currency transactions through fewer wallets.
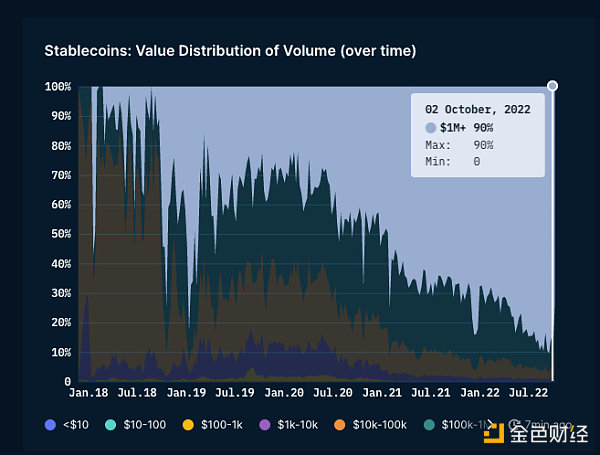
The reason for my recommendation is that transactions worth more than $1M account for about 90 per cent of today’s mobile trading volume, although less than 0.5 per cent of the volume. This is in line with what we typically see in traditional economies — so it’s not surprising.
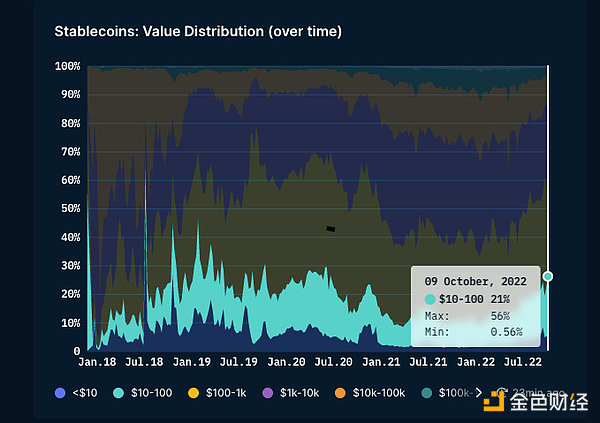
One of the interesting things I’ve noticed about this data is that under $100 accounts for a quarter of all transactions through stablecoins. People still use these networks to send a small fee, although the cost is about 1-2.
That number may be down due to the lack of coverage of non-eth chains — but 1.5 percent. BUSD is the least used stablecoin on smart contracts 2.5% . 17% of the USDT’s supply comes from smart contracts. 3. Nearly half of Dai and USDC are on smart contracts.
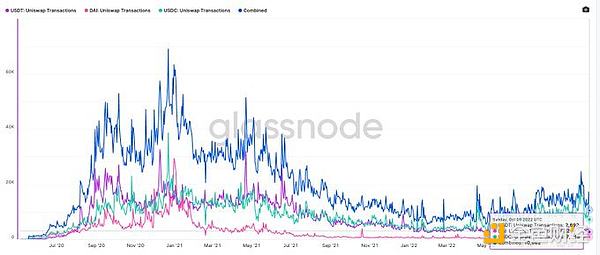
I wonder how many of these stable assets are traded on UNISWAP. At its peak, about 60,000 doubloons were traded through UNISWAP. Today approaching 10k this is a significant drop (along with a decrease in volume/activity) .
Until January 2020, we saw about $1 billion in a single day flowing through the Stablecoin chain. That number has now risen about 25-fold on a random day. In the chaos of May 2022, some $87 billion worth of stablecoins moved from wallet to wallet. (conservatively)
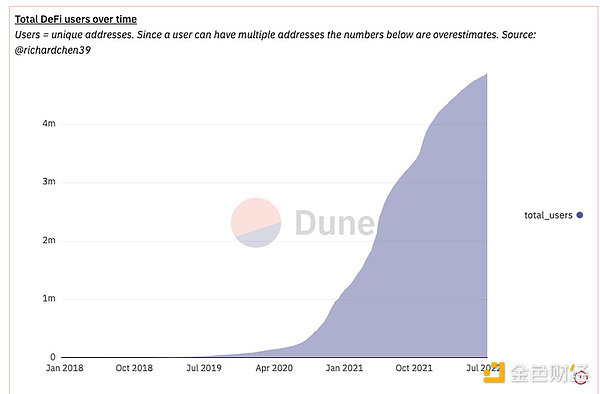
This leads me to the next section-DeFi. Richard Chen’s chart shows the DeFi’s exponential growth rate. From about 4K users in January 2019 to 4.7 million today. Defi has about 10M users, or less than 0.3 per cent of the Web’s user base.
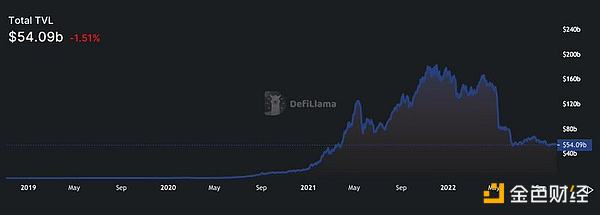
Whenever DeFi is reported in the media — it is eager to explain how DeFi TVL collapsed, without taking into account the fall in underlying asset prices. It wasn’t until May 2020 that DEFI reached its first billion tvs, and from there we’re still 50 times bigger.
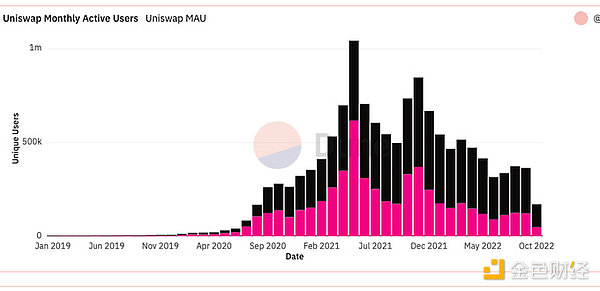
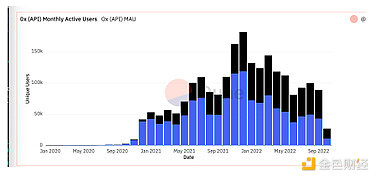
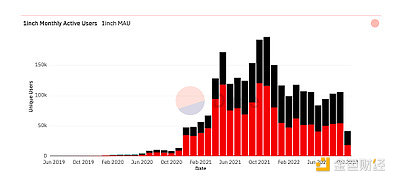
Similarly, there is a general rush to clarify how the Mau on the DEFI collapsed. From what I can see, there is a pullback in the absence of a token incentive, especially in terms of volume. But the users themselves did not disappear.
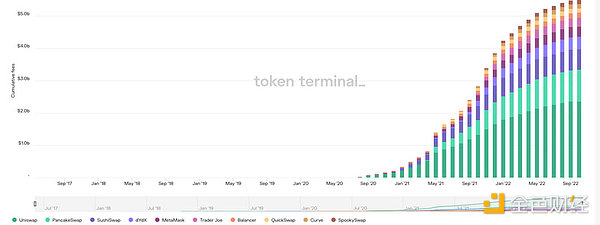
That’s not to say trading volumes haven’t taken a hit — Our Defi trading volume has fallen from a peak of $250 billion to about $100 billion. But here’s the interesting thing — $100 billion is still 5,000 times the monthly average of $20 million in 2019.
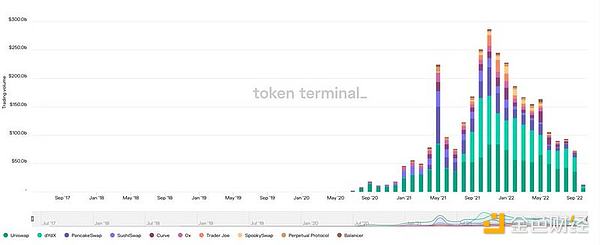
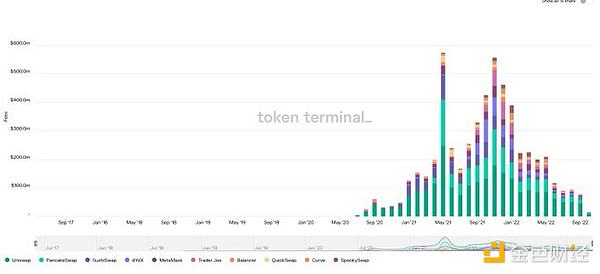
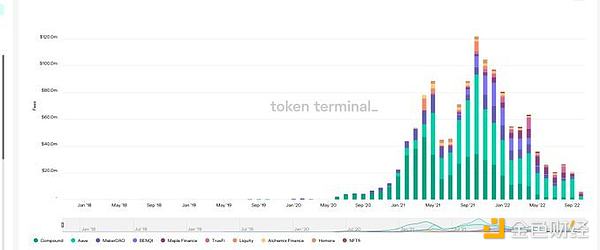
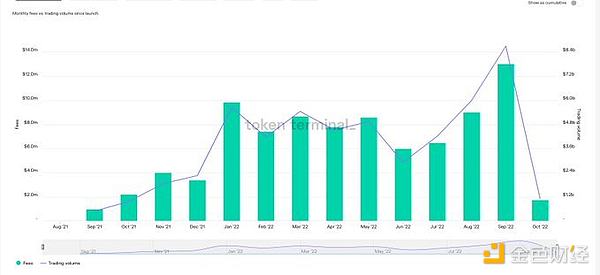
Lower transaction volume + lack of token incentives = lower fees generated. At its peak, the famous Dex platform generated about $600 million in fees; we’re down to about $80 million now.
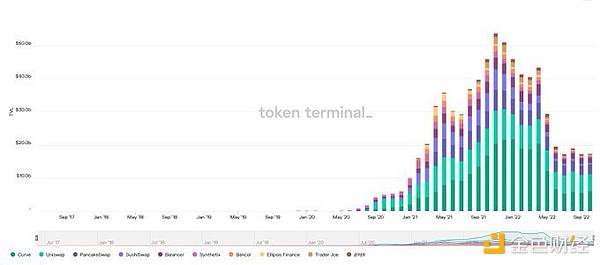
TVL on these platforms has fallen from $50 billion to about $20 billion — but in terms of declining activity, it looks like we’ve hit a bottom. Those who are still doing LPing and trading are sticky users and are likely to continue to do so.
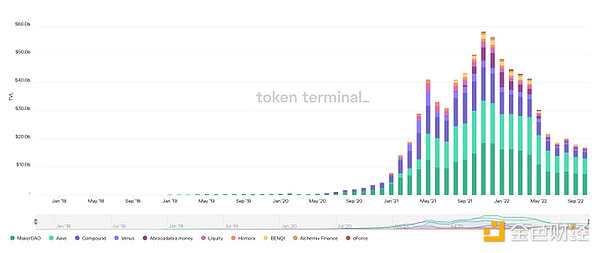
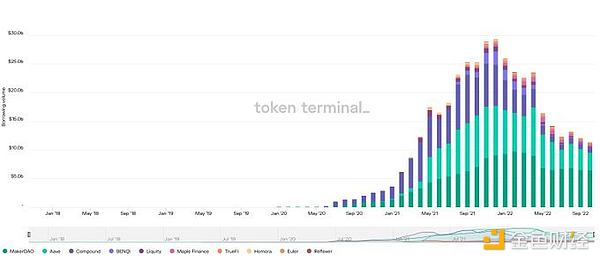
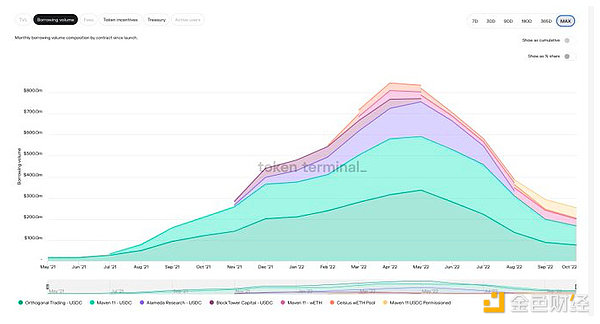
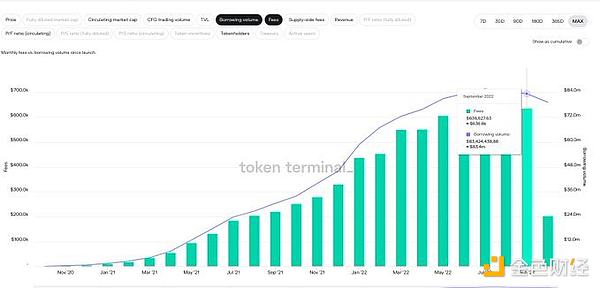
TVL’s decline also applies to lending apps — down about 50 percent — in part because of the May crash. At its peak, lending applications processed about 58 billion-now about 18 billion.
Lack of volatility + lending demand hit the cost of lending apps — the cumulative monthly fees for these platforms fell from about $120 million to about $20 million.
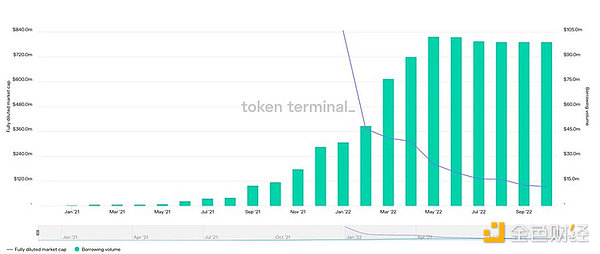
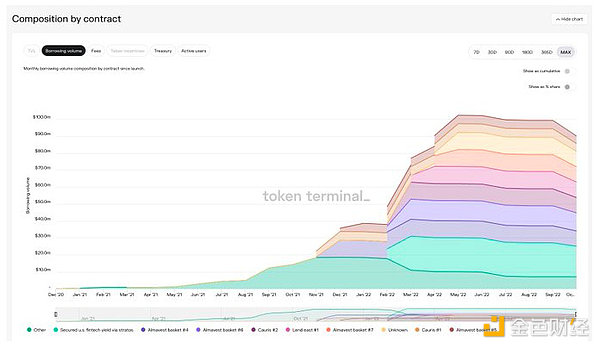
Borrowing demand has grown from about $30 billion to $13 billion — and yield + platform fees have certainly been falling for a long time. However, I do find it interesting that over the past few months there has been an upfront charge for this price.
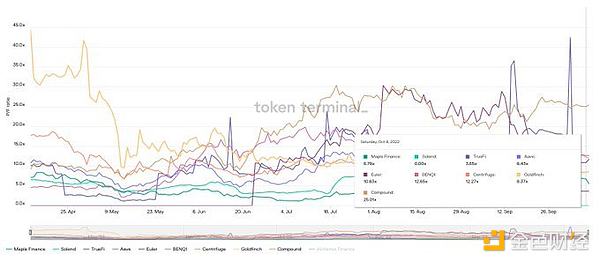
In terms of price-to-cost ratios, players like Maple and Goldfinch are still in multiples of TRADFI banks. Obviously, players like AAVE and Compound have a premium associated with them-but the price is more or less in line with the expected cost.
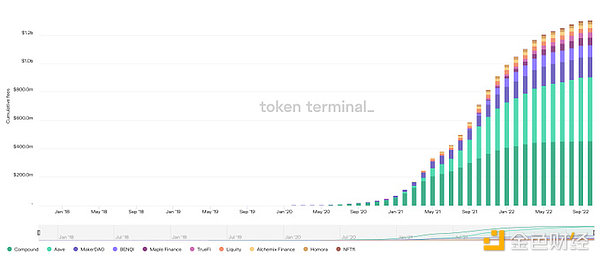
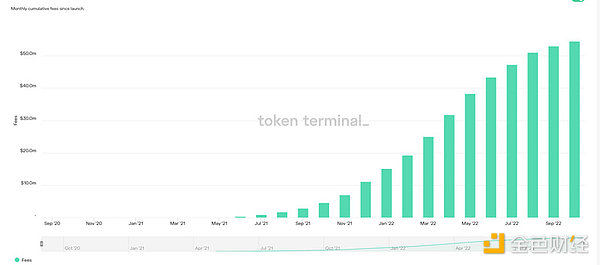
In the past two years, the lending app alone has generated $1.2 billion in expenses — a cumulative graph, so forgive the crime graph. We’re still going down.
Also — the exchange has collected about $5 billion in fees over the last two years, and the fees here are probably a mix of platform revenue plus token incentives — so in the future, we may see a little bit of a standstill here, unless there is a significant increase in platform activity.
Some markets are growing in spite of poor market conditions. Take Goldfinch, for example-despite the downward trend, their lending has remained strong.
Maple Finance’s loan desk charged $40 million last year. In the past, the CEFI lending channel has struggled to maintain relevance and customer base.
In fact, the mortgage deficit is probably one of the healthiest sectors of the market cycle. The figure below applies to Centrifuge-their costs and borrowings are Ath.
GMX (comparable dydx) has a similar trend. Last month, the exchange had about 8.6 bn transactions, a new ATH. The cost this month is more than $13 million. To Be Sure, part of DEFI is still healthy and strong.
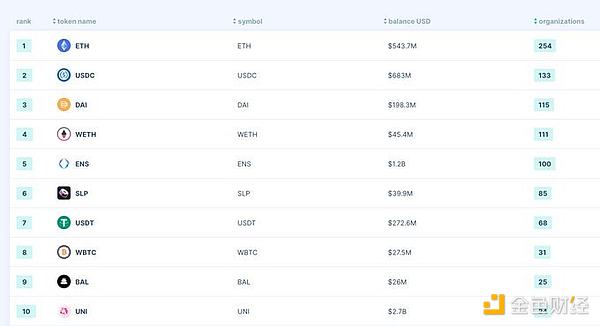
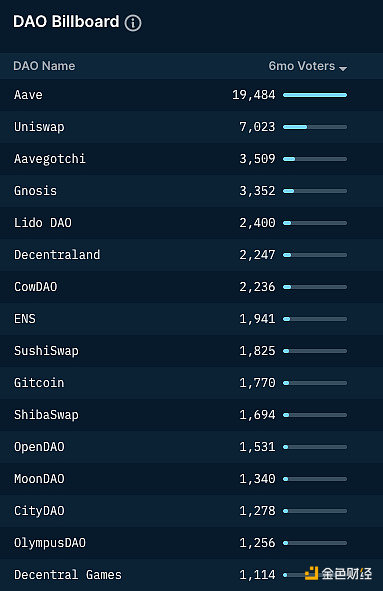
Okay — About Dao — the Dao at Ethereum alone has processed about $9 billion, down from $12 billion a year ago. The following Chart-from@deepdao. There are 16 daos with over $100 million under management. So far, about 700,000 of the 4 million DAO-related token holders have voted.
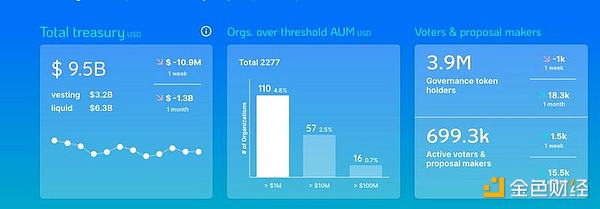
In terms of Dao Holdings, ETH remains the most popular asset, followed by USDC. The 254 daos in ETH hold about $543 million. For the USDC-it’s $683 million, almost double Dai’s.
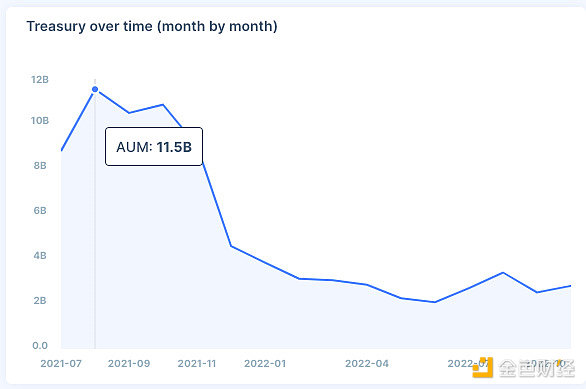
UNISWAP’s coffers handled about $12 billion at their peak. In the past six months, it has been close to $2 billion. Even today, most of them are held at UNI. Of the 350,000 holders of Dao tokens — 47,200 voted last month (just over 1.5% of active voters) .
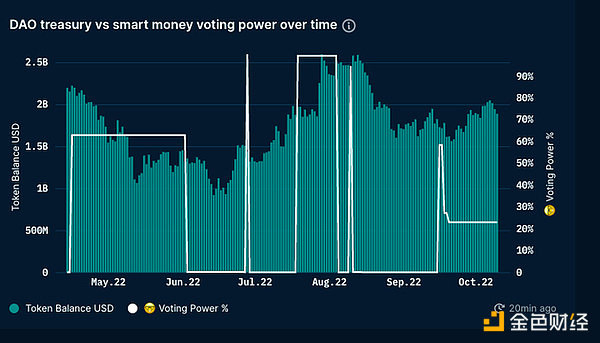
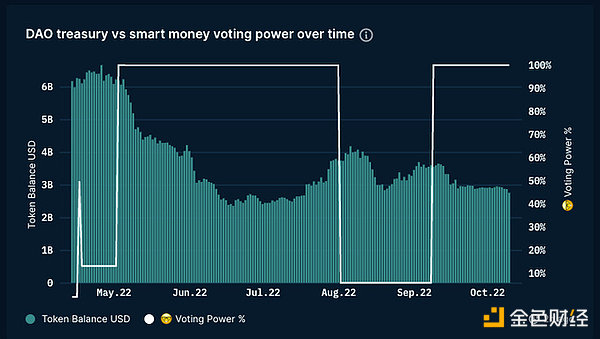
Similarly, BitDAO’s funding has fallen from $6 billion to about $2.7 billion over the past six months. Of the 20K Dao token holders, only 40 voted last month.
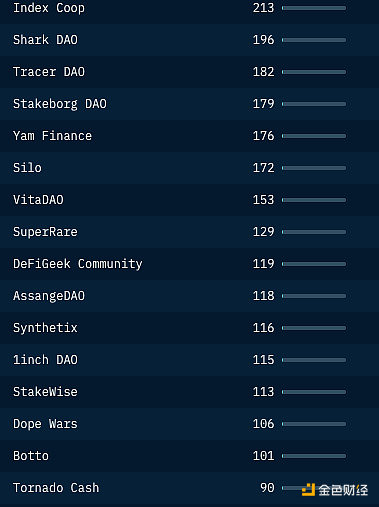
In the past six months, only one DAO has had more than 10,000 voters. While governance-as a concept is interesting, Dao engagement is not as high as you might think. Tornado Cash had 90 DAO voters in six months.
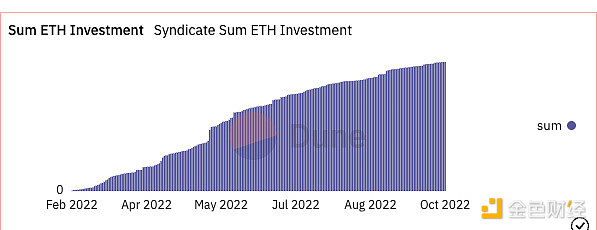
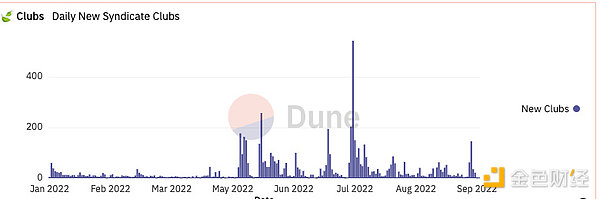
This is not to say that Dao is dying as a concept. Players Like@syndicatedao continue to make it easier for individuals to build daos based on the dashboard on Dune (user: GM365)-to date, about 3800eth has been deployed through Syndicate’s 6.7K Club.
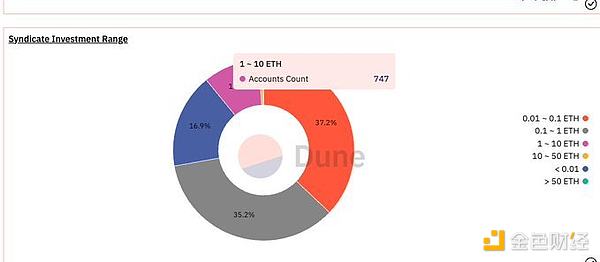
If you think daos are all about whales-consider that value investments below 1eth account for about 70% of the investors entering through Syndicate daos today. These platforms are an important infrastructure for the“Democratization” of capital-oriented cooperation.
One measure of DAO interest is the number of new investment clubs launched. Syndicate daos continue to help roll out more than 100 daos during the single-day peak in September. With the return of retail interest, we may see more than 1,000 clubs in one day.
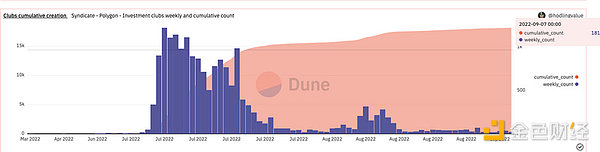
I also believe that the cost savings — by using players like Polygon — will accelerate DAO formation. In context-Syndicate has three times as many product cumulative daos (18,600 clubs) on Polygon.
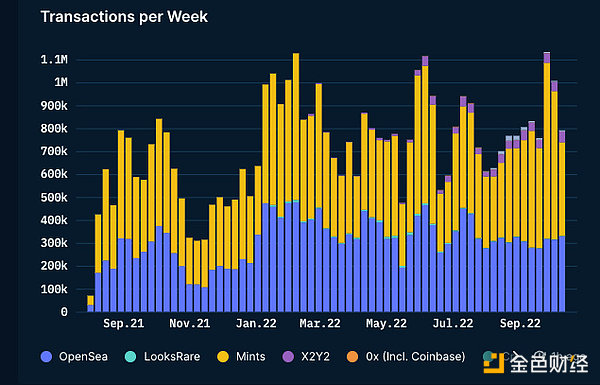
Now-about NFT. There has been much talk of a sharp drop in the volume of trading around them this year. People forget two things 1. NFT relative decline (if tx volume stays constant, it will lead to a reduction in trading volume)2.5% . Reduced risk appetite.
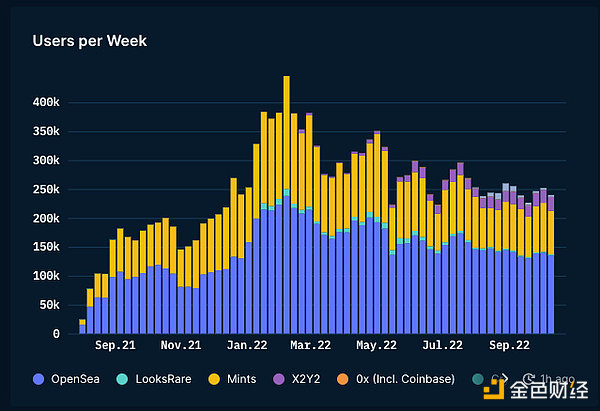
If you look at the market from the perspective of active users — the decline is not as big as you might think. Our Peak was about 400,000-and now weekly active users are about 275,000 a fair criticism of how small the market is.
These users make an average of two transactions a week on the chain (at the ETH) . So it’s safe to say that the rest of the user base is highly sticky and active. Moreover-contrary to repeated claims-trading activity has not fallen.
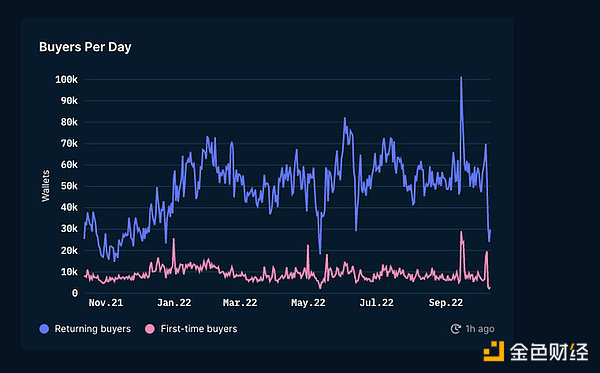
Might these users be anxious to sell out? It’s not real. Most of these wallets continue to buy — with roughly the same frequency as at the beginning of the year. Compared to last year-we have more users trading now.
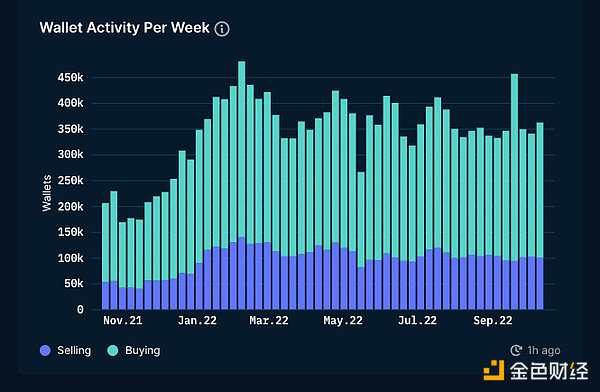
One possible criticism of the data here is that these are just zombie purses. However, if you look at this chart to explore the nature of the wallet return 1.0. Yes, new users have a flat line 2, the existing number has not dropped. – If anything, it reached the new Ath in February.
This is not to say that the NFT is in good shape. From a price point of view, NFT traders have been hit by (I) ETH price declines and (II) lower NFT ETH-denominated prices. An index maintained by Nansen shows the state of NFT price outperformance over the course of the year.
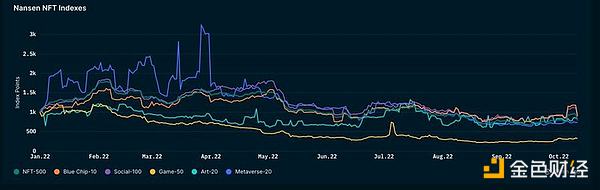
Some thoughts on what I see in the Index 1. Profile Picture Link NFT performed well 2. Game-related NFT is a disaster (atm)3. Nfts accessing links account for about 7% of market turnover.
Okay-so the price is down. How much activity has been reduced?
That’s where the data gets interesting.
Every news 2021 likes to take data from November (the peak) and show how everything has collapsed since then. So here are some smaller charts.
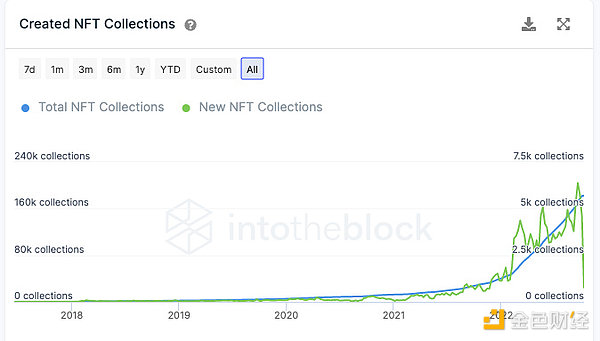
First-create the NFT collection. The 2020-NFT collection totals about 5K. Today, we see as many NFT collections as we can release on a daily basis.
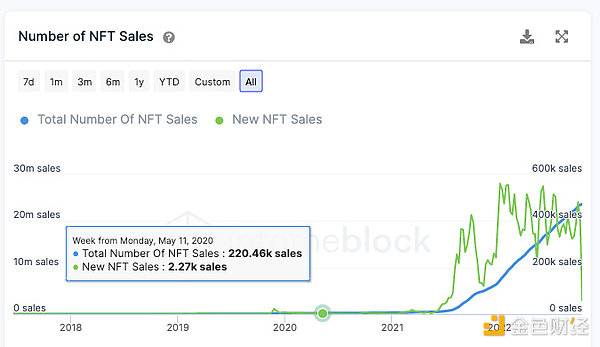
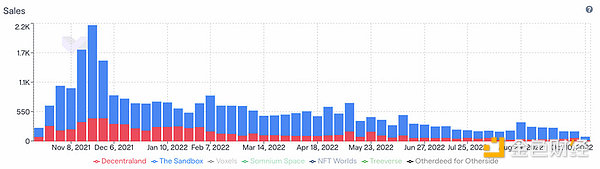
NFT sales volumes have risen about 200-fold over the same period. From about 2K a day in January to 400k today. So far, there have been 23m NFT sales.
Sales are concentrated in the top lines (BAYC, cryptopunks, etc.) — but that doesn’t mean there’s no sales activity for the smaller lines.
Sales are concentrated in the top lines (BAYC, cryptopunks, etc.) — but that doesn’t mean there’s no sales activity for the smaller lines.
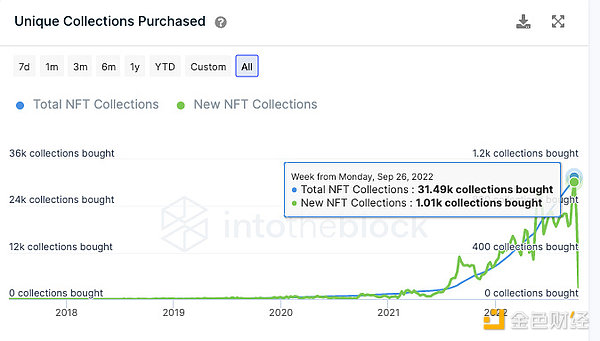
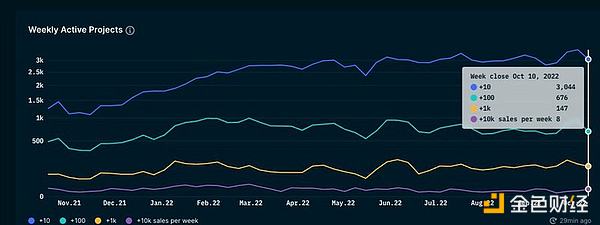
In fact, Nansen shows that smaller projects with lower sales have been on the rise. Figures. Since last year, only about 10 collectibles have been sold each week, rising from about 1,300 to more than 3,600.
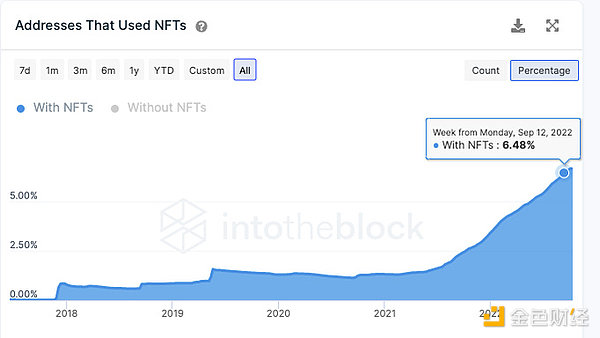
Despite the downward trend in activity, NFT-related wallets now account for about 6% of all active ETH wallets. Whether we like it or not, this is how retail is evolving.
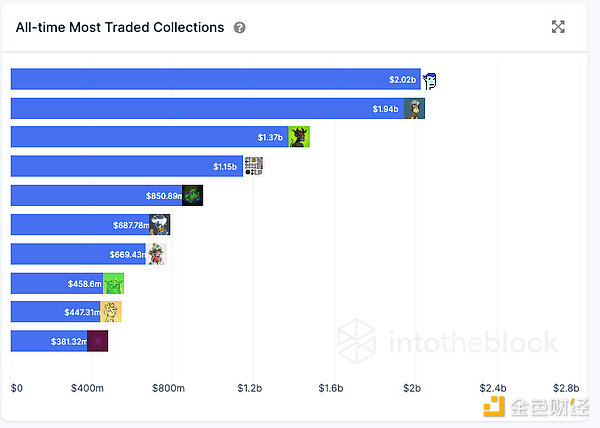
The high-priced NFT has become more or less its own asset class. Bored Apes and Cryptopunks each have close to $2bn in transactions.
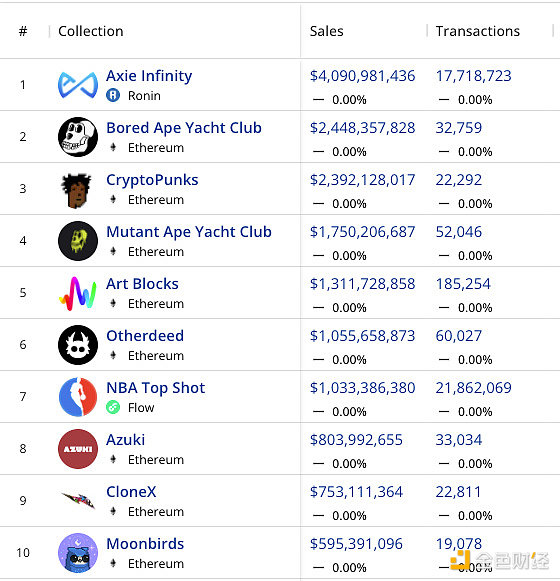
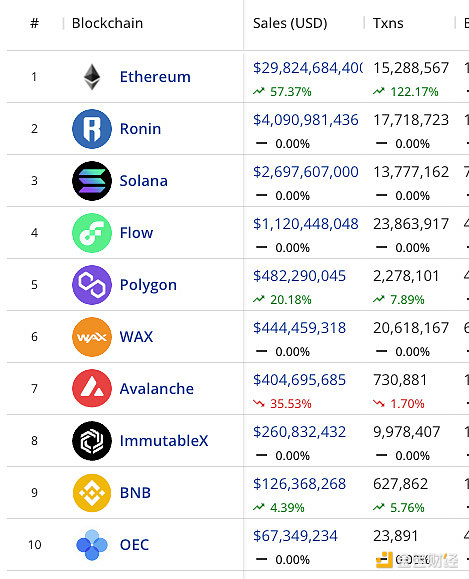
In spite of a decline this year, Axie Infinity remains a leader in NFT sales. To date, the creation of Sky Mavis has completed about 17 million transactions in their personal games. Beaten by the NBA’s No. 1 in just 21 million trades.
What I find interesting is that only two nfts account for about 20% of Etheruem (punk and BAYC) trading volume. Low-cost chains such as Solana, Polygon and Avalanche are catching up — but they may need another cycle to scale up.
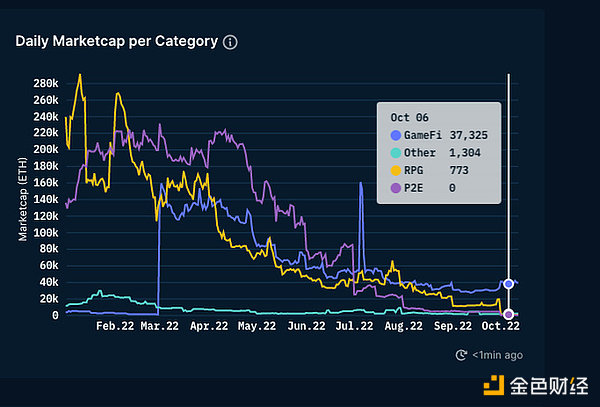
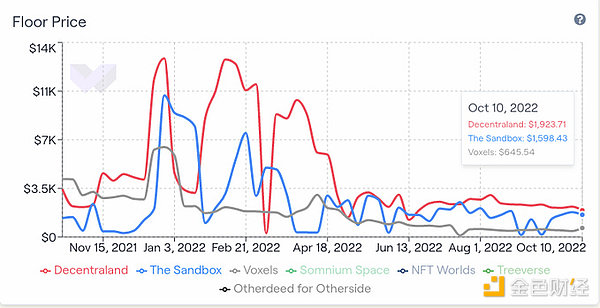
One area that has collapsed is the cost of land in virtual worlds. Land floor prices on both the Sandbox and Decentraland platforms have fallen by about 80 per cent. It’s not just land prices that are falling.
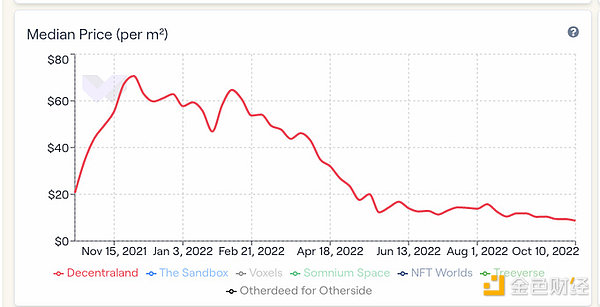
Overall demand for real estate in virtual worlds could fall sharply. The median price per square metre of land on Decentaland has fallen from $70 to about $12-(related to the decline in BTC and eth prices)
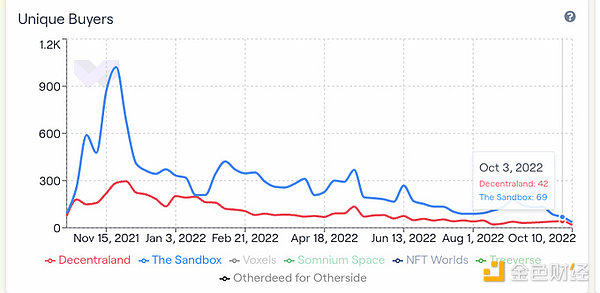
What worries me (and this may be wrong) is that only about 100 people a day are buying“Virtual world real estate” in the two largest virtual world land projects. There are more vcs than users investing in projects in the meta-world.
The number of parcels sold is also falling. These virtual world projects are signs of reduced mobility for existing landowners. In the first week of December, Decentraland and Sandbox sold about 2,200 units. Now that number has dropped to a few hundred a week.
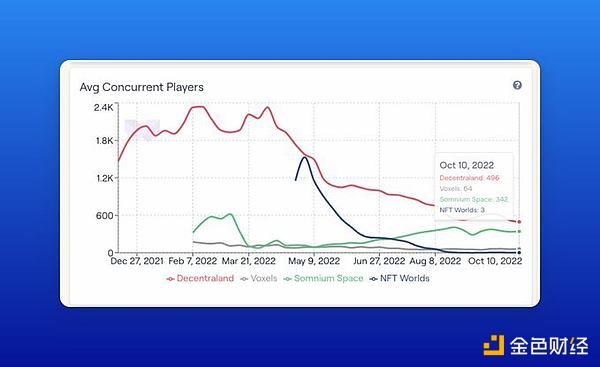
While we lashed out at how“Bad” Meta and Fortnite Meta sections are-it’s worth considering that some of our most famous Meta sections have an average concurrent user base of about 2,000 users… We need better bridges… … to the meta-universe.
Speaking of bridges… … There are now over a million wallets interacting with some form of bridge. A conservative estimate — that’s 10 percent of all wallets that interact with DEFI. It is still in its early stages, but growing fast.
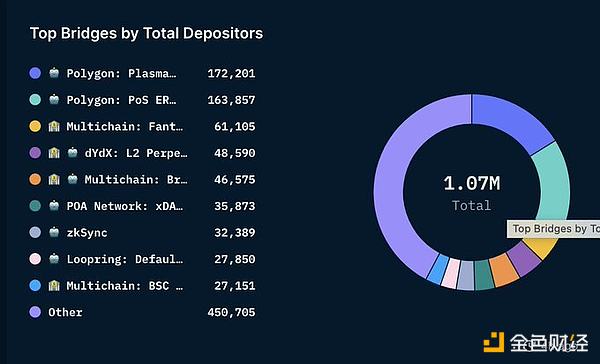
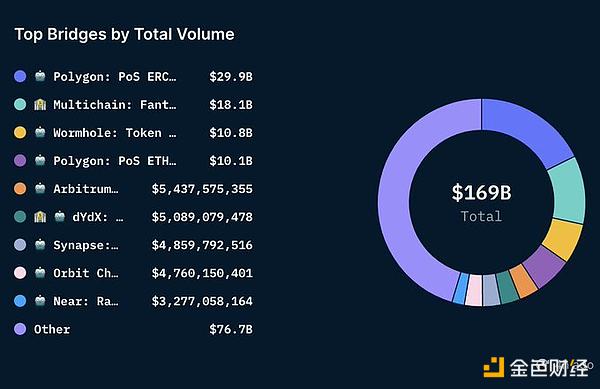
Polygon’s bridge alone managed an inflow of about $29 billion. It was also impressive to see more than $1 billion in transactions across multiple non-chain-specific bridges. The aggregator may contribute to this digital scaling.
Overall, however, bridge TVL has declined — from more than $50 billion to about $15 billion now. This may be in step with falling asset prices, fears of hacking and a lack of token incentives.
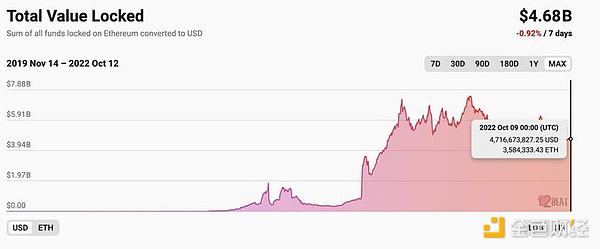
In the case of Tier 2, things are very different. Despite the pain of the past six months, their TVL has only increased from about 7.5 billion to 4.7 billion. This may be facilitated in part by the expected airdrops.
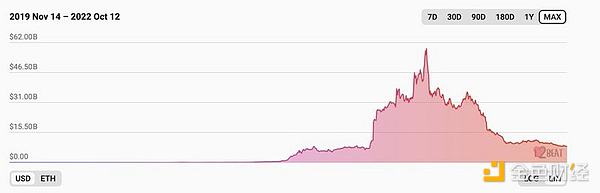
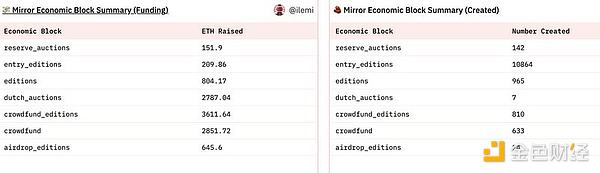
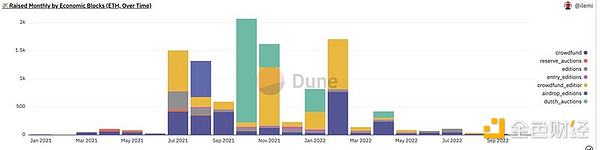
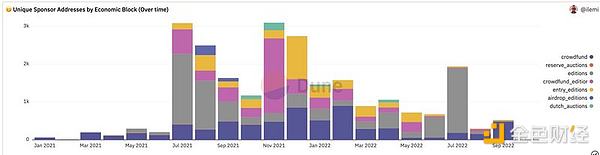
Still, they have been powering more and more consumer applications. The@viamirror is one of the best examples. The platform has raised nearly 10,000 ETH. It is becoming the preferred platform for creators who want to monetize their work.
The bear market has taken its toll on generosity — monthly net wage increases have been falling. But it’s interesting to note their growth. One way to think about it is that-Mirror may be distributed to authors more often in a year than Medium is in a decade.
Mirror is still a niche market. At its peak — they had 3,000 wallets to sponsor ideas. Now it goes down To-500. But it is safe to say that they have pioneered a different model with relative success.
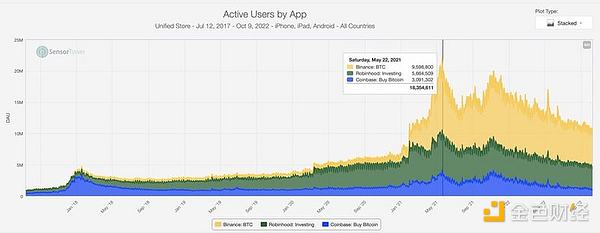
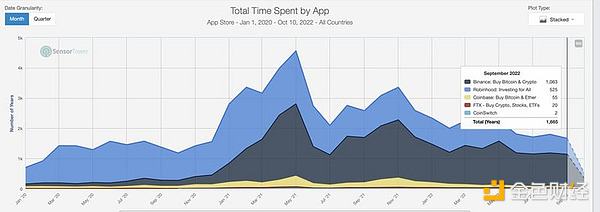
Finally, I summarized some data about mobile applications — and how they compare to traditional variants. The figure below shows the Dau for coinbase, Binance, and Robin Hood. At its peak, Binance’s Dau was almost twice as big as Robin Hood’s (though it was a global app)
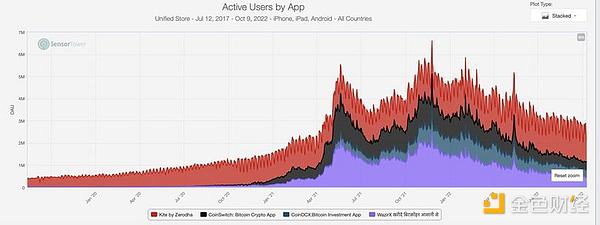
I wonder if this trend will continue in a regional market like india-Zerodha is the number one stock trading app here. You can see how the interest in encryption is slowly spreading to the point where there are more Dau’s than there are established players.
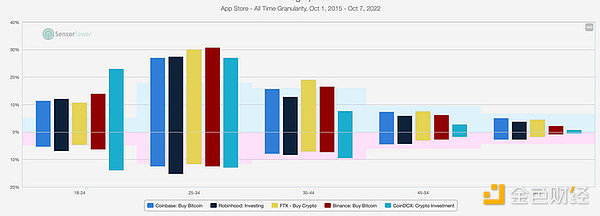
The demographics of these applications are broadly similar. The largest user base for these digital investment applications is almost always 25-34 years old. Coinbase has a very large gen-z user base. Top = men, bottom = women
The price drop didn’t really translate into a significant reduction in the amount of time spent on these applications. At its peak, Chien an spent nearly 1800 years a month on the app. That number is now down to about 1063. People still like tokens.
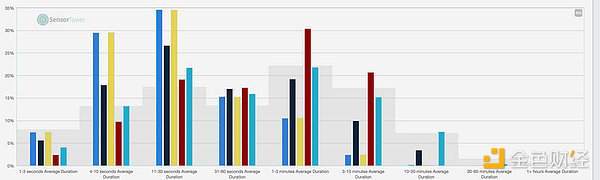
I do find it interesting that people spend very little time per conversation. Most users of these financial applications spend an average of about 30 seconds per session. Part of the reason is that the mobile interface is not good for trading. The data on the desktop may look very different.
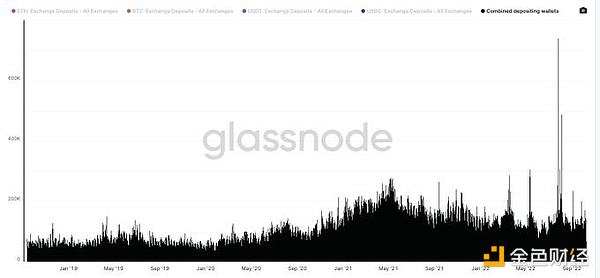
This chart ends — it shows the cumulative exchanges of the USDT, USDC, ETH, and BTC in your wallet. In 2019-it’s trending around 60k on a given day. Today, the figure is closer to 180k. I use this metric as a rough measure of market growth.
Like what you're reading? Subscribe to our top stories.
We will continue to update Gambling Chain; if you have any questions or suggestions, please contact us!
